1Q19 Earnings Presentation - JBS S.A - A GLOBAL FOOD COMPANY - MarketScreener.com

Page created by Franklin James
 
CONTINUE READING
1Q19 Earnings Presentation - JBS S.A - A GLOBAL FOOD COMPANY - MarketScreener.com
JBS S.A. – A GLOBAL FOOD COMPANY

1Q19 Earnings Presentation
1Q19 Earnings Presentation - JBS S.A - A GLOBAL FOOD COMPANY - MarketScreener.com
DISCLAIMER
We make statements about future events that are subject to risks and uncertainties. Such statements are based on the beliefs and assumptions of our Management
and information to which the Company currently has access. Statements about future events include information about our current intentions, beliefs or expectations,
as well as those of the members of the Company's Board of Directors and Officers.

Disclaimers with respect to forward-looking statements and information also include information on possible or presumed operating results, as well as statements that
are preceded, followed or that include the words "believe," "may," "will," "continue," “expects," "predicts," "intends," "plans," "estimates," or similar expressions.

Forward-looking statements and information are not guarantees of performance. They involve risks, uncertainties and assumptions because they refer to future events,
depending, therefore, on circumstances that may or may not occur. Future results and shareholder value creation may differ materially from those expressed or implied
by the forward-looking statements. Many of the factors that will determine these results and values ​are beyond our ability to control or predict.

                                                                                                                                                                         2
1Q19 Earnings Presentation - JBS S.A - A GLOBAL FOOD COMPANY - MarketScreener.com
1Q19 HIGHLIGHTS

 Net revenue was R$44.4Bn, up 11.5%

 Consolidated gross profit grew by 13.3% to R$5.8Bn, with a 13.2% gross margin

 Consolidated EBITDA increased by 14.4% to R$3.2Bn, with a 7.2% EBITDA margin

 Reported net income was R$1.1Bn, an EPS of R$0.41

 Operational Cash Flow of R$749.6Mn

 Leverage in US$ was 3.10x

                                                                                  3
1Q19 Earnings Presentation - JBS S.A - A GLOBAL FOOD COMPANY - MarketScreener.com
1Q19 CONSOLIDATED RESULTS
Net Revenue (R$ million)                                                   Gross Profit (R$ million)
                                                                                   Gross margin (%)

                           44,370.3                                                                     13.2%
      39,783.2                                                                  13.0%
                                      Net revenue in 1Q19 was                                                     Gross profit in 1Q19 was

                                      R$44.4Bn                                                                    R$5.8Bn
                                                                                5,152.1                 5,836.5
                 11.5%
                                      11.5% Increase compared with 1Q18.
                                                                                               13.3%
                                                                                                                  Gross margin was 13.2%

       1Q18                 1Q19                                                 1Q18                   1Q19

EBITDA (R$ million)                                                         Net Income/Loss (R$ million)
                                                                                     Earnings per share (R$)
       EBITDA margin (%)

                                                                                                                     Net income was
                                                                                                          0.40

                                                                                                                     R$1.1Bn
       7.0%                 7.2%      EBITDA in 1Q19 was

                                      R$3.2Bn
                                                                                  0.18
                                                                                                        1,092.7
                                                                               Lucro Líquido

                 14.4%                                                                                               Earnings per share was
      2,788.5              3,191.3                                               506.5         115.7%

                                                                                                                     R$0.41
                                      7.2% EBITDA margin

       1Q18                 1Q19                                                 1Q18                   1Q19

                                                                                                                                              4
1Q19 Earnings Presentation - JBS S.A - A GLOBAL FOOD COMPANY - MarketScreener.com
1Q19 CONSOLIDATED RESULTS
Operational Cash Flow (R$ million)                                   Free Cash Flow (R$ million)

                                       749.6                                            1Q18                  1Q19
                         359.0%
            163.3                                                                       -109.5

            1Q18                       1Q19
                                                                                                              -711.8

        Cash flow generated by operational activities increased by               Free cash flow in 1Q19 was
        359.0% in 1Q19, reaching

        R$749.6Mn                                                                -R$711.8Mn
                                                                                                                       5
1Q19 Earnings Presentation - JBS S.A - A GLOBAL FOOD COMPANY - MarketScreener.com
DEBT PROFILE
                                                      Gross Debt Reduction (US$ Bn)                              Net Debt (million)/Leverage
       1Q19 Ending Cash Balance
                                                       US$2.54 billion / (R$9.9 billion¹)
         was   R$7.4Bn                                                                                                                      Net debt (R$)
                                                                                                                                            Leverage (R$)
                                                                                                                                                                                       Net debt (US$)
                                                                                                                                                                                       Leverage (US$)
       Additionally, JBS USA has
        US$1,899.5 million (R$7,401.8                               16.9
        million)¹ in fully available
        unencumbered line under                                                                                                   3.24                                                             3.20
                                                                                                                                                                   3.18
        revolving credit facilities
                                                                                     14.5                 14.4
                                                                                                                                  3.13                                                             3.10
       Total liquidity was                                                                                                                                        3.01

         R$14.8Bn                                                                                                          45.5                             47.2                            48.7

      Almost 5.0x higher than short-
      term debt                                                                                                                          13.7                             12.2                            12.5

                                                                     1T18
                                                                    1Q18            4T18
                                                                                    4Q18                  1T19
                                                                                                          1Q19                    1Q18                             4Q18                            1Q19

                Debt profile ST/LT                                      Source breakdown                         Entity breakdown                                         Currency and cost breakdown

                                               ST                                           Banks 24.6%                                                                      8.84% p.a.
                                              5.5%                                                                Seara                                                          R$ 4.8%
                                                                                                                   6.2%                             JBS USA
                                                                                                                                                     66.2%

                               LT
                             94.5%
                                                                                                                     JBS S.A.                                                                                 US$
                                                                       Capital Markets                                27.6%                                                                                  95.2%
                                                                           75.4%                                                                                                                           5.88% p.a.
¹ Converted using the prevailing FX rate at the end of the period                                                                                                                                                        6
1Q19 Earnings Presentation - JBS S.A - A GLOBAL FOOD COMPANY - MarketScreener.com
LIABILITY MANAGEMENT
Debt Amortization Schedule as of March 31st (in US$ million)                                          Debt Amortization Schedule after LM (US$ million)
                                                                        Cash                                                                                                               Cash
                         3,331   3,425                                  Revolving credit facilities                                                                      2,863             Revolving credit facilities

       1,900
                                                                                                                                                                 2,041
                                                         1,891                                                1,900             1,640                    1,650
                                                 1,500                                                                                                                                                  1,400
                                         1,185                                                                                                   1,185
                                                                        855       892                            743                                                                855        892
          798
  1,902                                                          463
                                                                                                         1,100                            293
                  69                                                                         0                           44

  Cash
  Caixa   Short
          Curto   2020   2021    2022    2023    2024    2025    2026   2027     2028      2029          Cash
                                                                                                         Caixa   Short
                                                                                                                 Curto   2020   2021      2022   2023    2024    2025        2026   2027       2028      2029
          Term
          Prazo                                                                                                  Term
                                                                                                                 Prazo

                                 Average term: 4.3 years                                                                                 Average term: 6.0 years

Liability Management                                                                                  JBS Bond Yield-To-Maturity Evolution (%)

 On May 10, 2019, JBS concluded the payment of R$2.36 billion (US$600 million)                         8.0
   related to the amortization of part of the debt covered by Normalization
                                                                                                        7.5
   Agreement entered with certain financial institutions.
                                                                                                        7.0
 Until the end of May, the Company intends to prepay an additional US$400 million
   of debts under the Normalization Agreement and other debt, totaling US$1.0 billion                   6.5
   of debt reduction in the second quarter of 2019, using approximately US$500
                                                                                                        6.0                                                                                           6.086
   million from the issuance of Senior Notes (Bonds) maturing in 2026, issued on April
                                                                                                                                                                                                      5.807
   4th, 2019, and another US$500 million from free cash generation.                                     5.5
 According to the terms of the Normalization Agreement, the payments made thus
   far entitle the Company, but do not oblige it, to terminate such agreement.
                                                                                                                                       JBS USA 2028        JBS Brasil2026
                                                                                                                                                           JBS Brazil 2026
                                                                                                                                                                                                                7
1Q19 Earnings Presentation - JBS S.A - A GLOBAL FOOD COMPANY - MarketScreener.com
Business Unit Performance
1Q19 Earnings Presentation - JBS S.A - A GLOBAL FOOD COMPANY - MarketScreener.com
SEARA
Net Revenue (R$ million)                        EBITDA (R$ million and %)                               Seara products

                                4,197.3                    8.3%
          3,974.5                                                             6.6%

        Receita Líquida Seara

                       5.6%
                                                          330.2
                                                                             278.0
                                                                   -15.8%

           1Q18                 1Q19                      1Q18               1Q19

 1Q19 Highlights
 |   Net revenue totaled R$4.2 billion, 5.6% higher than 1Q18, essentially due to price increases of 13.9% and 18.4% in the domestic and export markets, respectively.
     Total volumes were lower than 1Q18, mainly in fresh chicken, partially as a result of the decertification of certain facilities to export to Saudi Arabia and of the
     Company’s focus on price increases. Domestic prepared foods volumes increased by 5.2%.
 |   EBITDA in 1Q19 reached R$278.0 million with an EBITDA margin of 6.6%, impacted by higher raw material costs, partially offset by higher sales prices.
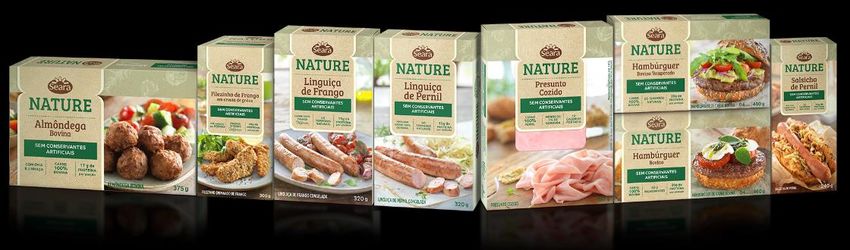
 |   With continuous focus on innovation, Seara recently launched new products that have a health and convenience appeal. The Seara Nature line, which is made
     with natural ingredients, noble meats, without artificial food preservatives, reduced sodium and no lactose. Additionally, Seara Gourmet launched the Incredible
     Burger, an option for vegans with an unmistakable meat flavor, but made with 100% vegetable ingredients, and also the long-awaited Seara Organic Chicken.

                                                                                                                                                                            9
1Q19 Earnings Presentation - JBS S.A - A GLOBAL FOOD COMPANY - MarketScreener.com
JBS BRAZIL
Net Revenue (R$ million)                        EBITDA (R$ million and %)                               JBS Brazil products

                                6,764.2
           6,300.3                                                            2.9%
                                                           -1.6%

                      7.4%

                                                                             195.0
                                                           -100.9

            1Q18                 1Q19
                                                           1Q18              1Q19

 1Q19 Highlights
 |   Net revenue of R$6.8 billion, which corresponds to an increase of 7.4% over 1Q18, with the number of bovine processed growing 2.9% in the period.
 |   EBITDA for the quarter was R$195 million, with a 2.9% margin, reversing the negative result posted in the same period last year.
 |   In the domestic market, net revenue was R$3.8 billion, a 2.7% increase when compared with 1Q18. A positive highlight was the 7.1% price increase in fresh beef.
 |   In the export market, which represented 44% of this business unit’s sales, net revenue increased by 13.9% to R$3.0 billion, with an increase of 8.8% in volume and 4.7%
     in average sales prices.

                                                                                                                                                                               10
JBS USA BEEF
Net Revenue (US$ million)                      EBITDA (US$ million and %)                                 JBS USA Beef products

                                                          6.1%               5.0%
       5,060.2             5,008.8

                  -1.0%                                   308.2
                                                                             251.4
                                                                   -18.4%

        1Q18                1Q19                          1Q18               1Q19

 1Q19 Highlights
 |   Net revenue increased by 1.4%, excluding 5 Rivers net revenue, sold at the end of 1Q18. d of 1Q18.
 |   Average sales prices for the quarter increased by 0.4% and production volume grew by 1.8%, mainly outside of the US.
 |   Exports increased both in volume and prices when compared with 1Q18.
 |   In the United States, this quarter results were affected by climate events that impacted the activities of delivering and slaughtering cattle in some of the Company’s
     facilities in the country. Nevertheless, cattle availability and demand for beef continue improving, while the industry’s capacity remains stable, which indicates the
     continuation of a positive and growing margin scenario for upcoming quarters.
 |   In Australia, results were higher than same quarter of last year, with a significant growth in exports posted an impressive growth, with Asia, notably China and South
     Korea, being the main highlight.

                                                                                                                                                                              11
JBS USA PORK
Net Revenue (US$ million)                      EBITDA (US$ million and %)                              JBS USA Pork products

                                                           12.1%
                                                                             7.9%
           1,466.2
                               1,335.5                     177.7
                      -8.9%                                        -40.7% 105.4

            1Q18                1Q19                       1Q18              1Q19

 1Q19 Highlights
 |   JBS USA Pork net revenue was U$1.3 billion in 1Q19, a 8.9% decrease in relation to 1Q18. This result is mainly due to a 13% decrease in average sales prices, impacted
     by a 4% increase in pork production during the period. EBITDA was US$105.4 million, with a 7.9% EBITDA margin.
 |   The increase in pork supply in the US during 1Q19 limited the potential to reach a margin level comparable to 1Q18, while lower exports also pressured domestic
     prices. Additionally, although hog production in the US continues to grow, news about the evolution of African Swine Fever in China and Europe contributed to an
     increase in spot and future prices of live hogs.
 |   Management continues to closely monitor the events related to ASF in Asia and believes that the environment for global trade of pork and potentially other animal
     proteins may change, with the magnitude of the impacts from the disease in the Chinese hog herd yet to be confirmed.
 |   Plumrose continues to excel in the execution of its strategy to increase production capacity, grow its sales and develop branded products. Its performance for the
     quarter was one of the best since its acquisition in 2017.
                                                                                                                                                                              12
PILGRIM’S PRIDE
Net Revenue (US$ million)                      EBITDA (US$ million and %)                                 PPC products

                                                          9.9%
                                                                            7.5%
           2,746.7            2,724.7

                     -0.8%
                                                          271.8
                                                                   -24.8% 204.4

            1Q18                1Q19                      1Q18              1Q19

 1Q19 Highlights
 |   Net revenue from US operations increased by 2.3% as a result of 1.4% higher sales prices and 0.9% higher volumes.
 |   Still in the US, a more favorable environment was experienced during 1Q19, with feature activities normalized to seasonal levels in retail and foodservice and a
     recovery in commodity poultry prices.
 |   In Mexico, net revenue was 9.7% lower in comparison to the same period of last year, mainly due to a 9.4% decrease in sales prices, as a result of softer demand for
     chicken combined with more availability of imported pork from the US. Nevertheless, management believes chicken demand will continue to grow in-line with
     historical rates longer term.
 |   In Europe, net revenue decreased by 5.4% as a result of an unfavorable FX rate impact and 4.2% lower volumes, which were partially compensated by 5.3% higher
     sales prices.

                                                                                                                                                                            13
A UNIQUE GLOBAL PLATFORM
    CANADA   3%

                                                               EUROPE     5%

             USA   51%                                                                                     ASIA   15%
                                                                               AFRICA & MIDDLE
                                                                                  EAST   3%
              MEXICO     4%
                                                                                                                                              AUSTRALIA &
                                                                 BRAZIL   14%                                                                NEW ZEALAND

                                S. AMERICA                                                                                                       4%
                                      1%

                              over15 countries
                         Present in                                                               Beef      Lamb          Pork

                                      With over 400 facilities and                               Poultry    Leather     Commercial Offices
                                                offices.

                                                                                                                                                            14
CONSOLIDATED EXPORTS
      Exports destinations of JBS in 1Q19

                                                                                      Greater China¹            23.8%

                                                                                      Africa & Middle East      13.5%

                                                                                      Japan                     12.1%
                                              2.7%              23.8%                 South Korea               11.3%
                                                  6.4%
                                                                              12.1%   USA                        9.2%

                                       9.2%                                   11.3%   E.U.                       6.4%

                                6.0%                                                  Mexico                     6.0%

                                                                                      South America              3.1%
                                                              13.5%
                                                                                      Canada                     2.7%

                                                                                      Others                    11.9%
                                               3.1%
                                                                                        Asia corresponded to

                                                                                             47.2%
                                                                                             of total exports

                                               1Q19 total exports: US$2.9Bn

Note 1: Consider China and Hong Kong
                                                                                                                        15
OUR MISSION
   “To be the best in all that we do, completely focused on our business,
 ensuring the best products and services to our customers, a relationship of
trust with our suppliers, profitability for our shareholders and the opportunity
                of a better future for all of our team members.”
You can also read