Job-to-job transitions and the regional job ladder - Working paper 2020/01 March 2020 - New ...
←
→
Page content transcription
If your browser does not render page correctly, please read the page content below
Job-to-job transitions and
the regional job ladder
Working paper 2020/01

March 2020
Authors: Andrew Coleman and Guanyu Zheng
The New Zealand Productivity Commission
Te Kōmihana Whai Hua o Aotearoa1

The Commission – an independent Crown entity – completes in depth inquiry reports on topics selected by
the Government, carries out productivity related research and promotes understanding of productivity
issues. The Commission aims to provide insightful, well-formed and accessible advice that leads to the best
possible improvement in the wellbeing of New Zealanders. The New Zealand Productivity Commission Act
2010 guides and binds the Commission. Information on the Productivity Commission can be found on
www.productivity.govt.nz or by contacting +64 4 903 5150.
How to cite this document: Coleman, A. & G. Zheng (2020). Job-to-job transitions and the regional job
ladder. New Zealand Productivity Commission. Available from www.productivity.govt.nz
Date: March 2020
Authors: Andrew Coleman and Guanyu Zheng
JEL classification: J2, R1, R3
ISBN: 978-1-98-851946-3 (online)
Copyright: This copyright work is licenced under the Creative Commons Attribution 4.0 International
Licence. In essence you are free to copy, distribute and adapt the work, as long as you attribute the source
of the work to the New Zealand Productivity Commission (the Commission) and abide by the other licence
terms. To view a copy of this licence, visit www.creativecommons.org/licenses/by/4.0/. Please note this
licence does not apply to any logos, emblems, and/or trademarks that may be placed on the Commission’s
website or publications. Those specific items may not be reused without express permission.

 Disclaimer
 The contents of this report must not be construed as legal advice. The Commission does not accept
 any responsibility or liability for an action taken as a result of reading, or reliance placed because of
 having read any part, or all, of the information in this report. The Commission does not accept any
 responsibility or liability for any error, inadequacy, deficiency, flaw in or omission from this report.

 The results in this report are not official statistics. They have been created for research purposes from
 the Integrated Data Infrastructure (IDI), managed by Stats New Zealand.

 The opinions, findings, recommendations, and conclusions expressed in this report are those of the
 author(s), not Stats NZ, nor any other Productivity Hub agencies.

 Access to the anonymised data used in this study was provided by Stats NZ under the security and
 confidentiality provisions of the Statistics Act 1975. Only workers authorised by the Statistics Act 1975
 are allowed to see data about a particular person, household, business, or organisation, and the
 results in this report have been confidentialised to protect these groups from identification and to
 keep their data safe.

 Careful consideration has been given to the privacy, security, and confidentiality issues associated
 with using administrative and survey data in the IDI. Further detail can be found in the Privacy impact
 assessment for the Integrated Data Infrastructure available from www.stats.govt.nz

1
 The Commission that pursues abundance for New Zealand
Contents
Overview ........................................................................................................................................ 1
1 Introduction ........................................................................................................................... 2
2 Defining job-to-job transitions ............................................................................................... 4
 2.1 The LEED data .............................................................................................................................. 4
 2.2 Job-to-job transitions ................................................................................................................... 5
3 Descriptive statistics on job-to-job transitions ....................................................................... 8
 3.1 National average........................................................................................................................... 8
 3.2 Regional patterns .......................................................................................................................... 9
 3.3 Industry patterns ......................................................................................................................... 12
 3.4 Time patterns .............................................................................................................................. 14
 3.5 Employment transition status .................................................................................................... 15
4 Job-to-job transitions and wage premiums.......................................................................... 17
 4.1 Methodology .............................................................................................................................. 17
 4.2 Descriptive statistics ................................................................................................................... 18
 4.3 Regression analysis on wage premiums on job-to-job transitions .......................................... 22
 4.4 Wage premiums for locations, industries and firm sizes .......................................................... 25
5 House prices and worker mobility ....................................................................................... 28
 5.1 Data and method ........................................................................................................................ 28
 5.2 Exploratory analysis on house prices and worker mobility ...................................................... 30
 5.3 Regression results ....................................................................................................................... 33
6 Conclusion ........................................................................................................................... 37
References .................................................................................................................................... 39
Appendix A Additional analysis on the impacts on wage premiums ............................................ 41

Tables
Table 1 Illustration of job-to-job calculations ........................................................................................... 6
Table 2 Job-to-job transition rates by demographic group (2000-2018) ............................................... 8
Table 3 Job-to-job transition rates by city groups (2000-2018, all industries) ........................................ 9
Table 4 Job-to-job transition rates by city groups (2000-2018, non-tradable industries).................... 10
Table 5 Job-to-job transition rates by industry (2000-2018) .................................................................. 13
Table 6 Job-to-job transition rates by year (2000-2018) ........................................................................ 14
Table 7 Job-to-job transition rates by previous employment status (2000-2018) ................................ 16
Table 8 Real wage growth rates by job-to-job transition status (2000-2018) ....................................... 19
Table 9 Distributions of real wage growth by job-to-job transition status (all workers, 2000-2018) ... 21
Table 10 Estimated wage growth premiums relative to workers who change jobs and remain
 in the same industry and location (all workers, 2000-2018) ...................................................... 23
Table 11 Estimated wage premiums by origin and destination locations (all workers, 2000-2018) ..... 25
Table 12 Estimated wage premiums by firm sizes at origin and destination jobs (all workers,
 2000-2018) ................................................................................................................................... 26
Table 13 Estimated wage premiums by industries at origin and destination jobs (all workers,
 2000-2018) ................................................................................................................................... 27
Table 14 Regression results of gravity models ......................................................................................... 34

Figures
Figure 1 Job-to-job transition rates on workers who remain in the same industry (2000-2018)........... 11
Figure 2 Job-to-job transition rates on workers who change industries (2000-2018) ........................... 11
Figure 3 Job-to-job transition rates, 2000-2018 ...................................................................................... 15
Figure 4 Average adjusted wage changes by job-to-job transitions status .......................................... 20
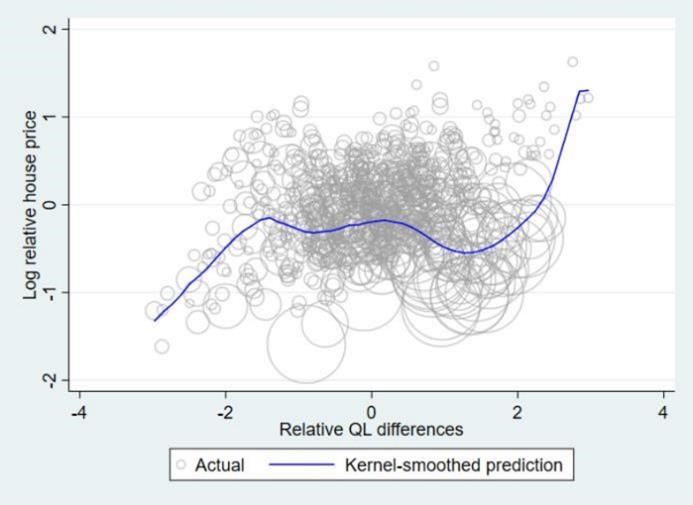
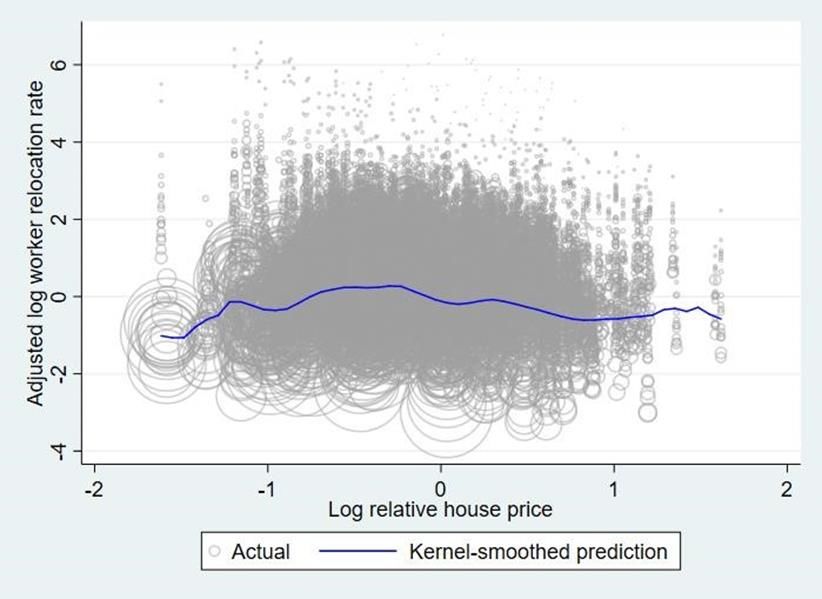
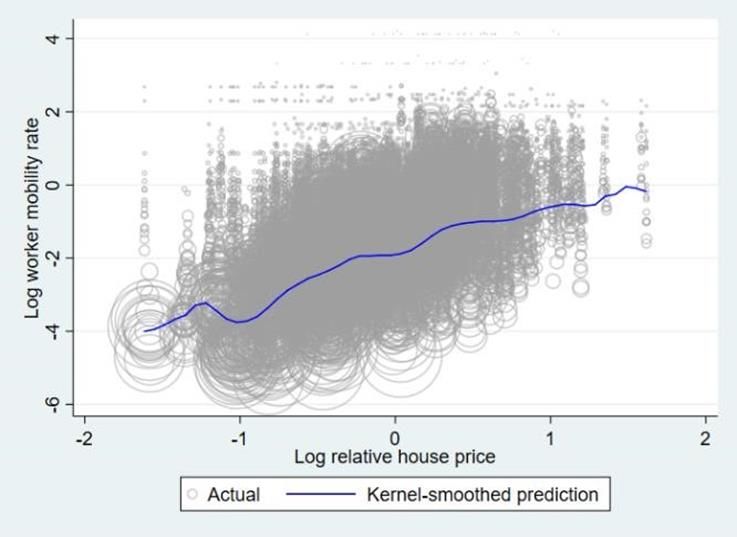
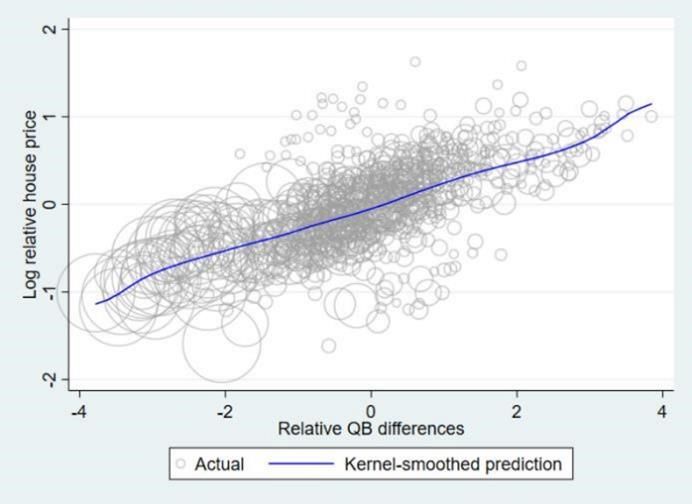
Figure 5 Distributions of real adjusted wage growth by job-to-job transition status (all workers, 2000-
 2018)............................................................................................................................................. 21
Figure 6 Average relative wage premiums by age groups to workers who changes job but
 remain in the same industry and location ................................................................................. 24
Figure 7 Job-to-job transition rates in different locations at broad regions and 30 cities,
 2001-2017 .................................................................................................................................... 30
Figure 8 Job-to-job transition rates at regions by regions ..................................................................... 31
Figure 9 Scatter plot of worker mobility and house prices ..................................................................... 31
Figure 10 House prices and quality of life indicators ................................................................................ 32
Figure 11 House prices and quality of business indicators ....................................................................... 32
Figure 12 Adjusted worker mobility and house prices.............................................................................. 33
Figure 13 Marginal change in worker mobility rates by cross-city moves (1% increase in relative house
 prices) .......................................................................................................................................... 35
Figure 14 Marginal changes in worker mobility rate by industry (1% increase in relative
 house prices) ............................................................................................................................... 36

Overview 1 Overview This paper uses linked employee-employer data to examine the frequency with which workers change jobs in New Zealand, wage premiums associated with these job transitions, and the impact of house prices on worker mobility. Transitions are measured annually (based on March-years) between 2000 and 2018 and show that: On average over a year 61% of workers remain in their jobs, 21% switch jobs, and 18% of workers exit the workforce. Job-to-job transitions are thus an important dimension of the labour market in New Zealand. In relation to the 21% of workers switching jobs, about 5 percentage points involve a change in firm but not region or industry. Of the remaining 16 percentage points, 4 percentage points involve a change in region only, 6 percentage points involve a change in industry only, and 6 percentage points involve a change in both industry and region. This paper also breaks down these aggregate figures along several dimensions. For example, there are few differences in job-continuation rates among large and medium sized urban areas, but small and rural areas have lower job continuation rates, which largely reflect higher exit rates. In relation to job switches, while the share of workers making job switches in Auckland is little different to other regions, workers in this city are likely to remain in Auckland when they switch jobs. 76% of workers switching jobs in Auckland remain there, compared to 53% of workers switching jobs nationally remaining in their origin region. Conversely, in small cities and minor urban areas workers are likely to change regions when they change jobs (with only 23-29% of workers switching jobs remaining). Looking at different time periods (particularly before and after the global financial crisis (GFC)), there was an increase in the continuation rate (which has tailed off but still remains high by historical standards) and a fall in the job-to-job transition rate. There was also a sizeable fall in the entry rate and, from 2012, a fall in the exit rate. A second part of this paper estimates wage premiums associated with these job-to-job transitions. This analysis is complicated by the lack of data on hours of work – as it is not possible to fully distinguish transitions between part-time and full-time work. A proxy is thus used to capture these changes at low wage rates (ie, around minimum wage). This analysis shows that if workers move to other cities to take up new jobs the average wage premiums they earn are not particularly large. For all workers, stayers had real wage growth of 3.0%, while changers had growth of 4.6%. Auckland and Wellington have 1.5% and 1.3% wage premiums respectively above Christchurch. These small wage premiums could reflect barriers to worker mobility in New Zealand. A third part of this paper thus investigates the relationship between worker mobility and house prices in New Zealand and finds that: Increasing relative house prices did not on aggregate slow worker mobility, although this partly reflected the relationship between house prices and consumption and productive amenities. When these amenity values were accounted for, then an increase in house prices does on average have a small negative effect on worker mobility. For particular industries, however, the effect can be significant, particularly for the agriculture, manufacturing, health and education industries.
2 Job-to-job transitions and the regional job ladder 1 Introduction This paper uses linked employer-employee data to examine the frequency with which workers change jobs in New Zealand. The primary focus is whether workers in small centres climb the “job-ladder” differently than workers in large centres and whether these differences have implications for wage growth, productivity and inequality. Why does the frequency of job changes matter? In the last two decades the greater availability of linked employer-employee data has allowed a greater understanding of the role of job-to-job transitions in influencing inequality, regional productivity, wage growth and even inflation (see Box 1). Box 1 Key findings from the international literature on job-to-job transitions Direct job-to job transitions without a period of unemployment are the most common way workers move from one job to another. They are also the most common way that firms gain and lose employees and the main way workers move between industries. When workers leave one firm, half or fewer find a job in the same industry, while the rest switch industries (Golan, Lane and McEntarfer 2007; Bjelland et al., 2011). The frequency of shifting jobs is much higher for young workers and this is an important way workers increase their wages. While workers tend to move to higher paying firms, this often means shifting to small, young and growing firms (Haltiwanger et al., 2018). In Germany there has been a documented increase in the extent that these job-to-job transitions result in a movement of the best quality workers to the best quality firms (Card, Heining and Kline 2013). The type of work done in large cities and small cities has changed in the last three decades. The new jobs associated with the information revolution are disproportionately located in large cities, particularly those with large university-educated workforces. The number of educated workers has increased fastest in large cities and wage inequality has increased faster in big cities than small cities, as the relative renumeration of workers without tertiary education has disproportionately declined in large cities (Baum-Snow and Pavan 2013; Berger & Frey, 2016). In the U.S., the changing wage premiums for educated workers in large and small cities has led to a reduction in the flow of less-educated workers to big cities, with a resultant decline in the movement up the job ladder (Schleicher, 2017). In addition, middle-skill workers have increasingly found less skilled work in smaller cities (Autor, 2019). A large fraction of the increase in national wage inequality that has occurred since 1990 reflects differences in the wages paid by different firms (Barth et al 2016; Card, Heining and Kline 2013). There are increasing differences in the productivity levels of different firms operating in the same industry, and these are reflected in wages paid by different firms to ostensibly similar workers. Since job-to-job transitions are the main way workers find work in these firms, the quality of the matching process is an important determinant of the extent that individuals find productive, high-paying jobs. The basic story is simple and revolves around the concept of a “job ladder.” When workers enter the workforce, they are hired by an employer to do a particular job in a particular industry. This match is hardly ever perfect, and many workers subsequently find a different position in a different firm, sometimes doing a similar job in a similar industry, other times swapping occupations or industries, and, at least when young, climbing a job ladder in terms of skills, seniority and wages. Most of these employment changes take place as direct job-to-job transitions, with the person moving from one position to another without leaving the workforce or experiencing a period of temporary
2 | Defining job-to-job transitions 3

unemployment. When workers change firms, the identity of the new firm and the overall quality of the
match are very important as they have a large effect on a person’s career and income.

While the issues in Box 1 provide the context for this paper, the paper does not directly address all of
them. Rather, it analyses the extent that job-to-job transitions vary across different sized cities to
ascertain if the way that these transition paths occur in different cities may explain aspects of their
economic performance. The paper is organised into the following chapters. Chapter 2 describes the
background information on the employment data and defines different types of job status. Chapter 3
shows descriptive statistics on job-to-job transactions. Chapter 4 reports regression analysis to estimate
wage premiums associated with job-to-job transitions. Chapter 5 investigates whether high house
prices are a possible barrier to work mobility. Chapter 6 concludes.
4 Job-to-job transitions and the regional job ladder 2 Defining job-to-job transitions 2.1 Data The data in this paper are based on the linked employer-employee dataset created by Fabling and Maré (2015). The dataset comprises information concerning all paid jobs from March 2000 to March 2018 is taken from the Employer Monthly Schedule (EMS)2. These jobs are matched to the enterprises and plants recorded in the business register. The data measure the number of jobs, and the amount each staff member is paid, but the EMS does not include a vital component of labour inputs, the number of hours each employee works. To improve the measurement of firm labour inputs, Fabling and Maré (2015) derived an estimate of Full-Time Equivalent (FTE) employees using a plausible set of assumptions concerning workers’ income, such as the statutory minimum wage and the hourly wage earned in sequential months. If a worker receives a lower monthly income than that which would be earned by a full-time worker earning the minimum wage, that worker is likely to be recorded as a part- time worker. However, these derived FTE measures may overstate the true labour input for a subset of workers (eg, workers who are paid at a high hourly rate and work less than 30 hours a week). Overall, we believe that these derived FTE measures are superior to the simple headcount measure that is often used, as it does not assume all workers work the same number of hours. In this study, person-level job-to-job flows and job-earnings are analysed on an annual basis. This involves taking snapshots of workers’ jobs and job-earnings during March months from 2000 to 2018 and comparing person-level job information between two adjacent years, such as March 2001 and March 2002. March-years are chosen because most New Zealand businesses use 31 March as the end of the accounting year. For the period covered in this study the linked employer-employee database had a total of 35 943 300 unique person-jobs for workers aged 15 years old and over. However, to make the data comparable with overseas studies, three data filters were applied to exclude unwanted observations. The working-age population was restricted to workers aged between 18 and 64, as high-school and retiring workers have different work patterns than workers aged 18 to 64. All jobs that were paid less than $100 per month were dropped. We presume these low-paid jobs are temporary or one-off jobs and they are excluded as they are not the focus of the paper. If these jobs were included in the dataset, the noise in the job-to-job flow measures would increase. The third filter concerns workers with multiple jobs. In any month, approximately 8% of workers were recorded as having more than one job that earns more than $100 per month. Workers with two jobs were counted twice in our statistics. For example, someone who had jobs A and B at year t and job A at year t+1 would contribute one count to the number of workers continuing in the same job and one count to the number of workers exiting their job. Fewer than 1% of workers had three or more jobs and their jobs were ranked by income and the two highest paid jobs selected as their main jobs. After applying these filters, 30 719 500 person-jobs remained in the final population pool. While the job-to-job transition statistics are based on March employment data, a further adjustment is necessary to derive a useful series for the March month earnings. The LEED records an individual’s taxable earnings received in each calendar month. Because calendar months have uneven numbers of days and pay periods (often weekly or fortnightly), earning levels are affected by the timing of pay and the number of pay period in a month. To address this, where possible we calculate an estimate of March earnings based on the average earnings in adjacent months. In the simplest case, March-month earnings are the average earnings in February, March and April. However, some workers may start or 2 All New Zealand employers must submit the monthly schedule to the Inland Revenue Department. Self-employed workers and working proprietors are excluded from the data.
2 | Defining job-to-job transitions 5 end their jobs in March and so their average earnings are calculated using previous or future earnings information where possible. For instance, if a worker starts his or her new job in March, their March- month earnings are equal to their average earnings in April, May and June. In this case the March- month earnings are excluded, as Fabling and Maré (2015) found earnings in start and end months are often not consistent with earnings in other months. For short-spelled jobs earnings are not averaged as past/future earnings cannot be observed. To identify job locations, jobs were linked to plants. A plant is a business unit that engages in an economic activity in one location. Each plant’s location is mapped into the area units in the 2013 Census. The economic activities at the plant level are recorded by the 2006 New Zealand Standard Industry Output Category (NZSIOC). In this study, we have 65 NZSIOC industries, which are a mix of two- and three-digit industry categories covering private and public industries. In some cases, plants may be recorded as having changed their economic activities and/or locations. Approximately 37% of employing plants were recorded to have changed either their industry code or location at least once between 2000 and 2018. Most of these changes were associated with a switch to a similar economic activity or a relocation to a neighbouring area within the same urban area. Of the plants that changed their two or three-digit industry code, 92% remained in the same one-digit industry code. Similarly, 88% of plants that relocated remained in the same urban area. There are some difficulties in dealing with plants that have changed their industry codes or locations. For example, if a plant changes its industry code from “cake and pastry manufacturing” to “biscuit manufacturing,” a standard algorithm would indicate that the employees of the plant had changed jobs to another plant in a different industry and the same location. Since we do not want to record this as a job change, each plant is given a predominant industry code indicating the predominant industry and location for the whole period. This is the activity-location pair that had the highest accumulated number of employees over the period or, if plants had multiple locations with exactly same number of employees, the earliest recorded location. The industry code associated with the predominant plant location is set as the predominant industry for that plant. The IDI database also includes supplementary data on ethnicity, age and gender. These data were included in our dataset to control for the effects of these person characteristics on earnings and job-to- job transitions. 2.2 Job-to-job transitions This paper adapts the approach used by Golan, Lane and McEntarfer (2007) to estimate national and regional job-to-job transition flows. We make two changes to their procedure. First, they looked at job-to-job transitions in which workers either switched firms within the same industry or switched firms and industries. We subdivide each category to measure whether workers stay in the same city or switch city, creating four rather than two alternatives. Second, they used the “Generalised Cross Entropy” statistical technique to estimate transition matrices in a manner that takes into account mistakes and outliers in the reported data. We have not, reporting estimates of the transition matrices calculated directly from the raw data. To explain the approach taken in the current paper in more detail, we estimate the following quantities: = the number of workers in city j at time t; = the number of workers in industry i and city j at t who are in the same job at t+1 (stayers); = the number of workers in industry i and city j at t who are not in the workforce at t+1 (exiters); = the number of workers who move firms and who were in industry i and city j at time t and industry k and city l and time t+1 (movers); and
6 Job-to-job transitions and the regional job ladder = the number of workers in industry i and city j at t+1 who were not in the workforce at t (entrants). The people who move firms are classified into four categories: Workers who change firms but stay in the same city and same industry; Workers who move to a job in a different industry but stay in the same city; Workers who change industries but stay in the same city; and Workers who change industries and cities. Workers who changed jobs may or may not have change occupations for have different job tasks. For example, an accountant could move from a manufacturing firm to a primary school and do similar work; but a barista promoted to a hotel manager at a new job may be doing quite different tasks. Such information is not recorded and we do not disentangle between changes in jobs and changes in occupations. The fraction of workers in each of the seven categories (stayers, stayers, entrants and four types of movers) is calculated by dividing the number of workers in each category by the number of workers in the city at time t. As percentage, the job-to-job transition rate is thus calculated as ( ⁄ × 100)%. Note that the four categories of movers plus stayers and exits add up to 100%. Our approach to calculate job-to-job transitions is illustrated in Table 1. In year t the population can be segmented into people in employment and people not in employment (unemployed people and people outside the labour market (non-participants)). In Table 1 it is assumed there are 100 (Tt j) workers in employment in March of year t. We then measure the status of people in March in year t+1 and in the example below 61 (Stij) workers remained with the same firm over this year, 21(M kltij) changed firms, and 18 workers exited the labour market. A number of people who were not in employment in March of year t took up jobs over this year (in the table this is 20 ( ) workers). We measure these entrants to give us the people in employment in March of year t+1, which is the sum of the entrants and the number of people in continuing employment. We then repeat this exercise for later years. Table 1 Illustration of job-to-job calculations Status at t+1 Continuing employed Exits (to unemployment Entrants and non-participation) Stayers Job-to-job Employed transitions (100) (movers) Status at t 61 21 18 Unemployed 20 and non- participants As stated above, we calculate the job-to-job transition rate as the number of job transitions between t and t+1 divided by the number of people employed at t. Note that we use employment at time t as the denominator rather than employment at t+1. Note also that we calculate the transition rate as a share of total employment not simply the share of continuing employment (which excludes exits from the denominator). When employment at time t is used as the denominator, the continuation, exit and job- to-job transition rates indicate the fraction of workers in a city who maintain or change their work status. These measures are not directly affected by the growth rate of the city. In contrast, if the denominator were employment at time t+1, the measures would indicate the fraction of people in jobs who had their jobs in the previous year or who were new to their jobs, these fractions will depend on whether the city is growing slowly or rapidly. To illustrate, consider a fast-growing and slow-growing city with the same
2 | Defining job-to-job transitions 7

number of employees at time t. If employment at t+1 were used as the denominator, the fast-growing
city would be recorded as having a smaller fraction of workers continuing in the same job than the slow-
growing city even if the fractions of people who were employed at time t who stayed in the same job
were the same. This is simply because the total number of jobs is increasing in a fast growing city. As
there is considerable diversity in city growth rates in New Zealand, with many slow growing cities and a
few fast growing cities, using employment at time t as the denominator allows a better cross-city
comparison of the extent that workers in different cities have different job-to-job transition rates.
8 Job-to-job transitions and the regional job ladder

 3 Descriptive statistics on job-to-job
 transitions
 3.1 National average
 Table 2 presents the average transition matrices for all workers in New Zealand plus separate results for
 males and females disaggregated into three age groups. While there is a distinctive age pattern,
 discussed below, there are only small differences between male and female transition rates. Women
 are slightly less likely to stay in a job than men (particularly for younger women) and they have slightly
 higher entry and exit rates, but the differences are small.

 Table 2 Job-to-job transition rates by demographic group (2000-2018)

 Age Stayers Same industry Different industry Exit Entry Number
 (%) (%) (%) (%) (%) of jobs

 Same Different Total Same Different Total
 location location location location

 Female

 18–24 40.3 5.7 4.5 10.2 11.3 8.9 20.2 29.3 41.9 2 406 400

 25–54 63.3 5.1 4.2 9.3 6.0 4.6 10.6 16.9 18.4 10 693 100

 55–64 69.1 3.9 3.6 7.5 2.9 2.5 5.4 17.9 9.9 2 145 700

 Male

 18–24 45.5 5.1 4.1 9.2 10.7 9.3 20.0 25.3 39.0 2 723 000

 25–54 65.4 4.2 4.1 8.3 6.3 5.8 12.1 14.3 15.2 10 747 000

 55–64 68.8 2.8 3.4 6.2 3.6 3.7 7.3 17.6 9.7 2 004 300

 New Zealand

 All 61.4 4.6 4.1 8.7 6.5 5.6 12.1 17.8 19.8 30 719 500

 Source: Authors’ calculations using Linked Employer-Employee Database
 Notes:
 1. The numbers of jobs in the last column are rounded randomly for confidentiality. There is thus likely to be some small variation in
 the total number of person jobs in New Zealand in different tables

 On average 61.4% of workers in employment remained in the same job over a year, 20.8% (12.1% +
 8.7%) of workers moved jobs, and 17.8% of workers exited the labour force. Job-to-job transitions thus
 accounted for a larger share of labour market flows than shifts from employment into unemployment or
 non-participation, although for workers aged 55+ the proportion of exits was higher than that of job
 transfers. Overall these rates of job-to-job transitions were comparable to those found in the United
 States (Golan, Lane and McEntarfer, 2007).

 Of the 20.8% switching to a different firm, 8.7 percentage points switched to a firm in the same industry
 and 12.1 percentage points switched industries. For each of these groups, roughly 47% of job changes
 involve moving to a new location. Such regional shift rates vary by city and are quite different in
 Auckland than elsewhere.

 Young workers (workers aged 18–24) were more mobile than older workers. The fraction of young
 workers staying with the same firm was about 20 percentage points lower than the fraction of workers
 aged 25–54. This largely reflected higher exit rates and more frequent shifts in the industry they work in.
4 | Job-to-job transitions and wage premiums 9

In contrast, 70% of workers aged 55–64 were in the same job after a year, and while they have broadly
similar exit rates to workers aged 25–54, they were less likely to move to firms in other industries.

3.2 Regional patterns
Table 3 shows the transition matrices for nine regional groups: Auckland; Wellington; Christchurch;
medium-sized cities (split into those that grew quickly and those that grew slowly);3 small cities and
towns (also split into those that grew quickly and those that grew slowly);4 minor urban areas with
populations between 1 000 and 9 999; and rural areas. Transition matrices are calculated for all
industries and (in Table 4) for a subset of non-tradeable industries that are present in similar ratios in all
cities.

Table 3 Job-to-job transition rates by city groups (2000-2018, all industries)

 Origin Stayers Same industry Different industry Exit Entry Number
 region (%) (%) (%) (%) (%) of jobs

 Same Different Total Same Different Total
 location location location location
 Auckland 62.1 6.3 2.1 8.4 9.2 2.9 12.1 17.4 19.8 10 068 500

 Wellington 62.9 4.9 4.0 9.0 6.7 4.8 11.6 16.5 17.6 3 342 900

 Christchurch 62.8 4.5 4.0 8.6 6.9 5.3 12.2 16.4 18.2 3 059 600

 Medium cities (fast) 61.4 3.5 5.3 8.8 5.5 6.8 12.3 17.5 19.8 4 284 200

 Medium cities (slow) 63.1 3.2 5.1 8.4 5.3 6.4 11.7 16.9 18.5 3 128 900

 Small cities (fast) 55.5 2.8 6.8 9.5 3.7 8.6 12.2 22.7 25.8 1 748 400

 Small cities (slow) 57.4 1.9 6.3 8.2 3.1 10.3 13.4 21.0 22.5 380 700

 Minor urban 61.6 2.4 6.6 9.0 3.2 8.0 11.1 18.3 20.0 1 994 600

 Rural areas 55.9 4.9 4.7 9.6 4.4 8.8 13.2 21.4 23.6 2 711 300

 New Zealand 61.4 4.6 4.1 8.7 6.5 5.6 12.1 17.8 19.8 30 719 100

Source: Authors’ calculations using Linked Employer-Employee Database
Notes:
1. The numbers of jobs in the last column are rounded randomly for confidentiality. There is thus likely to be some small variation in
 the total number of person jobs in New Zealand in different tables

The transition matrices for large cities, medium cities, and minor urban areas have similar continuation,
exit, and entry rates. Between 61% and 63% of workers are in the same job after a year, between 16%
and 18% leave the workforce, and between 18% and 20% of jobs are filled by entrants.

Small cities and rural areas have exit and entry rates that are about 5 percentage points higher and,
correspondingly, continuation rates about 5 percentage points lower. The low continuation rates in
small cities and rural areas may reflect the disproportionately large fraction of workers in agricultural
industries for, as we show below, these have high entry and exit rates. The differences between large,
medium and small cities are less marked for non-tradeable industries than for all industries.

3
 The split was made according to the average growth rate between 1976 and 2013. The fast-growing medium-size cities are Blenheim, Hamilton, Kapiti,
Nelson and Tauranga. The slow-growing medium-size cities are Dunedin, Gisborne, Invercargill, Napier-Hastings, New Plymouth, Palmerston North,
Rotorua, Timaru, Wanganui, and Whangarei.
4
 The split was made according to the average growth rate between 1976 and 2013. The fast-growing small-size cities are, Queenstown, Rangiora and Taupo.
The slow-growing medium-size cities are Ashburton, Fielding, Greymouth Hawera, Levin, Masterton, Oamaru, Tokoroa, and Whakatane.
10 Job-to-job transitions and the regional job ladder Table 4 Job-to-job transition rates by city groups (2000-2018, non-tradable industries) Origin Stayers Same industry Different industry Exit Entry Number region (%) (%) (%) (%) (%) of jobs Same Different Total Same Different Total region region region region Auckland 62.6 7.0 2.1 9.0 8.5 2.8 11.3 17.0 19.6 4 211 600 Wellington 64.5 4.8 3.7 8.5 6.2 4.4 10.7 16.3 17.4 1 445 700 Christchurch 63.5 5.1 4.1 9.1 6.2 4.7 10.9 16.5 18.6 1 114 200 Medium cities (fast) 64.2 4.1 5.2 9.3 4.9 5.8 10.7 15.8 17.8 1 174 800 Medium cities (slow) 66.3 3.5 4.8 8.3 4.6 5.6 10.2 15.2 16.6 1 556 600 Small cities (fast) 61.2 1.8 7.4 9.2 3.3 7.8 11.2 18.4 20.5 144 300 Small cities (slow) 66.2 2.5 6.6 9.1 3.4 6.4 9.8 14.9 16.0 546 100 Minor urban 65.7 2.5 6.6 9.1 2.9 6.3 9.3 15.9 17.3 819 500 Rural areas 60.9 2.3 9.2 11.6 3.0 6.6 9.6 17.9 20.0 425, 500 New Zealand 63.9 5.0 4.1 9.0 6.2 4.5 10.7 16.4 18.3 11 438 300 Source: Authors’ calculations using Linked Employer-Employee Database Notes: 1. The numbers of jobs in the last column are rounded randomly for confidentiality. There is thus likely to be some small variation in the total number of person jobs in New Zealand in different tables 2. Coleman and Zheng (2019) rank industries by standard deviations of the location quotients across urban areas and allocate industries below the medium to the non-tradable category. Non-tradable industries are often unevenly distributed across locations, such as restaurants, schools and hospitals The transition rates for the number of workers moving firms within the same industry and the number of workers moving to firms in different industries are very similar across city sizes. Each year about 9% of workers move to a job in another firm in the same industry, and 11% move to a firm in a different industry. There is a large difference, however, in the fraction of workers moving cities, which decreases with the size of cities: In Auckland, 75% of the 9% of workers who moved to different firms in the same industry stayed in Auckland and 25% moved to other cities; In slowly growing small cities, less than 40% of the 9.1% of workers who moved to different firms in the same industry stayed in the same city; Similarly, 75% of the 11.3% of workers who switched industries in Auckland stayed in Auckland and 25% moved to other cities, whereas in slowly growing small cities 65% of the workers who switched industries also moved cities; and Medium cities had a similar pattern to small cities, with a majority of workers changing jobs also changing cities. Figures 1 and 2 show the relationship between urban size and the moving rates in more detail.
4 | Job-to-job transitions and wage premiums 11

Figure 1 Job-to-job transition rates on workers who remain in the same industry (2000-2018)

Source: Authors’ calculations using Linked Employer-Employee Database
Notes:
1. Cities are ordered from the smallest (left) to largest (right) population in Census 2013

Figure 2 Job-to-job transition rates on workers who change industries (2000-2018)

Source: Authors’ calculations using Linked Employer-Employee Database
Notes:
1. Cities are ordered from the smallest (left) to largest (right) population in Census 2013

The figures show that the overall rates of moving are similar across cities but that smaller cities have a
much larger fraction of workers moving cities when they change jobs. It is perhaps not surprising that
workers living in small cities who want to stay in the same industry change locations when they move
12 Job-to-job transitions and the regional job ladder firms, because there are fewer alternative firms in any industry in small cities. However, workers in small cities are also more likely to change cities when they get a new job in a different industry than workers in large cities. The difference in the fraction of workers moving cities when they move firms is the most noticeable way that job-to-job transition rates depend on city size. Table 3 and Table 4 can be used to compare the job-to-job transition rates of all industries with the subset that are non-tradeable. We have focused on non-tradeable industries because they are found in all locations in approximately equal fractions. To identify non-tradeable industries, we: first calculated the location quotient for each city-industry combination, which is the fraction of the city’s employees in an industry relative to the national fraction of employees in that industry; and then calculated the cross-city variance of the location quotients for each industry and chose the 17 out of 65 industries with the lowest variance. These industries, which include retailing, health, and education, account for about 40% of all employment.5 Since these non-tradeable industries are found everywhere in similar proportions it may be imagined that there is less of a need to move cities if a worker wants to switch firms without changing industries. However, this is not the case. Table 4 shows that the transition rates for non-tradeable industries are similar to those of the whole economy. There is little difference between the fractions of workers changing firms but remaining in the same industry for non-tradeable industries and the total economy. In each case there is the same tendency for workers in small towns and cities to move to another city when they shift firms, irrespective of whether they stay in the same industry or move to a different industry. The results also indicate that workers in non-tradeable industries are slightly more likely to remain in the same firm than other workers and less likely to switch industries. In Section 3.3 this is traced to the high continuation rates in the government, health, and education industries. Where do workers move to if they find jobs in a different city? Two general patterns of inter-region movements are observed in our data. The first pattern is a disproportionately large inflow of workers to Auckland, Wellington and Christchurch from elsewhere. 53% of workers relocate to one of these three major cities. This could reflect the role of agglomeration effects in shaping job opportunities, skill matching and improved social and environmental benefits for workers. The second pattern is that most of inter-regional movements are over short distances. For example, the top three destinations of Ashburton workers are Christchurch (42.3%), Timaru (12.3%) and Dunedin (10.7%). Distance in this context is usually taken as a proxy for complex migration costs, such as commuting time and cultural differences. Such short-distance moves are common in many international studies (Australian Productivity Commission (2014); Arpaia et al., (2016)), indicating that the majority of workers will move to adjacent regions which provide easier to access jobs. 3.3 Industry patterns Table 5 presents job-to-job transition rates for different industries arranged into 16 one-digit industries.6 The transition rates are similar across most industries. In most industries, 56–68% of workers stay with the same firm from year to year, 5–10% of workers move firms and stay in the same industry, and 10–16% of workers switch industries each year. 5 See Coleman, Maré and Zheng (2019) for a list of these industries. 6 The results are calculated at the 65 industry level and then arranged into the one-digit industry level.
4 | Job-to-job transitions and wage premiums 13

Table 5 Job-to-job transition rates by industry (2000-2018)

Industry Stayers Same industry Different industry Exit Entry Number
 (%) (%) (%) (%) (%) of jobs

 Same Different Total Same Different Total
 location location location location

Agriculture 46.6 6.9 2.7 9.5 6.4 9.0 15.4 28.5 31.6 1 599 900

Mining 65.8 2.4 3.9 6.2 4.3 10.2 14.5 13.5 12.5 88 200

Manufacturing 68.3 2.1 3.4 5.6 6.7 6.1 12.8 13.3 13.1 3 849 900

Utility 66.8 2.1 4.1 6.2 6.9 7.4 14.3 12.7 12.9 196 500

Construction 63.5 3.6 4.0 7.6 6.1 6.1 12.3 16.6 18.8 1 873 400

Wholesale trade 66.9 2.1 3.1 5.2 7.8 6.6 14.3 13.6 13.8 1 651 500

Retail trade and 52.5 5.6 3.9 9.5 8.7 6.3 15.0 23.0 28.7 4 846 700
accommodation

Transport and 64.6 3.7 5.1 8.7 6.2 5.9 12.1 14.6 14.4 1 330 600
warehousing

Telecommunication 63.7 4.2 4.0 8.2 8.2 4.6 12.8 15.2 14.8 612 600

Bank and finance 66.0 5.7 6.2 11.8 5.6 3.9 9.5 12.7 11.6 865 000

Rental and real 56.8 3.1 2.6 5.7 9.5 7.0 16.5 20.9 23.1 419 200
estate services

Professional, science, 56.2 3.7 3.2 6.9 9.3 6.6 15.9 21.0 24.6 3 938 800
computing

Central and local 68.9 5.2 6.3 11.5 4.9 4.0 8.9 10.7 10.9 1 632 600
government

Education 66.7 7.3 5.7 13.0 3.1 2.5 5.6 14.7 15.7 2 913 800

Health 68.0 6.5 5.2 11.7 2.9 2.2 5.1 15.2 16.2 3 165 800

Recreational and 62.8 3.4 2.2 5.6 7.6 4.9 12.5 19.2 21.3 1 544 100
other services

New Zealand 61.4 4.6 4.1 8.7 6.5 5.6 12.1 17.8 19.8 30 528 600

Source: Authors’ calculations using Linked Employer-Employee Database
Notes:
1. The number of jobs in the last column are rounded randomly for confidentiality. These is thus likely to be some small variation in the
 total number of person jobs in NZ in different tables

The first exception is workers working in the Government, education, and health industries, which
account for approximately 22% of total employment. Workers in these industries are 5.3 to 7.5
percentage points more likely than average to stay with the same firm. Workers in the health and
education industries have relatively low rates of job-switches and when they do switch firms they are
relatively likely to remain in the same industry (with job shifts out of their industries being 6.5 to 7
percentage points below the New Zealand average). Industry changes are also relatively low for workers
in central and local government.

The second exception is industries with much higher transition rates than average, notably the
agricultural industries, the retail and accommodation industries, and to a lesser extent the real estate
and rental industries. These industries have much lower than average continuation rates, and higher
than average exit rates and transition rates to other industries. These industries are characterised by
lower than average pay rates, higher than average part-time employment, and they often hire foreign
workers on a temporary basis.
14 Job-to-job transitions and the regional job ladder

 3.4 Time patterns
 U.S. evidence indicates that job-to-job transition rates and the rates of wage growth for moving and
 incumbent workers decline during recessions (Hyatt and McEntarfer 2012; Bjelland et al 2011;
 Haltiwanger et al 2018). In New Zealand, Fabling & Maré (2012) showed the rate of job destruction
 increased and the job creation rate decreased after the onset of the Global Financial Crisis. To examine
 the size of this effect we calculated job-to-job transition rates on an annual basis, and then split the
 period into three subperiods: 2001-2008; 2008-2012, when unemployment increased sharply; and
 2012-2018 when the economy steadily recovered and unemployment reduced to its earlier levels.

 Table 6 Job-to-job transition rates by year (2000-2018)

 Year Stay Same industry Different industry Exit Entry Number
 (%) (%) (%) (%) (%) of jobs
 Same Different Total Same Different Total
 location location location location

 2000-2001 59.20 4.70 3.40 8.10 7.70 5.70 13.50 19.20 21.20 1 426 000

 2001-2002 59.40 4.80 3.80 8.60 7.50 6.10 13.50 18.50 21.40 1 454 200

 2002-2003 61.50 4.40 3.40 7.90 7.00 5.60 12.60 18.00 21.40 1 496 700

 2003-2004 60.90 4.60 3.80 8.40 7.20 5.70 13.00 17.70 21.80 1 547 600

 2004-2005 60.70 4.50 3.60 8.10 7.50 5.80 13.20 18.00 21.40 1 611 900

 2005-2006 59.50 4.80 3.90 8.70 7.30 5.90 13.20 18.60 20.60 1 668 100

 2006-2007 59.40 4.70 3.90 8.60 7.20 5.80 13.00 19.00 20.30 1 701 100

 2007-2008 59.40 4.60 4.00 8.60 7.30 6.00 13.30 18.80 20.60 1 724 900

 2008-2009 60.90 4.20 3.50 7.80 6.40 5.40 11.80 19.50 18.30 1 755 600

 2009-2010 60.80 5.70 5.30 11.0 5.50 4.80 10.30 17.90 17.80 1 734 200

 2010-2011 61.90 4.80 4.70 9.40 5.90 5.10 11.00 17.70 18.80 1 732 200

 2011-2012 62.10 4.50 4.20 8.70 5.80 5.20 11.00 18.30 17.80 1 750 200

 2012-2013 63.90 4.30 4.00 8.30 5.60 5.10 10.70 17.00 18.80 1 740 000

 2013-2014 64.00 4.20 3.90 8.10 6.00 5.30 11.30 16.60 19.00 1 771 300

 2014-2015 63.90 4.50 4.00 8.60 6.00 5.30 11.30 16.30 19.60 1 813 200

 2015-2016 63.30 4.50 4.30 8.80 6.00 5.40 11.40 16.50 19.60 1 871 800

 2016-2017 62.20 4.40 4.70 9.10 6.20 5.90 12.10 16.60 19.80 1 928 300

 2017-2018 61.20 4.30 4.60 8.90 6.30 6.20 12.50 17.50 19.30 1 991 600

 2000-2008 60.00 4.60 3.70 8.40 7.30 5.80 13.20 18.50 21.10 12 630 500

 2008-2012 61.40 4.80 4.40 9.20 5.90 5.10 11.00 18.30 18.20 6 972 200

 2012-2018 63.10 4.40 4.20 8.60 6.00 5.50 11.60 16.70 19.30 11 116 200

 New Zealand 61.40 4.60 4.10 8.70 6.50 5.60 12.10 17.80 19.80 30 528 600

 Source: Authors’ calculations using Linked Employer-Employee Database
 Notes:
 1. The numbers of jobs in the last column are rounded randomly for confidentiality. There is thus likely to be some small variation in
 the total number of person jobs in New Zealand in different tables.
 The results reported in Table 6 show that job-to-job transition rates changed modestly. The fraction of
 workers staying their jobs increased from 60% between 2000 and 2008, to 61% from 2008 and 2012, and
4 | Job-to-job transitions and wage premiums 15 then to 63% between 2012 and 2018. There were corresponding reductions in the entry and exit rates. The job-to-job transition rate (left panel in Figure 3) fell from the peak at 22.1% in 2001 to 19.1% in 2013 and recovered to 21.4% in 2017. The declining job-to-job transition between 2000 and 2013 was heavily driven by the downward trend in job-to-job transition within the same locations (right panel in Figure 3). In the last four year, increasing job transitions across locations helped boost the overall job-to-job transitions. These findings show an interesting trend that New Zealand workers have changed their preferences on job changes from job changes within the same area to job changes across space. Figure 3 Job-to-job transition rates, 2000-2018 Job-to-job transition rates Job-to-job transition rates in the same locations and different locations Source: Authors’ calculations using Linked Employer-Employee Database Notes: 1. Job-to-job transition rate in same locations is the sum of job transitions in the same location and same industry and the same location and different industry. 2. Job-to-job transition rate in different locations is the sum of job transition in different location and same industry and different location and different industry. The post-2008 decline in job-to-job transition rates reported here is lower than that reported by Karagedikli (2018). One reason for the difference is that the transition rates in this paper are calculated on an annual basis and so workers who make multiple transitions within a year are counted only once in our study. Further, Karagedikli (2018) expressed the job-to-job transition rate as job switches as a proportion of continuing employees (thus excluding exits), while the rates in this paper are expressed as a share of total employment at the beginning of the March-year. Nonetheless, both papers indicate that the global financial crisis had an effect on labour market dynamics that persisted for several years. 3.5 Employment transition status Table 7 shows the job transitions that workers make between two successive time periods (times t and t+1) by their workforce status. Their “previous workforce status” depends on what they were doing at time t relative to what they were doing at time t-1: were they in the same job in both periods (stayers); if not, had they changed industry or location between t-1 and t (the four categories of movers); or were they new entrants to the workforce at time t (entrants)? Their “current workforce status” depends on what they were doing at time t+1 relative to what they were doing at time t. In this case workers can be identified as either stayers, movers, or exiters (people who had exited the workforce). The first row of Table 7 shows the job-to-job transition rates from year t to year t+1 for workers who had the same job in year t-1 as they did in year t, ie, for workers who were in the same job for at least a year. The continuation rate for this group is 73%, relative to 62% for all workers; it is almost identical to that in the US (Golan, Lane and McEntarfer 2007). Workers in this group were 6 percentage points less likely to
16 Job-to-job transitions and the regional job ladder exit (12% versus 18%) and 5 percentage points less likely to switch to a different job (16% versus 21%) than average. The workers who were not employed in the same job in year t-1 and year t can be split according to whether they were previously not in the workforce or previously in the same or a different industry, and the same or different location. In each case the continuation rates were lower than for the more stable workers; but the most interesting aspect of the table is the heightened tendency for workers who make one type of switch one year to make a similar switch in the following year. From Table 7, it is apparent that: 37% of entrants to the workforce at time t leave by t+1 (national average 18%); 15% of workers who moved jobs but stayed in the same industry and the same city between t-1 and t made a similar move between t and t+1 (national average 5%); 17% of workers who switched jobs and stayed in the same industry but moved city between t-1 and t made a similar move between t and t+1 (national average 4%); 17% of workers who moved jobs and switched industry but stayed in the same city between t-1 and t made a similar move between t and t+1 (national average 6%); and 19% of workers who moved jobs and switched industry and moved city between t-1 and t made a similar move between t and t+1 (national average 6%). Table 7 Job-to-job transition rates by previous employment status (2000-2018) Current Stayers Movers Mover Mover Mover Exiters Number employment (%) (same (same (different (different (%) of jobs status → industry, industry, industry, industry, Previous same different same different employment location) location) location) location) status ↓ (%) (%) (%) (%) Stayers 72.50 3.90 3.40 4.80 3.70 11.70 17 652 300 Mover (same 53.90 15.10 4.50 7.30 3.40 15.80 1 323 200 industry, same location) Mover (same 52.40 4.90 17.00 3.30 7.80 14.60 1 163 300 industry, different location) Mover (different 51.90 5.20 2.30 17.30 6.20 17.10 1 882 000 industry, same location) Mover (different 45.90 2.80 6.10 7.20 19.40 18.60 1 583 200 industry, different location) Entrants 38.60 4.50 3.60 8.30 7.40 37.40 5 694 900 New Zealand 61.50 4.60 4.10 6.50 5.60 17.70 29 298 900 Source: Authors’ calculations using Linked Employer-Employee Database These results suggest that there is a large number of workers who have stable work histories and who change jobs much less frequently than average, and another smaller group of workers who are often changing jobs or move in and out of the workforce.
4 | Job-to-job transitions and wage premiums 17 4 Job-to-job transitions and wage premiums The international literature indicates that a majority of workers changing jobs obtain higher wages (Bjelland et al 2011; Hyatt and McEntarfer 2012; Haltiwanger et al 2018). While a large number of job-to- job transitions involve wage reductions, the average wage increase associated with a job change in the United States in non-recessionary times is between 5% and 10% (Bjelland et al 2011; Hyatt and McEntarfer 2012). This rate is considerably higher than that estimated for New Zealand by Hyslop & Maré, (2009). They estimated that the average wage increase associated with a job-to-job transfer was less than 2% and they further estimated that most workers who changed jobs had smaller wage increases than the workers who did not change. In this section we examine the wage increases associated with job-to-job transitions. Our focus is on the extent that workers who changed cities and industries obtained different wage increases than workers who changed jobs but stayed in the same city or industry. 4.1 Methodology To estimate the wage premiums associated with job changes, we have selected from all of the job-to- job transitions in the database and regressed the percentage change in wages against a set of explanatory variables that include age and gender, whether the origin and destination jobs are part- time or full-time, whether the person has changed industry or city, the size of the employing firm in both years, the year, and the origin and destination cities and the origin and destination one-digit industries. This is shown in equation (1): Witd+1 ln( o ) = a0 + m am I itm + k k I ikt + n n DFTEitn + 1I ikto + 2 I iktd +1 + c co I icto + Wit (1) c d d I c ict +1 + s I + s I o o s ist d d s ist +1 +f I +f I o o f ift d d f ift +1 + X it + I t + it The variables are: and +1 are the real wages in the origin and destination jobs for person i. is a set of indicator variables indicating one of the four job-to-job transition categories. Workers who change firms but stay in the same city and same industry serves as the reference category. is a set of indicator variables on employment switching between full-time and part-time jobs. There are four categories: full-time to full-time, full-time to part-time, part-time to part-time and part-time to full-time. “Full-time to full-time” serves as the reference category. is a set of indicators of changes of hours of work (FTE or part-time) between jobs. To capture the non-linear relationship between wage growth and hours of work, linear, quadratic and cubic terms of DFTE are included. and are indicator variables for short-spelled jobs in origin and destination locations. and are a set of indicator variables for the origin and destination locations of person i. All cities and towns are grouped into nine broad geographic locations, including Auckland, Wellington, Christchurch, fast-growing medium cities, slow-growing medium cities, fast-growing small cities, slow-growing small cities, minor urban areas, and rural areas. Christchurch at both original and destination locations serves as the reference category because its industry structure is the most similar to New Zealand as a whole.
You can also read