JOHN DORSEY - JULY 29, 2021 AARON MCKINNEY - Over the Cap
←
→
Page content transcription
If your browser does not render page correctly, please read the page content below
JOHN DORSEY
   Hey, Buddy Boy

   JULY 29, 2021
  AARON MCKINNEY
Page 1 of 81

                                                            Table of Contents
Abstract ................................................................................................................................................................ 2
Overview .............................................................................................................................................................. 3
Draft ...................................................................................................................................................................... 5
Free Agency ........................................................................................................................................................ 20

Extensions........................................................................................................................................................... 45
Trade ................................................................................................................................................................... 55
Summary............................................................................................................................................................. 76
Page 2 of 81
ABSTRACT
Being an NFL player means having one of the most scrutinized jobs in the United States. The fans watching
the game watch the players do their jobs and talk about how well each one is doing. Members of the media
show their highlights and talk about what they did right or wrong. Sports experts watch their tapes, rate their
performance, and give them grades based on their play. Everyone wants to rate how well they are
performing their job and comment on if they deserve to have their job.
One high profile position in the NFL that has never been graded is the General Manager (GM) position. NFL
GMs play critical roles in building the NFL rosters of every team, but they are never rated on how well they
perform at their job. They hold similar or greater power than the team’s Head Coach, but the coaches are
constantly graded on factors such as wins/losses, playoff appearances, Super Bowl wins, etc. The purpose of
this paper is to examine the GM position, but more specifically, the performance of ex-GM John Dorsey. In
this paper we will examine how well John Dorsey has performed in the different major roles of a GM and
then rate his performance. Doing this will create a template that other GMs can be evaluated by.
TYPICAL NFL POWER STRUCTURE
Owner
GM
Head
Scouting
Coach
Coaching
StaffPage 3 of 81
SECTION 1: OVERVIEW
GM Responsibilities
The job responsibilities of an NFL GM differ in every organization but can include coaching and staff hiring,
scouting, contract negotiations, and player personnel decisions. GMs may also play a role in the business side
of the franchise, but for this paper we are only focused on how their performance affects the performance of
the team. The four main areas that the GM is responsible for and should be graded on is coaching staff hiring,
the draft, signing players, trading. Since John Dorsey was never responsible for the coaching staff selection,
that will not be included in his grade.
John Dorsey History
John Dorsey has a long and impressive history in the NFL. He started his NFL journey as a 4 th round draft pick
of the Green Bay Packers. After his playing career was over, he became a scout for the Packers and held
various positions in the Packers and Seahawks organizations from 1997-2012.
In 2012 the Chiefs were coming off 2-14 season and had just fired most of their front office and coaching
staff. On January 13, 2013, Clark Hunt, the CEO of the Chiefs, reached a five-year agreement with John
Dorsey to be the GM of the Chiefs.1 He was the GM of the Chiefs from January 13, 2013 until June 22, 2017,
when the Chiefs decided to release Dorsey from his contract rather than give him an extension. 2
Soon after leaving the Chiefs, Dorsey found another job. On December 7, 2017, Jimmy Haslam, the owner of
the Browns, reached a four-year agreement with Dorsey, making him the new GM of the Browns. 3 Dorsey did
not last long with the Browns, though. Haslam fired him after his second season with them on December 31,
2019.4
Dorsey is not currently a GM; he is a senior personnel executive for the Detroit Lions.5
1
https://www.espn.com/nfl/playoffs/2012/story/_/id/8839153/john-dorsey-named-new-general-manager-kansas-city-chiefs
2
https://web.archive.org/web/20170710205426/http://www.chiefs.com/news/article-2/Chiefs-Dorsey-Agree-to-Part-
Ways/90a06198-9204-404f-95a0-dec1e2b7d856
3
https://www.cleveland.com/browns/2017/12/browns_hire_john_dorsey_as_gm.html
4
https://www.nfl.com/news/browns-part-ways-with-general-manager-john-dorsey-0ap3000001093675
5
https://www.detroitlions.com/news/lions-add-ray-agnew-and-john-dorsey-to-front-officePage 4 of 81
Grading
Dorsey will be graded in each of the three main areas (drafting, signing, trading) that he controlled and then
each transaction in those areas will be given a grade. After grading all his transactions, he will receive an
overall grade in each area and that grade will be combined from each area to give him an overall grade.
The grading scale that will be used throughout this article is based on the A, B, C, D, F grading scale.
Grading Scale
A Excellent
B Good
C Average
D Bad
F FailurePage 5 of 81
SECTION 2: DRAFT
Overview
The draft is the marquee event for an NFL GM and the foundation for roster construction. NFL teams spend
years scouting, investigating, and projecting what college players have done, and hopefully will do, for their
organization. Teams can add young, talented players that they can mold into the type of players they
envision on their team. These players are also cost controlled, giving teams that draft well a large advantage
with their salary cap. Every team declares that they want to build their team through the draft, but few
franchises can continually hit on their draft picks and build a team this way. In this section we will examine
Dorsey’s past draft performances and analyze his strengths and weaknesses when it comes to the draft.
To analyze Dorsey’s draft performance, only objective data will be used. There are several nonobjective
factors that go into a team’s draft strategy such as team needs, positional value, and personalities. These are
all important for roster construction, but this is solely focused on examining the performance of the players
that Dorsey picked. There are also long-term benefits from drafting players (franchise tag/etc), but those will
not be considered either. Only the draft picks’ performance on their rookie contracts will be analyzed.. It only
grades the player on their expected performance compared to outcome.
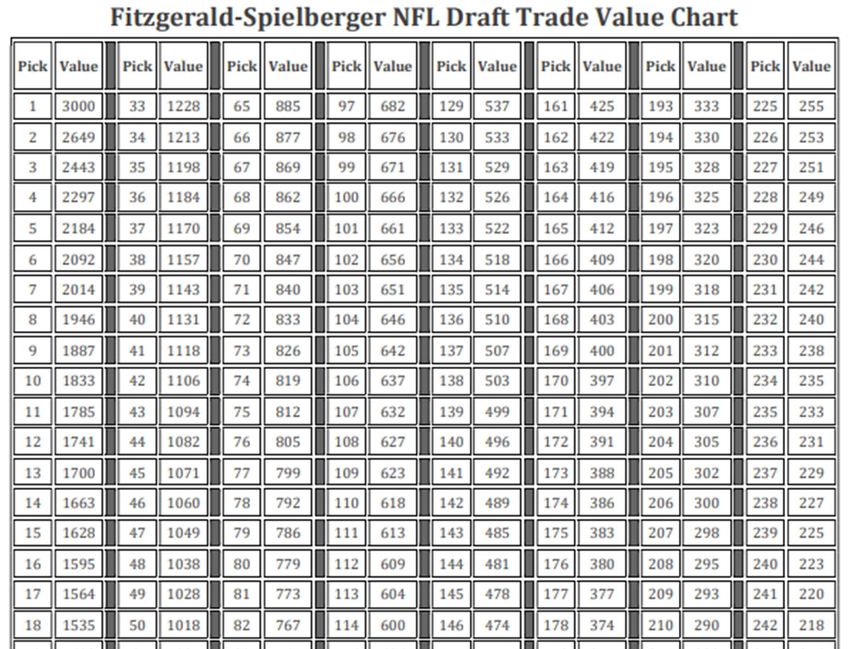
To make this as objective as possible, there are two rubrics. The first rubric assigns an expected value (points)
to each pick based on the pick number. The reason for this is self-explanatory, as the higher a player is
picked, the better they should be and the more they should contribute to the team.
Draft Slot Expected Points
Pick 1-5 7
Pick 6-15 6
Pick 16-32 5
Pick 33-64 4
Pick 65-105 3
Pick 106-184 2
Pick 185- 1
The second rubric grades the player based on their performance and the number of snaps that they played
on their rookie contract. Players are assigned a grade by first determining their average Pro Football Focus
(PFF) grade over their rookie contract and then finding the average number of snaps they had per year. After
those two numbers have been determined, the player is assigned a grade based on Fig. A Grading Scale. For
example, if a player had an average PFF score of 67 and averaged 625 snaps per year, the player would be
given a score of 4 points.Page 6 of 81
Fig. A Grading Scale (Snaps on Rookie Contract) Points
Superstar AVG PFF grade over 90 and 700 snaps per year 10
AVG PFF grade over 90 and 350 snaps per year 9
AVG PFF grade over 80 and 700 snaps per year 8
AVG PFF grade over 80 and 350 snaps per year 7
Starter AVG PFF grade over 70 and 700 snaps per year 6
AVG PFF grade over 70 and 350 snaps per year 5
AVG PFF grade over 60 and 350 snaps per year 4
Role AVG PFF grade over 60 and 200 snaps per year 3
Player AVG PFF grade over 50 and 100 snaps per year 2
AVG PFF grade over 50 and 50 snaps per year 1
Miss Did not meet any requirements 0
Since every player has an expected points placed on them based on the spot that they were selected the two
numbers can be compared to see if the player underperformed, overperformed their draft spot.
For example, the 4th pick has an expected value of 7 points but only generated 5 points. That means that
even though this player is a starter on the team, he underperformed his draft position. If the 69 th pick also
generated 5 points, then he would have overperformed his expectations because his expectations were set at
3 points. This means that instead of being just a role player on the team, he played at a starter level.
Notes: If a player is traded, only the time the player spent with the team will be used in evaluations. If a player
is cut, the remaining years of the rookie contract will still be used (lowers avg snaps). 1 st round picks include
5th year of contract.Page 7 of 81
Draft Grades by Round
Draft Results High Level
Projected Draft Value vs Results
35
30
25
20
15
10
5
0
2013 2014 2015 2016 2017 2018 2019
Projected 23 14 23 21 18 33 15
Results 14 15 25 23 13 29 8
Projected Results
This projected draft value vs results examines the difference in projected value that Dorsey should expect to
get from the draft and the results that he achieved. The reason that this chart is effective is because it lets us
compare how well Dorsey should have done with the draft picks versus how well he actually did with them.
As can be seen in the graph, Dorsey’s worst year was 2013. He produced nine fewer points than what was
expected with the draft capital that he had. To put this in context, this is one superstar level player (nine
points) or three role players (three points each). Dorsey’s best year was in 2015 when he produced two more
points than was expected. When combining all the years together, Dorsey’s draft picks were expected to
produce 147 points in value but only produced 127 points. This means that he underperformed on his draft
picks by a value of 20 points.Page 8 of 81
Grades Based on Round
Projected Value vs Results by Round
40
35
30
25
20
15
10
5
0
1st 2nd 3rd 4th 5th 6th 7th
Projected 37 24 28 21 20 14 3
Results 35 25 26 16 13 12 0
Projected Results
In the 1st, 2nd, 3rd, and 6th rounds of the draft, Dorsey has been consistent in averaging around the projected
value of his picks. He has had the best results in the 2nd round, overperforming the projected value of picks by
a total of one point. The rounds that Dorsey has struggled the most with are the 4 th and 5th rounds, with the
5th being his worst. In the 5th round he lost a total of seven points from the projected value.
Predictive Outcome
0.40
0.20
0.00
-0.20
-0.40
-0.60
-0.80
-1.00
-1.20
1st 2nd 3rd 4th 5th 6th 7th
Value -0.33 0.17 -0.22 -0.56 -0.70 -0.18 -1.00
Baseline 0 0 0 0 0 0 0
Value Baseline
The value of knowing this information is that future predictions can be made based on his history. The way
this predictive outcome graph works is that it charts the average projected outcome vs the results for each
round. For example, 3rd round picks are projected to generate three points of value. This graph shows us that
on average Dorsey’s draft picks underperform this by .22 points, meaning Dorsey’s 3 rd round picks should
have a projected value of 2.78 instead. In the 2nd round, Dorsey’s best round, he is outperforming thePage 9 of 81
projections by .17 points. His worst round is the 7th round, underperforming by one point. The 7th round only
has a projected value of one point, so that means every 7th-round pick of Dorsey’s has been a miss.
Value by Position
Offense
Positional Value Projected vs Results
20
15
10
5
0
QB RB FB WR TE T G C
Projected 17 12 1 15 6 8 9 6
Results 16 14 0 18 10 4 12 4
Projected Results
Overall, when drafting offensive players, Dorsey has had very good results. He has outperformed the
projected value when drafting RB, WR, TE, and G. He has been near the projected value when drafting QB,
but he has not drafted as well with T and C. The position that he has had the most success at is G and WR. He
has surpassed these projected values by three points each. The lowest scoring position is T, missing the
projected value by four points at this position. Dorsey’s offensive picks have had a total projected value of 74
points, and his picks have resulted in 78 points. This means he has outperformed the overall projected value
of offensive players by a total of four points.
Predictive Outcome
2.50
2.00
1.50
1.00
0.50
0.00
-0.50
-1.00
-1.50
-2.00
-2.50
QB RB FB WR TE T G C
Value -0.25 0.50 -1.00 0.43 2.00 -2.00 0.75 -1.00
Baseline 0 0 0 0 0 0 0 0
Value BaselinePage 10 of 81
This predictive outcome graph is like the previous one, but this is used for offensive positions instead of draft
rounds. This graph shows that RB, WR, TE, and G will most likely outperform and QB, FB, T, and C will most
likely underperform their draft position.
Defensive
Positional Value Projected vs Results
35
30
25
20
15
10
5
0
DT DE/EDGE LB CB S
Projected 5 14 16 29 7
Results 10 5 8 20 5
Projected Results
Dorsey’s results when drafting defensive players have not been as impressive compared to his offensive
results. The only position where he has outperformed the projected value is DT. All the other positions on the
defensive side of the ball he has underperformed. The positions with which he has had the worst overall
results are CB and DE/EDGE, underperforming each by nine points. LB has almost been as bad,
underperforming projections by eight points. Dorsey defensive picks have had a total projected value of 71
points but only resulted in 48 points. This means that he has underperformed on his defensive selections by a
total of 23 points.
Predictive Outcome
3.00
2.50
2.00
1.50
1.00
0.50
0.00
-0.50
-1.00
-1.50
-2.00
-2.50
DI DE/EDGE LB CB S
Value 2.50 -1.80 -1.14 -1.00 -0.50
Baseline 0 0 0 0 0
Value BaselinePage 11 of 81
The predictive outcome model shows us that the value of Dorsey’s defensive picks should all have a negative
projected draft value except DT. His worst position, DE/EDGE picks, are predicted to underperform their draft
spots projected outcome by 1.8 points.
Steals
Steals are players that generated at least two points of value.
Biggest Steal
Tyreek Hill
100 1200
90
80 1000
70 800
60
50 600
40
30 400
20 200
10
0 0
1 2 3 4
PFF Grade 79.5 79.9 89 84.5
Snaps 451 830 1015 747
PFF Grade Snaps
The player that has generated the most value of all Dorsey’s picks is WR Tyreek Hill. Hill was selected in the
5th round with the 165th pick. The 165th pick has a projected value of two points, but Hill has resulted in eight
points. The value gained from this pick is six points, or the equivalent of a 1 st round 6-15 pick. The ironic thing
about this is that the 5th round is historically Dorsey’s worst round; if he had not picked Hill, his 5 th round
grade would have been much worse.Page 12 of 81
Best Steal Offensive
Travis Kelce
100 1200
90
80 1000
70 800
60
50 600
40
30 400
20 200
10
0 0
1 2 3 4
PFF Grade 84.6 73.7 88.9 83.3
Snaps 675 1060 941 900
PFF Grade Snaps
The offensive player (excluding Hill) that has generated the most value of all Dorsey picks is TE Travis Kelce.
Kelce was selected in the 3rd round with the 63rd pick. The 63rd pick had a projected value of 4 points, but
Kelce resulted in 8 points. The value gained from this pick is 4 points, or the equivalent of a 2 nd round pick.
Best Steal Defensive
Chris Jones
100 1200
90
80 1000
70 800
60
50 600
40
30 400
20 200
10
0 0
1 2 3 4
PFF Grade 72.6 89.5 90.9 89.4
Snaps 614 698 854 717
PFF Grade Snaps
The defensive player that has generated the most value of all Dorsey picks is DT Chris Jones. Jones was
selected in the 2nd round with the 37th pick. The 37th pick had a projected value of 4 points, but the Jones pick
resulted in 8 points. The value gained from this pick is 4 points, or the equivalent of a 2 nd round pick.Page 13 of 81
Other Notable Steals
1st Round: QB Patrick Mahomes, 2nd Round: RB Nick Chubb, 6th Round G Zach Fulton and G Laurent Duvernay-
Tardif
Busts
Busts are players that resulted in the team losing at least two points of value.
Biggest Bust
There was a three-way tie for this award, so I selected the player of the three that I deemed the worthiest.
KeiVarae Russell
1200
1000
800
600
400
200
0 0
1 2 3 4
PFF Grade
Snaps 0 0 0 0
PFF Grade Snaps
The player that was the biggest bust of Dorsey’s was CB KeiVarae Russell. Russell was selected in the 3 rd
round with the 74th pick. The 74th pick has a projected value of three points, but the Russell pick resulted in
zero points. The reason that the graph for Russell is blank is because he never played a snap for the Chiefs.
He was waived after being inactive for his one and only game as a Chiefs player.6
6
https://bleacherreport.com/articles/2663632-keivarae-russell-waived-by-chiefs-latest-comments-and-reactionPage 14 of 81
Biggest Bust Offense
Eric Fisher
100 1200
90
80 1000
70 800
60
50 600
40
30 400
20 200
10
0 0
1 2 3 4 5
PFF Grade 57.8 67.2 72.5 77.7 69.7
Snaps 792 1012 982 1078 1017
PFF Grade Snaps
The offensive player that was the biggest bust of Dorsey picks is T Eric Fisher. Fisher was selected in the 1 st
round with the 1st pick. The 1st pick of the 1st round has a projected value of seven points, but the Fisher pick
resulted in four points. The value lost from picking Fisher was three points, or the equivalent of a 3 rd round
pick. It can be easily argued that Dorsey did the best that he could in this situation. Fisher was selected in the
2013 NFL draft, which is one of the worst drafts of all time. Fisher took some time to develop, but eventually
turned into a solid contributor for the Chiefs. Fisher has developed into a very good NFL player, but he did
not live up to the expectations that come with being the 1st overall pick.Page 15 of 81
Biggest Bust Defense
Chad Thomas
100 1200
90
80 1000
70 800
60
50 600
40
30 400
20 200
10
0 0
1 2 3 4
PFF Grade 49.6 47.8
Snaps 22 464 0 0
PFF Grade Snaps
The defensive player (excluding Russell) that was the biggest bust of Dorsey picks is DE Chad Thomas. Thomas
was selected in the 3rd round with the 67th pick. The 67th pick had a projected value of three points, but
Thomas resulted in zero points. Thomas was waived after two years with the Browns. 7
Other Busts
1st Round: EDGE Dee Ford, 2nd Round: CB Greedy Williams and DE Tanoh Kpassagnon, 4th Round: WR Jehu
Chesson, 5th Round: LB Mack Wilson, QB Kevin Hogan, QB Aaron Murray, LB D.J. Alexander, LB Ukeme Eligwe,
6th Round: CB D. J. White
7
https://dawgpounddaily.com/2020/09/05/cleveland-browns-release-chad-thomas/Page 16 of 81
Draft Trends
Every GM has positions that they think are the most important to their team. The draft is a great place to find
these players and start grooming them. The Draft Trends graph shows what positions Dorsey has used the
most draft picks and the value of the draft picks used. The red line is the total number of draft picks that he
has picked at each position.
Draft Trends
10
9
8
7
6
5
4
3
2
1
0
1st Round 33-100 Draft Picks
Volume of Picks
Dorsey has used the greatest number of picks, per position, on CB. Dorsey has made a total of 54 draft picks
and of those 54, has used nine on CB (17%). The next most popular position for Dorsey is WR, using seven draft
picks at that position (13%). Of the main positions he has invested the fewest number of draft picks into are
TE, T, C, and DT. He has used two picks on each of these positions (4%).
High Picks Used by Position
Dorsey has used the most 1st round picks on QB and CB; two each (33% of 1st round picks for each of the
positions). Of the top 100 picks that Dorsey has used, CB has the greatest number with six picks (27% of top
100 picks). DE/EDGE and RB are tied for second in top 100 draft picks used, he has selected both positions
three times each (14% of top 100 picks). S is the only main position that Dorsey has not used a top 100 pick on.
Draft Trend Observations
Based on Dorsey’s history, there are a few patterns that emerge. CB and QB are the most important positions
to him. If he has a 1st round pick, he is most likely to use it on one of those two positions. CB is the most
important non QB position to him, he has picked CB more than any other position in the top 100 and has
drafted that position the most overall times (nine). Dorsey values the WR and LB position but prefers to wait
until later in the draft to select those positions. He has selected WR seven times, but only once in the top
100. He has selected four LB 7 times, twice in the top 100. When Dorsey drafts a QB he either drafts them inPage 17 of 81
the 1st round or waits until the later rounds of the draft, he has not drafted a QBs in 2 nd-4th rounds. He prefers
to draft RB after the 1st round but in the top 100, he has selected three of his four RBs in this area.
Dorsey’s drafting pyramid represents the positions that he places the most amount of value (top) on to the
least (bottom).
Dorsey’s Drafting Pyramid
CB, QB
DE/EDGE, RB
LB, WR
T, G
TE, DT,
C
SPage 18 of 81
Summary
Strengths
● Rounds 1-3
o Dorsey has proven that he is able to identify and draft high-end talent in the first three
rounds of the draft.
● Offensive
o Dorsey has been especially good at drafting offensive players.
● 1st round QBs
o Dorsey has drafted two QB’s in the top 10, both have been a success.
Weakness
● Later rounds
o He has struggled with finding role players in the later rounds of the draft. He has had some
excellent picks in these rounds but has missed on several picks. He seems to prefer to take
players with high upside and low floors, rather than solid role players with low ceilings and
high floors that are less likely to bust.
● Defensive
o Dorsey has struggled when picking defensive players.
● DE/EDGE
o DE/EDGE players are the position that Dorsey has been the least successful at drafting.Page 19 of 81
Review
The goal of this section is to grade Dorsey’s performance in the draft. Below are his draft scores by year, also
including his overall grade. Dorsey has proven himself to be a very capable scout and has done very well in
the draft. Most GMs would be very happy to have done as well as him. His success in the draft has been a key
factor in the rebuilding of the Chiefs and Browns rosters.
Projected Draft Value vs Results
35
30
25
20
15
10
5
0
2013 2014 2015 2016 2017 2018 2019
Projected 23 14 23 21 18 33 15
Results 14 15 25 23 13 29 8
Projected Results
Year Pts Grade
2013 -9 D-
2014 1 A
2015 2 A+
2016 2 A+
2017 -5 C
2018 -4 C+
2019 -7 D+
Overall -2.86 BPage 20 of 81
SECTION 3: FREE AGENCY
Overview
The purpose of this section is to analyze the effectiveness of Dorsey when signing free agents. This section
will only include players that were signed as a free agent or claimed off waivers. The only exception to this is
contracts that were signed by franchise tagged players. They are technically not free agents, but many top
tier players get tagged before signing new contracts. The main areas that will be examined to grade the
signing are effective APY (average per year) salary, level of performance, and availability. Effective APY salary
is defined as the average per year that a player counts against a team’s salary cap. The reason for using this is
that it accounts for the dead cap after some players are cut.
Free agency is one of the marquee events for any organization or GM. Fans want to see their teams sign big
ticket free agents and fill holes that they see in their team. FA is a vital tool for every GM but one that should
be used with caution.
Every offseason there are dozens of signings by every organization. To best analyze the effectiveness of
Dorsey in free agency I will be separating the free agent contracts into four categories: Superstar, Starter,
Role Player, and Bench Player. Superstar will include all contracts that have an APY (average per year) greater
than 7.5% of the salary cap in the year that they are signed. Starter will include all contracts that have an APY
greater than 4% but less than 7.5%. Role players will be all contracts with an APY of greater than 1.5% but
less than 4%. Bench players are players that sign for less than 1.5%.
Contract Categories
Superstar 7.5% +
Starter 4% - 7.5%
Role Players 1.5- 4%
Bench Players 0-1.5%
Each contract will be graded on a scale so that they can be evenly compared. When using the grading scale, a
grade of A means that a player far surpassed the contract that they signed, and the team gained immense
salary cap benefits from having that player on their team. B means that the player outperformed their
contract and that the team received a salary cap benefit from having the player on their team. C means that
the player lived up to their contract but did not surpass it or add any additional salary cap benefits to the
team based on the contract. D means that the player underperformed their contract, and the team could
have paid someone less money to get the same results that the player gave them. This leads to a negative
salary cap return. F means that the player underperformed their contract extremely and the team would
have been much better off by not resigning the player.Page 21 of 81
A very important thing to remember is that the contracts are what are being graded, not the players.
Meaning that the player’s performance is being measured directly against their contract. Players that sign a
bigger contract will have to have a bigger impact to justify that contract. For example, a player that signs a
contract in the superstar range will need to perform on a superstar level to achieve an average contract
score. In contrast, if a player signs a contract in the Role Player range, their contract could be graded as an
excellent contract by them playing at a starter level.
There are countless stats that can be looked at and different tools used to analyze a player’s performance. To
achieve the goal of being able to evenly compare players across every position, the main metric that we will
be using is comparing the players PFF (Pro Football Focus) grade against the number of snaps played. The two
reasons for doing this is that PFF’s grades consider all aspects of their play, and they are a neutral grading
site. Players are also graded on the same scale, meaning they can be compared across positions. Adding the
snap counts to the PFF grade paints a more complete picture. If a player has a high PFF score but played very
few snaps, the score is less relevant. By putting both numbers into one graph, trends emerge that enable us
to analyze a player’s impact on the team.
PFF Grading Scale
Elite 90-100
High Quality 80-89.9
Average 70-79.9
Below Average 60-69.9
Replaceable 0-59.9
Superstar Level Contact
The Superstar level contracts are defined as contracts that have a projected APY greater than 7.5% of the
salary cap in the year that they are signed. Superstar contracts are unique because organizations give very
few of them out in comparison to the other level of contracts.
When a team gives out a Superstar contract, it is always because the player has a very strong record of past
performance. Because of this, all the graphs below have been set up in a similar way. Year -2 and -1 are the
player’s previous two years before they sign their superstar contract, year one is the year that they sign the
contract, and years two and three are the two years after. The goal of doing it this way is that GMs are
expecting these players to maintain a similar level of performance after they sign as they did before signing.
These graphs will show us how their performance changed.Page 22 of 81
Dwayne Bowe
Contract
In 2012 the chiefs signed WR Dwayne Bowe to a five-year, $56 million/$11.2 million APY contract. This
contract was the 3rd highest WR contract at the time that it was signed.8 Bowe went on to play only two
years of this contract before being released. Of the possible $56 million he earned $24.2 million and had an
effective APY of 12.1 million.9
Performance
Bowe had a PFF grade average of 82.7 before signing his contract and a 73.25 average after. This drop is the
equivalent of going from a high quality player to being average. His snap count did remain very consistent.
Before his new contract he averaged 821 snaps per year and averaged 852 after.
Dwayne Bowe
100 1200
90
80 1000
70 800
60
50 600
40
30 400
20 200
10
0 0
-2 -1 1 2 3
PFF Grade 84.3 81.1 74.8 71.7
Snaps 906 737 911 794
PFF Grade Snaps
Review
Signing Bowe to a contract that made him the 3rd highest player was a mistake. Bowe was a good player
before signing this contract, but he was not great. If he would have maintained the same level of
performance this contract could have been defended. However, there was a large drop off in his
performance thus shining a large spotlight on this contract. His age could have played a role in his
performance since he was 29 when he signed this contract. Many players start regressing around 30, which
happened with Bowe. Based on the size of the contract, the large dip in player grade, and the fact that
Dorsey cut him after only two seasons on this contract -- this was a bad contract. Cutting Bowe left a lot of
dead money behind, but his effective APY was $12.1 per year making this contract far from catastrophic.
Contract Grade: D+
8
https://www.nfl.com/news/dwayne-bowe-signs-56m-deal-with-kansas-city-chiefs-0ap1000000146842
9
https://overthecap.com/player/dwayne-bowe/503/Page 23 of 81
Justin Houston
Contract
In 2015 the chiefs signed OLB/EDGE Justin Houston to a six-year, $101 million/$16.8 million APY contract.
This was the largest contract ever given to a linebacker, but since the Chiefs ran a 3-4 defense Houston spent
most of his time rushing the passer.10 This contract made him the second highest paid defensive player in the
NFL, ranking right behind Ndamukong Suh.11 Houston went on to play four out of the six years on that
contract before being released with an effective APY of $17 million.12
Performance
Houston had a PFF Average of 90.3 in the two years before signing his contract and 82 average the three
years after. This change is the equivalent of dropping from an elite level player to a high quality level. He also
had injury trouble after signing this contract, his snap count dropped from an average of 901 before to 677
per year after.
Justin Houston
100 1200
90
80 1000
70 800
60
50 600
40
30 400
20 200
10
0 0
-2 -1 1 2 3
PFF Grade 90.2 90.4 91.3 75.8 78.8
Snaps 762 1041 669 349 1015
PFF Grade Snaps
Review
When Houston was signed to this contract, he was arguably one of the best players in the NFL. In 2014 he
had recorded 22 sacks, which almost broke the single season record.13 He also was only 26 years old, which is
usually right at the prime of a player’s career. However, there is a stark contrast between his performance
before and after signing his new contract. His performance fell dramatically, and his snap count went down
considerably. A lot of this could be related to injuries but fans will probably never know what happened. He
played four of the six years of his contract with an effective APY of $17 million. The Chiefs gave Houston a
10
https://bleacherreport.com/articles/2430825-justin-houston-contract-latest-news-and-rumors-on-negotiations-with-chiefs
11
https://www.espn.com/nfl/story/_/id/13260695/kansas-city-chiefs-sign-justin-houston-landmark-deal
12
https://overthecap.com/player/justin-houston/517/
13
https://www.pro-football-reference.com/players/H/HousJu00.htmPage 24 of 81
huge contract to be an elite level player, instead he was just above average. Based on the size of his contract,
the dip in his performance and snap count this contract was a bad one for the Chiefs.
Contract Grade: D+
Jeremy Maclin
Contract
In 2015 the chiefs signed WR Jeremy Maclin to a five-year, $55 million/$11 million APY contract. 14 This
contract placed Maclin within the range of top 10 highest paid WR. In 2013 he tore his ACL in the preseason
and missed the remainder of the year.15 Because of this, we will only be taking the year prior to his new
contract into account for his averages. Maclin was cut after two years into his five-year contract having an
effective APY of $11.5 million.
Performance
Maclin had a PFF grade of 80.6 the year prior to signing his new contract, after his contract he had an average
of 71.4. This means that his performance dropped from being a high quality player to becoming average. His
snap count also dipped; it went from being 1030 before to averaging 787 after. Maclin dealt with several
injuries while with the chiefs, which lead to him missing several games.
Jeremy Maclin
100 1200
90
80 1000
70 800
60
50 600
40
30 400
20 200
10
0 0
-2 -1 1 2 3
PFF Grade 80.6 78.3 64.5
Snaps 1030 893 681
PFF Grade Snaps
Review
A major reason that Maclin did not have more success with the chiefs was the injury problems. With the
contract that Dorsey gave Maclin he was betting on him staying healthy, like the prior year to signing him, but
that is not what happened. As seen in the graph both his PFF grade and snap count dropped in each
subsequent year. Maclin’s contract has a lot of similarities to the contract the Chiefs gave Dwayne Bowe.
14
https://en.wikipedia.org/wiki/Jeremy_Maclin
15
https://sportsinjurypredictor.com/player/jeremy-maclin/17Page 25 of 81
Both were graded as high-end starts when they signed but regressed quickly, both signed 5-year contracts
but were cut after two years, and both were overpaid for their performance. Bowe was able to stay healthy
with the Chiefs and Maclin made less money. The two differences somewhat balanced the different contracts
out. There are very few positives with the contract that the Chiefs gave Maclin and because of this the
contract is graded as a bad contract.
Contract Grade: D
Eric Berry
Contract
In 2017, the Chiefs signed SS Eric Berry to a six-year, $78 million/$13 million APY contract. This contract made
Berry the highest-paid safety in the NFL.16 In the previous season Berry was assigned the franchise tag but
held out almost all the offseason wanting a long-term contract before signing the franchise tag. Berry was cut
after playing two of the six years of this deal, having an effective APY of $14.95 million. 17
Performance
Berry had an average PFF grade of 84.6 and averaged 1153 snaps per year prior to signing his contract. After
signing this massive contract Berry’s PFF grade and snap dramatically changed. He had an average PFF grade
of 64.4 and only averaged 133 snaps per year after. This means that Berry went from playing at a high-quality
level to becoming below average immediately after signing his contract. Even more impactful is that not only
did his level of play drop, but his snap count dropped almost by 90% as well. In his first season on this
contract Berry tore his Achilles in the season opener of 2017 and missed the rest of the season. 18 Fans still do
not know what happened to him the next season, he was listed day to day almost the entire season because
of a bone spur and played very little.19
16
https://en.wikipedia.org/wiki/Eric_Berry
17
https://overthecap.com/player/eric-berry/504/
18
https://www.nfl.com/news/reid-eric-berry-possibly-tore-achilles-will-have-mri-0ap3000000840732
19
https://www.nfl.com/news/chiefs-safety-eric-berry-dealing-with-heel-deformity-0ap3000000967505Page 26 of 81
Eric Berry
100 1200
90
80 1000
70 800
60
50 600
40
30 400
20 200
10
0 0
-2 -1 1 2 3
PFF Grade 79.3 89.9 66.4 62.4
Snaps 1154 1151 70 196
PFF Grade Snaps
Review
Berry was a great player and has an amazing story as part of the chief’s organization, but this contract was
terrible from the start. Berry’s contract can be considered nothing else other than a catastrophic failure and
might have even been a reason that Dorsey was fired. To put his contract into perspective the Chiefs paid
Berry almost $30 million to play 266 snaps at a backup player level.
Contract Grade: F
Jarvis Landry
Contract
In 2018, the Brown signed WR Jarvis Landry to a five-year, $75.5 million/$15.1 million APY contract, making
him the sixth highest paid receiver in the NFL.20 Landry is still playing for the Browns and about to enter the
fourth year of this contract.
Performance
Landry had an average PFF grade of 82.5 before signing his contract and a 79.2 grade after. According to PFF
he graded and still grades out as a high-quality level. His snap count has also remained consistent, going from
averaging 940 before his contract to 915 after. As seen by the graph Landry has been a very consistent player
for the Browns, maintaining his previous levels of production after signing his new contract.
20
https://www.nfl.com/news/browns-wr-jarvis-landry-signs-five-year-extension-0ap3000000926126Page 27 of 81
Jarvis Landry
100 1200
90
80 1000
70 800
60
50 600
40
30 400
20 200
10
0 0
-2 -1 1 2 3
PFF Grade 84.8 79.5 74.7 78.2 84.7
Snaps 952 929 957 973 815
PFF Grade Snaps
Review
There is nothing to say that is negative about this contract. Landry has performed almost identically from
before he signed his new contract as he did after signing it. Most of the snaps he missed were COVID related
so they should even be counted against him. The only argument that can be made against this contract is that
he should not have been paid as the sixth highest receiver. This might be true, but the contract seems to
follow the trend of what players get paid when they get new contracts. WR contracts have continued to go
up considerably since Landry signed this contract making the amount, he makes very reasonable. This is
exactly what every team hopes to get out of a player after signing them to a superstar level contract. This was
a good contract for the Browns and a good contract for Landry. It is unknown at this time if he will complete
this contract. Even if he is released/traded there will be minimal negatives for the Browns.
Contract Grade: BPage 28 of 81
Starter Level Contracts
Starter level contracts are defined as contracts, when signed, that have a projected APY (average per year)
value of between 4% and 7.5% of that season’s salary cap. Players that are signing contracts in this range
should be expected to be full-time starters and play a significant role on the team.
Like with the Superstar contract levels year -2 and -1 will be the player performance the previous two years
before signing the new contract. Year one is the year they signed the contract and years two and three are
the two years after.
Sean Smith
Contract
In 2013 the Chiefs signed CB Sean Smith to a three-year, $18 million/$6 million APY contract. 21 Smith played
all three years of this contract.
Performance
Before signing with the chiefs Smith had an average PFF grade of 57.9 and after signing with them he had an
average of 76. He improved from being graded as a replaceable level player according to PFF (the lowest
category) to an average level player. As the graph shows his PFF grade was similar in the first year of this
contract to his performance before signing with the Chiefs. After the first year his performance significantly
increased, and he averaged a PFF grade of 80.6 in those two seasons. His snap count also stayed consistent
going from averaging 1055 per year to 1027.
Sean Smith
100 1200
90
80 1000
70 800
60
50 600
40
30 400
20 200
10
0 0
-2 -1 1 2 3
PFF Grade 52.8 63 67 87.1 74
Snaps 1064 1046 1081 1046 954
PFF Grade Snaps
Review
21
https://www.nfl.com/news/sean-smith-k-c-chiefs-have-three-year-18m-contract-0ap1000000150699Page 29 of 81
Everything about this contract worked out great for the chiefs. His play improved, his snap count stayed
consistent, and his contract was very team friendly. He outperformed his contract by playing at a much
higher level than the salary that he earned.
Grade: A+
Mitchel Schwartz
Contract
In 2016, the chiefs signed RT Mitchell Schwartz to a five-year, $33 million contract/$6.6 million APY contract.
This contract made him one of the highest-paid right tackles in the NFL.22 Schwarz played the five years of
this contract and even signed a one-year extension (but was released before playing that year).
Performance
Before signing with the chiefs Schwartz was averaging a PFF grade of 75.8 and after signing had an average of
77 in the first three years. His snap count averaged 1082 before the new contract and 1113 after. Schwarz
checked all the boxes that Chiefs wanted when they signed him, he continued to play at an average player
level and did not miss snaps. While playing for the Chiefs he was even named an All-Pro four times.
Mitchell Schwartz
100 1200
90
80 1000
70 800
60
50 600
40
30 400
20 200
10
0 0
-2 -1 1 2 3
PFF Grade 72.6 78.9 73.4 72.9 84.7
Snaps 1059 1106 1078 1083 1178
PFF Grade Snaps
Review
This contract is elite because Schwartz continued his high level of play, and his cap numbers were extremely
team friendly. Right tackles have always been paid less than left tackles, but this gap has been shrinking
considerably in the last few years. Dorsey was able to identify that the NFL is changing, and that RT was being
underpaid in relation to their value. Even though Dorsey paid Schwartz at the top of the RT market Schwartz
level of play more than justified this. This contract was a homerun for the Chiefs.
22
https://en.wikipedia.org/wiki/Mitchell_SchwartzPage 30 of 81
Grade: A+
Tamba Hali
Contract
In 2016 the chiefs signed OLB Tamba Hali to a 3 year, $22 million/$7.3 million APY contract.23 He was
released after the second year of this contract and had an effective APY of $7 million.24
Performance
Before signing this contract Hali had an average PFF grade of 77.9 but dropped to an below average grade of
68.4 after signing this contract. He was also averaging 946 snaps per year before and that dropped to 358
after.
Tamba Hali
100 1200
90
80 1000
70 800
60
50 600
40
30 400
20 200
10
0 0
-2 -1 1 2 3
PFF Grade 74.1 81.6 77.8 59
Snaps 983 909 599 116
PFF Grade Snaps
Review
When the chiefs signed Hali, he was 32 and the size of the contract suggest that they foresaw him going from
being a full-time player to a situational pass rusher. Unfortunately, Hali’s performance and availability
immediately declined, and he did not live up to this contract. His first year was decent but nothing about this
contract can be viewed as a positive. It deserves the bad grade that it has earned.
Grade: D-
23
https://www.profootballrumors.com/2016/03/chiefs-to-re-sign-tamba-hali
24
https://overthecap.com/player/tamba-hali/531/Page 31 of 81
Derrick Johnson
Contract
In 2016, the Chiefs signed LB Derrick Johnson to a three-year, $21 million/$7 million per year contract.25 The
Chiefs were able to renegotiate his contract so that he was paid less in the second year of his contract (year 4
in graph). The final year of his contract was voided due to contract language.26 After everything, Johnson had
an effective APY of $6.625 million per year in those two years that he played.
Performance
In 2014 he only played in one game because he tore his Achilles, because of this, we will not use that season
in grades or snap counts. Before signing this contract, he had a PFF grade of 85.2 but averaged a PFF grade of
67.8 after. His snap also declined, going from 1184 snaps in 2015 down to the average of 867 after.
Derrick Johnson
100 1200
90
80 1000
70 800
60
50 600
40
30 400
20 200
10
0 0
-2 -1 1 2 3
PFF Grade 72.4 85.2 70.5 65.1
Snaps 32 1184 841 893
PFF Grade Snaps
Review
Johnson was 32 years old when he signed this contract, which probably played a large role in his decline. This
contract was probably slightly better than the contract that the chiefs gave Hali because he was able to
maintain a decent level of snaps, albeit at a replacement level of play. Overall, there are not any positives
that came out of this contract for the Chiefs.
Grade: D
25
https://en.wikipedia.org/wiki/Derrick_Johnson
26
https://www.espn.com/nfl/story/_/id/18931437/kansas-city-chiefs-reach-pay-cuts-derrick-johnson-anthony-shermanPage 32 of 81
Bennie Logan
Contract
In 2017 the Chiefs signed DT Bennie Logan to a one-year deal worth $8 million. He played the one-year for
the Chiefs and the Chiefs did not re-sign him.
Performance
Before signing the contract, Logan was averaging a PFF grade of 66.9 and had a grade of 63.5 in the one year
with the chiefs. His snap count averaged 523 before and was 617 with the chiefs. He was rated as a below
average level player before signing and played at the same level after.
Bennie Logan
100 1200
90
80 1000
70 800
60
50 600
40
30 400
20 200
10
0 0
-2 -1 1
PFF Grade 73.3 60.5 63.5
Snaps 578 467 617
PFF Grade Snaps
Review
They paid him a few million more than he was worth but when signing players to a one-year contract players
usually get a higher salary. The money could have been spent in a better place, but the chiefs lost Dontari Poe
that year and maybe thought that they needed Logan to fill the gap for a year. His performance took a dip
compared to the average of the previous two seasons, but it was still similar while playing a few more snaps.
Grade: C
T.J. Carrie
Contract
In 2018, the Browns signed CB T.J. Carrie to a four-year, $31/$7.75 million per year contract. Carrie only
lasted for two years on this contract before being released. His effective APY was $8 million per year. 27
27
https://overthecap.com/player/t-j-carrie/3158/Page 33 of 81
Performance
Before signing with the Browns, Carrie had an average PFF grade of 71.1. After signing with them, he had an
average grade of 63. His snap count went up from averaging 701 per year to 792. As the graph shows Carrie’s
snap count was dropping before he was released. The reason for this is that other CB on the team were
passing him on the depth chart and taking more snaps. When looking at his PFF grade, it is very apparent that
his performance just was not good enough. In his first year on this contract, he averaged 66.9 score which is a
below average level and in his second he averaged a 59.2 which places him in the replacement category.
T.J. Carrie
100 1200
90
80 1000
70 800
60
50 600
40
30 400
20 200
10
0 0
-2 -1 1 2 3
PFF Grade 67.7 74.5 66.9 59.2
Snaps 378 1023 908 676
PFF Grade Snaps
Review
This contract was very bad for the Browns and generated little value. The Browns were wise to cut him after
two years. The year before signing with the Browns Carrie had a good year and Dorsey must have thought
that Carrie was a starter level player -- which was not the case.
Grade: D-
Chris Hubbard
Contract
In 2018, the Browns signed RT Chris Hubbard to a five-year, $37.50 million/$7.5 million APY contract. 28 This
contract put Hubbard in the pay range of the top 10 starting RT salaries. Hubbard is still playing for the
Browns, but he did renegotiate his contract in 2020 to take a pay cut. Before taking the pay cut, he had an
effective APY salary of $7.73 million per year.29
Performance
28
https://en.wikipedia.org/wiki/Chris_Hubbard
29
https://overthecap.com/player/chris-hubbard/2708/Page 34 of 81
Before signing with the Browns Hubbard had averaged a PFF grade of 68.1 and went on to average a grade of
62.5 after signing his new contract. He averaged playing 599 snaps per game before and 757 after signing.
The graph for Hubbard does a great job of showing what most likely happened with Hubbard. Dorsey
watched his 2017 tape and thought that Hubbard could be a starting RT. When he came to the Browns
instead of improving on his play he declined. The Browns decided he was not good enough to be the starter
and his playing time declined because they moved him into a backup role.
Chris Hubbard
100 1200
90
80 1000
70 800
60
50 600
40
30 400
20 200
10
0 0
-2 -1 1 2 3
PFF Grade 68 68.2 65.1 50.5 71.9
Snaps 351 847 1091 891 290
PFF Grade Snaps
Review
He was not good enough to be a starter and cost too much to be their swing tackle. In 2020 the Browns made
Jack Conklin the highest paid RT to replace him. Hubbard appears to have found his role as offensive line
depth and is now being paid in that range. Offensive line depth does not need to be paid the amount that
Hubbard was making.
Grade: D
Sheldon Richardson
Contract
In 2019, the Browns signed DT Sheldon Richardson to a three-year, $36 million/$13 million APY contract. He
played two of the three years of his contract before being released. After being released his effective APY
was $12.45 million per year.30
Performance
Before signing with the Browns, he had been averaging a PFF grade of 70.9 and averaged 71.3 after. His snap
count increased from 687 per year to 847. His PFF ranking has him staying consistently around the low-end
30
https://overthecap.com/player/sheldon-richardson/2194/Page 35 of 81
average level. Richardson performed very similarly after signing his contract as he did before and played
quite a few more snaps.
Sheldon Richardson
100 1200
90
80 1000
70 800
60
50 600
40
30 400
20 200
10
0 0
-2 -1 1 2 3
PFF Grade 72.2 69.5 73.9 68.7
Snaps 654 719 774 920
PFF Grade Snaps
Review
Richardson being cut in the final year of his contract was not expected by most. There was only a small
amount of dead money when they cut him so the way the contract was set up was a positive for the team.
Overall, I do not see any negatives in this contract other than maybe the Browns paid Richardson a little more
than he was worth.
Grade: CPage 36 of 81
Role and Bench Players Level Contracts
Role Player level contracts are defined as contracts that have a projected APY of less than 4% but greater
than 1.5% of the salary cap in the year that they are signed. Bench player contracts are for players that are
signed that have a projected APY of less than 1.5% of the salary cap in the year that they are signed.
Role and bench player contracts are most of what GM’s sign players to. In any given year GM’s will sign
several role players and dozens of bench players. The reason for so many bench players is that teams can
have up to 90 players on their offseason roster. Teams bring in a lot of players that they think might have
some potential to compete in camp. This process for teams is like looking for a needle in a haystack. It is rare
to find a player that makes a difference on the team. When they find a player that does, it is beneficial to the
team because these players have small salaries.
Rather than evaluating all these players and transactions, I will just focus on the moves that Dorsey made
that had a significant positive impact on the team. When looking at players that made in the 2-4% range,
most of those contracts were either average or bad. These players are being paid to be role players, so the
expectations are very low for them. The same is even more true for players being paid on minimum
contracts. Instead of analyzing all these moves, I will just focus on the ones that made a significant impact on
the team.
The graphs for these players will not include any previous years played before they were signed by the Chiefs.
Year one will be the first year they were on the Chiefs and any years after that pertain to their time with the
Chiefs.Page 37 of 81
Ron Parker
Contract
In 2013 the Chiefs claimed Ron Parker off waivers from the Seattle Seahawks.31 Parker played out his two-
year, $1.2 million/$600,000 APY contract with the Chiefs before resigning with them in 2015. The Chiefs
signed him to a five year, $25 million/$5 million APY contract.32 He was released from that contract after
three years and earned an effective APY of $4.5 million.33
Performance
In his first year with the Chiefs Parker was just a role player but he performed very well in his limited snaps
(89.8 PFF grade). In his second year he took over the starter role playing 1021 snaps. He only graded out at a
63.8 according to PFF which is a below average player level. He was able to dramatically improve his play in
the next two years (three and four) averaging a PFF grade of 71.7 (avearge level). His performance really
dropped off in year five, cratering all the way to a PFF score of 57.3. He was released after that season.
Ron Parker
100 1200
90
80 1000
70 800
60
50 600
40
30 400
20 200
10
0 0
1 2 3 4 5
PFF Grade 89.8 63.8 70.6 72.8 57.3
Snaps 100 1021 1183 1168 1099
PFF Grade Snaps
Review
There are a few reasons that Parker's time with the Chiefs should be highlighted as a positive for Dorsey. The
first is that Parker had bounced around the league quite a bit and Dorsey identified his potential and claimed
him off waives. The next is that the Chiefs got tremendous value out of his first two years that he was on the
team. His five year, $5 million per year contract did not generate as much value for the Chiefs but he
outperformed his contract in the first two years of this contract before struggling in his 3 rd year before being
31 https://web.archive.org/web/20160725210423/http://www.chiefs.com/news/article-2/Chiefs-Announce-Roster-
Transactions/eeaa57a3-fa04-48cf-9fcf-956d0599aa51
32 https://overthecap.com/player/ron-parker/1889/
33 https://overthecap.com/player/ron-parker/1889/Page 38 of 81
cut. The effective APY of $4.5 million for those three years was a positive for the Chiefs and did generate
value for them.
Grade: B+
Husain Abdullah
Contract
In 2013 the Chiefs signed Husain Abdullah in 2013 to a 1 year, $640,000 contract. 34 The Chiefs re-signed him
after that year to a 2 year $2.275 million/$1.14 million APY contract. Abdullah played all three years with the
Chiefs before retiring.
Performance
In his first year with the Chiefs, he had a PFF grade of 79.2 while playing 341 snaps. In the next two years he
had an average PFF grade of 71.9 while playing an average of 759 snaps per year. As seen by his PFF grade
Abdullah was a very consistent player for the Chiefs. When called upon to be a starter in year two he graded
out at 72.7 which is an average level player.
Husain Abdullah
100 1200
90
80 1000
70 800
60
50 600
40
30 400
20 200
10
0 0
1 2 3
PFF Grade 79.2 72.7 71.1
Snaps 341 1032 486
PFF Grade Snaps
Review
Abdullah proved to be extremely valuable to the Chiefs and helped them maintain their high level of play
through Eric Berry’s fight against cancer. What really stands out about this signing for Dorsey is that Abdullah
had taken the previous year off before signing with the Chiefs. Dorsey did a great job of seeing that Abdullah
had talent and giving him a shot. Everything about Abdullah’s contracts brought immense value to the Chiefs,
he was paid very little in contrast to his level of play.
Grade: A
34
https://www.spotrac.com/nfl/kansas-city-chiefs/husain-abdullah-4641/transactions/Page 39 of 81
Albert Wilson
Contract
In 2014, the Kansas City Chiefs signed Wilson who was UDFA to a three-year, $1.54 million/$513,333 APY
contract. After his third year the Chiefs placed a one year $1.78 million tender on him to play a fourth year,
since he was a RFA (restricted free agent).35
Performance
Wilson had an average PFF grade of 64.5 and played an average of 522 snaps per year. Wilsons best year
came in his fourth year averaging a PFF grade of 73.8 while playing 593 snaps.
Albet Wilson
100 1200
90
80 1000
70 800
60
50 600
40
30 400
20 200
10
0 0
1 2 3 4
PFF Grade 68.4 62.5 53.2 73.8
Snaps 217 788 489 593
PFF Grade Snaps
Review
Very rarely do UDFA signings turn into anything more than a camp invite and then the player being released
during roster cuts. This is a rare example of a player that not only made the roster but played meaningful
snaps and had a positive impact. Wilson’s time for the Chiefs was not spectacular but contracts like these are
what let teams invest in the top of their rosters.
Grade: A
35
https://www.spotrac.com/nfl/miami-dolphins/albert-wilson-14949/transactions/Page 40 of 81
Terrence Mitchell
Contract
Terrence Mitchell was signed, released, and placed on the practice squad by several teams including the
Chiefs. Mitchell played for the Chiefs for two years from 2016-2017. During those two years with the Chiefs,
he earned approximately $900,000/$450,000 per year.36
Performance
Mitchell had an average PFF grade of 68.9 and played an average of 500 snaps per year when he was with the
Chiefs.
Terrence Mitchell
100 1200
90
80 1000
70 800
60
50 600
40
30 400
20 200
10
0 0
1 2
PFF Grade 74.2 63.6
Snaps 295 705
PFF Grade Snaps
Review
Mitchell only started for part of his second year as a Chiefs, but he is exactly what teams try to find when
they sign players to low-cost contracts. When he was needed, he proved to be a competent player and was
even able to start when he was called upon.
Grade: A
36
https://overthecap.com/player/terrance-mitchell/3193/Page 41 of 81
Terrence Mitchell
Contract
In 2018, the Browns signed Terrence Mitchell to a three-year, $12 million/$3.33 APY contract. 37 He played all
three years of the contract and was not re-signed by the Browns.
Performance
Mitchel was very consistent for the Browns and had an average PFF grade of 65. While playing meaningful
snaps the first two seasons, Mitchell played 1225 snaps in his third year and averaged a 68.2 grade.
Terrence Mitchell
100 1200
90
80 1000
70 800
60
50 600
40
30 400
20 200
10
0 0
1 2 3
PFF Grade 64 63 68.2
Snaps 445 329 1225
PFF Grade Snaps
Review
Mitchell was signed to a small three-year contract, but it proved to be very valuable to the Browns. In the
first two years of the contract Mitchell played around the level of his contract, but in his third year he proved
to be extremely valuable to the Browns playing 1225 snaps and maintaining a decent level of play.
Grade: A
37
https://en.wikipedia.org/wiki/Terrance_MitchellYou can also read