Joint improvements of radar/ infrared stealth for exhaust system of unmanned aircraft based on sorting factor Pareto solution
←
→
Page content transcription
If your browser does not render page correctly, please read the page content below
www.nature.com/scientificreports
OPEN Joint improvements of radar/
infrared stealth for exhaust system
of unmanned aircraft based
on sorting factor Pareto solution
Ze Yang Zhou* & Jun Huang
In order to reduce the radar cross section (RCS) of the unmanned aircraft while suppressing
its infrared signature, a comprehensive design method (CDM) based on sorting factor Pareto
solution is presented. The physical optics and physical diffraction theory are used to evaluate the
electromagnetic scattering characteristics of the aircraft, and the Monte Carlo and ray tracing method
are used to evaluate the infrared radiation intensity of the exhaust system. CDM is used to evaluate
and screen each individual in each offspring, and the design parameters and sub-models of the aircraft
exhaust system are continuously improved. The results show that the exhaust port model, lower
baffle and nozzle height are the main factors affecting the RCS indicators, nozzle stages, exhaust port
model, lower baffle and outer width make the main contribution to infrared radiation suppression.
The presented CDM is efficient and effective in enhancing the radar/infrared integrated stealth
performance of the aircraft.
The exhaust system of an unmanned fighter not only affects its aerodynamic characteristics and infrared (IR)
signature, but also affects the electromagnetic scattering characteristics of its tail and sides1–3. Studying the
comprehensive design of the exhaust system is of great significance to the infrared/radar stealth performance
of the aircraft.
Future fighters and bombers are inclined to ultra-flat fuselage layout, which also brings certain challenges
to the design of their intake and exhaust systems, while the balance and restriction between multiple perfor-
mances is also the key concern of interdisciplinary4,5. Computational fluid dynamics (CFD), physical optics
(PO), radial basis functions and sequential quadratic programming are integrated to optimize the aerodynamic/
stealth characteristics of the flying wing aircraft, and good design variables and strategies are o btained6. Diverter
less technology and tail nozzle baffles are often used on stealth fighters to improve the aerodynamic and stealth
characteristics of these aircraft7,8. Compared with the traditional layout, the flying wing layout has the advan-
tages of high aerodynamic efficiency, stealth and internal space utilization9,10, which makes the design of its
exhaust system must take into account the low radar cross-section (RCS) and infrared radiation. Surface pixel
method, PO and equivalent electromagnetic flow method are used to solve the RCS of three-wing fighter and
stealth fighter11,12. Based on the existing aerodynamic design concepts and RCS analysis methods, the stealth
development of the unmanned fighter exhaust system will pay more attention to infrared radiation suppression
and radar/infrared integrated stealth.
The rapid development of high-sensitivity, high-resolution infrared imaging detection technology has made
the survivability of fighters with radar stealth design also c hallenged13,14. Replace the axisymmetric nozzle with
a binary non-axisymmetric nozzle with larger width and height to obtain better infrared radiation suppression.
Combining the exponential broad band model and the radiation transfer equation (RTE), an infrared radia-
tion characteristic estimation method was developed to evaluate the infrared signature of the engine exhaust
system15. Using the CFD method, the temperature field of the unmanned combat aircraft in the non-forced state
is obtained, and the numerical calculation of infrared radiation is p erformed16,17. Ray tracing method is used
to solve the infrared signature of high temperature exhaust gas from different n ozzles18. The serpentine nozzle
can effectively suppress the infrared radiation characteristics while enhancing the radar stealth characteristics of
military aircraft19. With the rise of comprehensive stealth research20, the design and optimization of unmanned
combat aircraft are more inclined to consider multiple performance21,22. The gray correlation model can effectively
School of Aeronautic Science and Engineering, Beihang University, Beijing 100083, China. *email: zeyangzhou@
buaa.edu.cn
Scientific Reports | (2021) 11:8251 | https://doi.org/10.1038/s41598-021-87756-0 1
Vol.:(0123456789)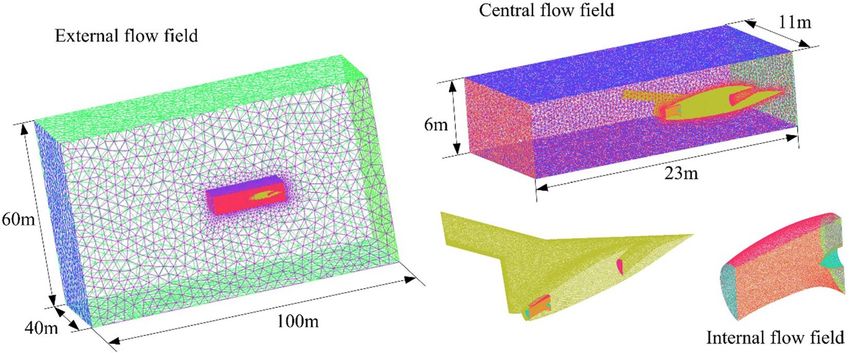
www.nature.com/scientificreports/
Figure 1. Schematic diagram of radar/infrared integrated stealth design of aircraft exhaust system, drawn using
Microsoft Visio 2007.
evaluate the aerodynamic characteristics, RCS and IR signatures of the a ircraft22–24. The comprehensive optimiza-
tion method based on Pareto solution can also give a better solution to the needs of many aspects of s tealth25,26.
The continuous development of various technologies of unmanned b ombers27 has also prompted its radar stealth
design and infrared radiation suppression to achieve a better balance.
Previous research on the exhaust system of unmanned combat aircraft has mostly focused on aerodynamic
shape improvement and infrared radiation characteristic calculation. With the continuous development and
joint search of radar and infrared detectors, unilateral reduction of RCS or IR signatures has been unable to
counter the threat of multiphysics. In view of the mutual constraints of aerodynamics, radar stealth and infrared
radiation suppression when designing the unmanned aircraft exhaust system, this paper attempts to establish a
hybrid design approach to establish a comprehensive stealth scheme that takes into account aerodynamic char-
acteristics. This is of guiding significance and engineering value for improving the survivability and integrated
combat effectiveness of unmanned fighters.
In this manuscript, the comprehensive design method (CDM) is presented in Sect. 2. Models of unmanned
aircraft and exhaust system are built in Sect. 3. The results of RCS and IR signatures are provided and discussed
in detail in Sect. 4. Finally, the full article is summarized in Sect. 5.
Comprehensive design method
The analysis of the threat of unmanned aircraft from radar and infrared detectors is shown in Fig. 1, where α is
the azimuth between the radar station and the aircraft, β is the elevation angle between the radar station and the
aircraft. The comprehensive design method is used to reduce the electromagnetic scattering level of the aircraft
exhaust system while suppressing its infrared radiation.
The entire design process includes three parts as shown in Fig. 2: the establishment of the initial model (m0),
the calculation of performance indicators and the cycle judgment module. The first part emphasizes that both the
flow field calculation and the grid need to converge to ensure that the subsequent calculations are comparable.
The middle module performs aerodynamic, IR and RCS evaluation on each individual in each offspring, and
comprehensively evaluates the optimal solution (M*). The third part judges the termination of the obtained M*
to see if the next generation (Gen) design is needed.
RCS calculation. PO and physical theory of diffraction (PTD) are used to solve the electromagnetic scat-
ffspring3. According to the magnetic vector position caused by
tering characteristics of each individual in each o
the induced current on the surface of the target model, the electric field and magnetic field can be obtained as
follows:
3 − k2 R2 + j3kR −jkR
1
′
′
1 + jkR −jkR
dS′
E(r) = e R × R × J s r + 2J s r e (1)
jωε · 4π R5 R3
S′
1 −1 − jkR −jkR
R × Js r′ dS′
H(r) = e (2)
4π R3
S′
Scientific Reports | (2021) 11:8251 | https://doi.org/10.1038/s41598-021-87756-0 2
Vol:.(1234567890)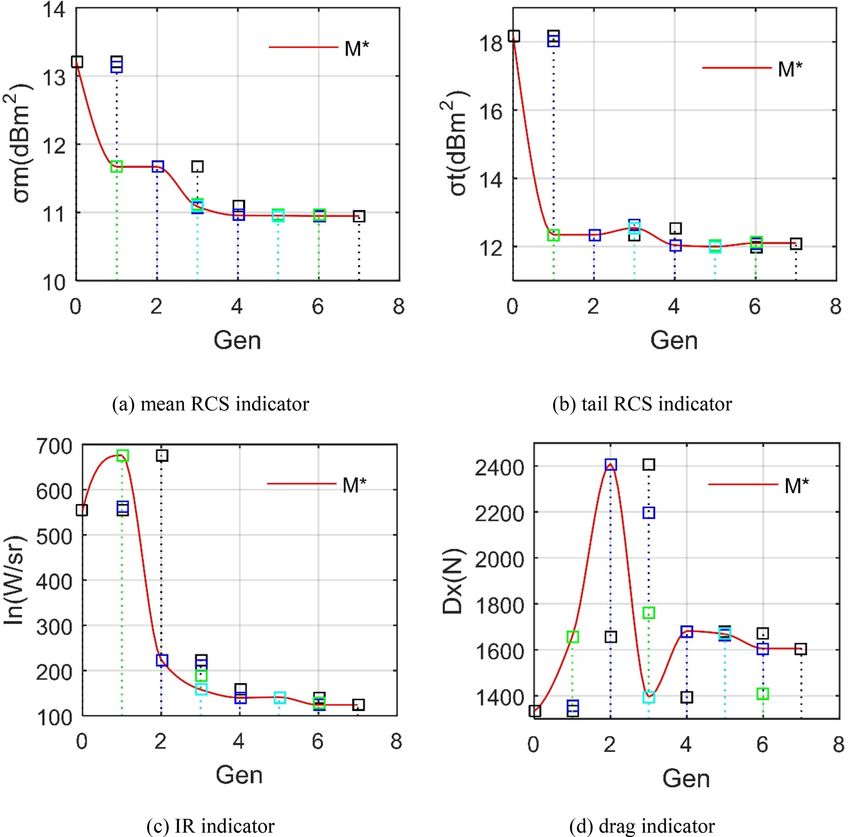
www.nature.com/scientificreports/
Figure 2. Flow chart of the comprehensive design method, drawn using Microsoft Visio 2007.
where r is the coordinate vector of the field point, ω is the electromagnetic wave angular frequency, k is the
wave number in free space, R is the distance vector between the field point and the source point, r′ refers to
the coordinate vector of the source point, ε is the dielectric permittivity28–30, Js represents the induced current
on the target surface. When calculating RCS, the integral surface of the model is treated as an ideal conductor.
According to the assumption of PO, there is current in the illuminated area of the target surface, but no cur-
rent in the dark area:
2n × H ZI
Js =
0 ZD (3)
where ZI refers to the illuminated area, ZD is the dark area, and n represents the unit normal vector of the outer
normal direction of r’ at the surface of the scatterer. Therefore, the electric field formula can be changed to
j
′
Es (r) = |E0 |e−jk·r r̂ × r̂ × n̂ r′ · E0 k̂ − n̂ r′ · k̂ E0 e−jk(−r̂+k̂)·r dS′
r (4)
S′
where k means wave vector, λ represents the wavelength in free space, r refers to the distance from the field point
to the origin of coordinates. The integral term can be calculated separately, so there is the following expression:
−jk −r̂+k̂ ·r′ ′
′ ′
I= r̂ × r̂ × n̂ r · E0 k̂ − n̂ r · k̂ E0 e dS (5)
S′
Therefore, the RCS of the surface can be determined as
4π 2
σPO = |I| (6)
2
In fact, the aircraft model has many edges and split angles, and these geometric features will also produce
diffraction effects on electromagnetic waves. Here, PTD is used to solve the edge diffraction. 20 The total RCS
can be expressed as the joint contribution of PO and PTD:
2
NF
√ NE
√
(7)
σ = σPO + σPTD
i j
i=1 j=1
where NF refers to the number of facets and NE represents the number of edges. The presented RCS calcula-
tion method is verified by PO + MOM (Method of Moment)/MLFMM (Multi-Level Fast Multipole Method) in
FEKO (FEldberechnung bei Korpern mit beliebiger Oberflache) as shown in Fig. 3, where fR is the radar wave
frequency and the radar wave uses horizontal polarization. It can be seen that the two RCS curves are roughly
coincident, and the result calculated by FEKO is slightly larger than the other, where the mean of the RCS curve
of PO + PTD is smaller than that of FEKO by 0.3909 dBm2. This is because the two use different grid processing
methods and different RCS algorithms. These results indicate that the RCS algorithm presented in this paper is
accurate to deal with the electromagnetic scattering characteristics of the aircraft model.
IR signature evaluation. Monte Carlo (MC) and ray tracing method (RTM) are used to solve the infrared
signature of aircraft exhaust system3. Consider the absorption and emission in the RTE, without considering the
scattering of the medium, so that the refractive index is always equal to 1, then RTE can be described as:
Scientific Reports | (2021) 11:8251 | https://doi.org/10.1038/s41598-021-87756-0 3
Vol.:(0123456789)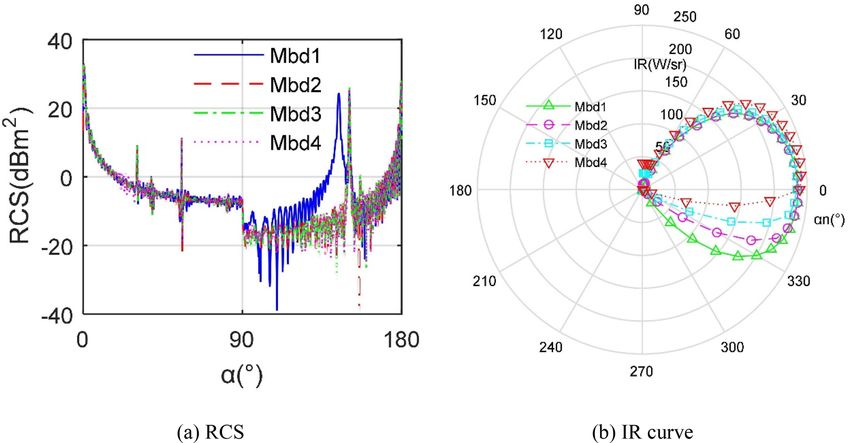
www.nature.com/scientificreports/
Figure 3. Verification of RCS calculation method on m0, β = 0°, fR = 10 GHz.
dL(r, s) σ T4
+ aL(r, s) = a (8)
ds π
where r refers to the position vector, s is the direction vector, s represents the length along the path, a is the
absorption coefficient, L is the radiance, σ refers to the Stefan-Boltzmann constant, T is the local temperature.
Using discrete coordinate model to calculate thermal radiation, RTE can be transformed into:
σ T4
∇ · [L(r, s)s] + aL(r, s) = a (9)
π
According to MC + RTM, the spectral radiance reaching the receiving point of the detector can be expressed
as:
n−1
Lσ = Lσ0 τ1σ τ2σ ···τnσ +Lbσ
1 n
(10)
(1 − τ1σ )τ2σ τ3σ ···τnσ +···+Lbσ 1 − τ(n−1)σ τnσ +Lbσ (1 − τnσ )
where refers to spectral radiance of wall reverse rays,
Lσ0 means spectral radiance, τiσ represents i-th layer
i
Lbσ
spectral transmittance.
On this basis, the irradiance reaching the receiving point of the detector can be calculated as:
Nb
N
E= Lσn ,(i,j) · cos θj · ��j · �σi · 100 (11)
i=1 j=1
where E means the radiant illumination, Nb refers to the total number of wave bands, N represents the total
number of rays contributing to the measurement point, θ jrefers to the angle between the center of the j-th solid
angle and the surface normal of its measuring point, ΔΩ jmeans the j-th solid angle, Δσi is the width of the i-th
wave band.
At this time, the radiation intensity can be determined as:
Iσ = Eσ (R) · R2 (12)
where I is the radiation intensity and R refers to the linear distance between the aircraft and the IR detector.
For the infrared radiation of the exhaust pipe, regarding the exhaust pipe as a gray body, the total radiation
and total radiation intensity can be expressed as:
ε 2
ε
L� = M 1 ∼ 2 = M d (13)
π π 1
I� = L� �A cos θ (14)
where λ is the wavelength, M 1 ∼ 2 represents the radiation emission degree of the black body between the bands
λ1 ~ λ2. ε is the emissivity of the exhaust pipe, which is set to 0.9. ΔA is the area of the nozzle bin, Mλ means the
spectral radiation emission degree of the black body.
Noting the Planck’s formula:
Scientific Reports | (2021) 11:8251 | https://doi.org/10.1038/s41598-021-87756-0 4
Vol:.(1234567890)
www.nature.com/scientificreports/
Figure 4. Verification of IR signature calculation method, 3–5 μm wavelength band.
c1 1
M = (15)
5 ec2 /( T) − 1
Thus the radiation emittance of blackbody in λ1 ~ λ2 band could be calculated as:
15σ T 4 c2 /( 1 T) x 3
M 1 ∼ 2 = dx (16)
π4 x
c2 /( 2 T) e − 1
The radiation constants have the following relationship:
hc 2π5 k4
c1 = 2πhc 2 , c2 = k , σ = 15c 2 h3 (17)
where h refers to the Planck constant, h = 6.626176 × 10⁻³⁴ J·s, k = 1.38 × 10⁻²³ J/K, c is the speed of light. The IR
signature calculation method presented here is verified as shown in Fig. 4, where the calculation results presented
here are basically consistent with the known data in the l iterature26. The mean of the red data is 1.67 W/sr smaller
than that of the green data. These results indicate that the IR calculations in this paper are feasible and accurate
for evaluating the infrared radiation characteristics of this aircraft exhaust system.
Comprehensive stealth design. In order to improve the radar/infrared stealth performance of this air-
craft, the objective function is defined as follows:
min : fiind (m) , i ind = 1, 2, 3
M = {m1 , m2 , ..., mn } (18)
where iind is the serial number, m is the individual of the aircraft model, M is the collection of descendants20,25,
noting that this expression implies that the objective function pursues the minimum of these three indicators.
The comprehensive stealth indicators are:
f1 (m) = σm
0◦ ≤ α ≤ 180◦ , β = 0◦
f2 (m) = σt
fR = 10GHz, HH (19)
f3 (m) = In
−30◦ ≤ αn ≤ 30◦
where HH represents that the radar wave is horizontally polarized, αn means the observation angle in the normal
observation field, σm is the mean RCS indicator, σt is the tail RCS indicator, In is the infrared radiation intensity
indicator in the normal observation field.
Throughout the overall design process, equation constraints are expressed as follows:
� � � � � � � �
W�f Mie� − W�f M�je = 0 Din� Mie� − Din� Mje� = 0 �
�
L M − Le �Mje �= 0 & L M − Lin �Mje � = 0 (20)
�
e � ie � in � ie �
�
� ∀i , j ∈ {1, 2, ..., k}
Xn Mie − Xn Mje = 0 Xin Mie − Xin Mje = 0 e e
where Wf is the width of the aircraft fuselage, Din is the diameter of the end of the intake pipe, Le is the length of
the engine compartment, Lin represents the length of the air intake, Xn means the x coordinate of the front face
of the nozzle, Xin refers to the x coordinate of the end face of the intake pipe, and k is the number of generations.
The inequality equality constraints can be expressed as:
Scientific Reports | (2021) 11:8251 | https://doi.org/10.1038/s41598-021-87756-0 5
Vol.:(0123456789)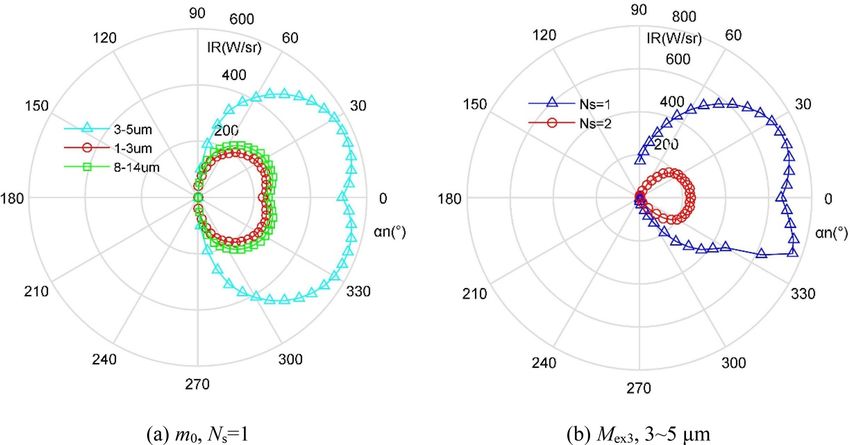
www.nature.com/scientificreports/
iie
− Lf ,max ≤ 0 Dx
Mjie +1
− Dx
Mjie
≤ 0
Lf M
∀iie ∈ {1, 2, ..., k}
Lex Miie − Lex,max ≤ 0
&
Tn Mjie +1 − Tn Mjie ≤ 0
∀jie ∈ {1, 2, ..., k − 1} (21)
where Lf refers to the length of the fuslage, Lex is the length of the exhaust pipe, Lf,max, and Lex,max are the limit
values, Dx is the drag indicator, Tn is the temperature indicator of nozzle face.
When there are optimal solutions for the stealth indicators, the following relationship (COM test20,25) should
be satisfied:
fi (M) ≥ fi (M ∗ )
ind� ∗ �ind
�
� ��
Dx Mjie +1 ≤ Dx Mjie �� ∀iind ∈ {1, 2, 3} (22)
� � � � ∀j ∈ {1, 2, ..., k − 1}
Tn Mj∗ +1 ≤ Tn Mjie
�
ie
ie
When the optimal solution does not exist, that is, these stealth indicators cannot reach the minimum at the
same time, then the Pareto solution needs to be applied:
fi (M ∗ ) ≤ fiind�(M) � �
ind�
Dx Mjie ≥ Dx Mj∗ie +1 �� ∃iind ∈ {1, 2, 3}
� �
� � (23)
� ∃j ∈ {1, 2, ..., k − 1}
Tn Mjie ≥ Tn Mj∗ +1
� �
ie
ie
In order to establish individuals with better stealth performance, a ranking factor can be defined here to
distinguish these feasible solutions in each generation:
(24)
fs jie , iind = rind jie , iind /Nind
N
indc
fr jie = fs jie , iind /Nindc (25)
j=1
where fs(jie, iind) represents the sorting factor of the iind-th stealth indicator of the jie-th individual, Nind is the
number of individuals in the current offspring, rind(jie, iind) indicates the ascending ranking of the iind -th indicator
of the jie -th individual, fr is the ranking factor, Nindc is the number of stealth indicators.
At this time, the optimal solution can be expressed as the individual with the smallest fr:
(26)
M∗ = mjie min fr jie
If the above ranking factor Pareto section is still not unique, the priority is defined to continue to distinguish
these individuals:
pindc (σm ) ≥ pindc (σt ) ≥ pindc (In ) (27)
where pindc is the priority of individual stealth indicator. At this time, priority is given to the individual whose
RCS mean indicator performs better.
Model
The outline design of the aircraft symmetry plane is shown in Fig. 5, where Mex represents the model of the
exhaust port, Bd is the nozzle model with downward blocking, Ns refers to the number of nozzle stages, Bu is a
nozzle model with upward blocking, Hn is the height of the nozzle.
The model of the unmanned aircraft was built as shown in Fig. 6, where Wn is a custom parameter used to
determine the nozzle width, Xv is a custom length parameter used to determine the size of Bd, noting that the
outer edge of Bd is parallel to the tail edge of the aircraft. Xu is the size parameter of Bu. The main geometric size
data of m0 is shown in Table 1, where Hf is the height of the fuselage, Wb is wingspan, Asl is the sweep angle of
wing leading edge, Asn is the sweep angle of nose, Aft is forward sweep angle of the trailing edge of the fuselage.
When the parameters of the exhaust system change, the aircraft model also changes, and the aircraft model here
can be represented by the following parameters or sub-models:
m = {Mex , Ns , Bd , Hn , Wn , Bu } (28)
where the parameters in Eq. (28) are set as variable parameters, the parameters in Eq. (20) are restricted to
constant parameters.
The flow field of the aircraft exhaust system is established as shown in Fig. 7, where high-precision unstruc-
tured grid technology is used to divide the external, central and internal flow field areas. Mesh encryption is
added to surfaces and edges with small dimensions or large curvature changes, including air intakes, exhaust
ports, center body, nozzle pipe, leading and trailing edges of wings. The velocity of the incoming flow in the far
front of the aircraft is set to 85 m/s with the temperature 300 K, while the high-temperature airflow at the nozzle
inlet is set at 870 K. The standard k-ε model is used to solve the Navier-Stocks equation of the exhaust system
flow field. Momentum, density, turbulent kinetic energy, energy and turbulent dissipation rate are discretized
using a second-order upwind scheme.
Scientific Reports | (2021) 11:8251 | https://doi.org/10.1038/s41598-021-87756-0 6
Vol:.(1234567890)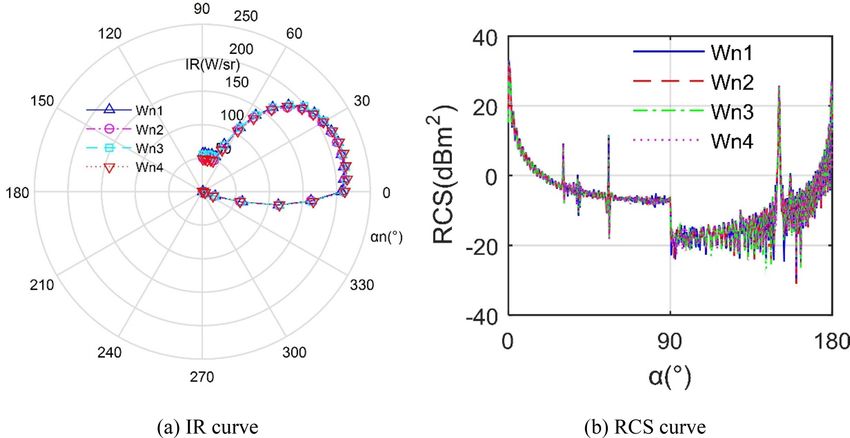
www.nature.com/scientificreports/
Figure 5. Aircraft design draft and parameter variables, drawn using Microsoft Visio 2007.
Figure 6. Three-view display of aircraft geometric model, drawn using Microsoft Visio 2007 and CATIA
V5R20.
Parameter Lf (m) Xn (m) Asl (°) Hf (m) Wb (m)
Value 11.041 -2 30.518 2.082 18.5
Parameter Wn (m) Din (m) Xin (m) Asn (°) Aft (°)
Value 0.8 0.5 2.5 55.717 29.938
Table 1. The main geometric size data of m0.
In order to evaluate the changes in stealth characteristics brought to the aircraft during the design of the
exhaust system, the radar and infrared observation fields are set as shown in Fig. 8, where σm is equal to the mean
RCS in the range of 0° ≤ α ≤ 180°, σt is equal to mean RCS in the range of 150° ≤ α ≤ 180°, In is equal to the mean
value of the IR radiation intensity in the range of –30° ≤ αn ≤ 30°.
Results and discussion
Figure 9 presents that the aircraft’s RCS and RCS mean indicators show great differences under different radar
wave frequencies. When fR is increased from 6 to 10 GHz, the RCS curve is generally consistent, but the local
amplitude slightly increases, which is very obvious in the peaks of the head, side and tail. The increasing speed
of the RCS mean index gradually decreases with the increase of the radar wave frequency. The σm at 2 GHz is
Bm2, and the index at 12 GHz reaches 13.8551 d
only around 7 d Bm2. In order to make the calculation results of
Scientific Reports | (2021) 11:8251 | https://doi.org/10.1038/s41598-021-87756-0 7
Vol.:(0123456789)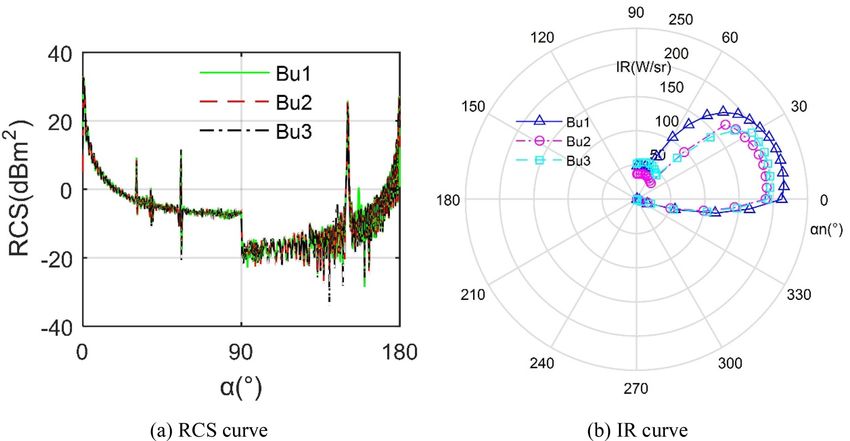
www.nature.com/scientificreports/
Figure 7. Aircraft exhaust system flow field construction and grid division, drawn using Microsoft Visio 2007
and ANSYS ICEM 16.0.
Figure 8. Observation field setting of aircraft radar cross section and IR signature, β = 0°, drawn using
Microsoft Visio 2007 and CATIA V5R20.
the electromagnetic scattering level of the aircraft comparable in the design process, the radar wave frequency
here is set to 10 GHz.
Effects of Mex and Ns. Figure 10 provides that these three exhaust port models have a great influence on the
RCS of the aircraft, where Mex1 uses a simple round pipe, Mex2 uses an oval design, and Mex3 uses a rectangular
nozzle with a triangular upper and lower baffle. It can be seen that the RCS level of Mex3 is lower than the other
two, but it produces a peak of 24.41 dBm2 at 144.5° because Mex3 does not use the arc design of the first two, but
accepts a more concise triangle + large acute angle nozzle, this measure can effectively deflect most radar waves
to non-threatening azimuth. The RCS curves of Mex1 and Mex2 are generally similar, but the peaks and fluctua-
tions in the lateral 92.25° ~ 116.5° are different, where the average RCS of Mex2 curve is 13.1265 dBm2, and that
of Mex3 is 11.6694 dBm2. These results show that the reasonable design of the nozzle can effectively reduce the
average RCS of the aircraft and the peak RCS of certain azimuths.
Figure 11 shows that the IR signatures of aircraft in different bands are very different, and the radiation inten-
sity in the 3 ~ 5 μm band is significantly higher than the other two bands. In order to make the infrared radiation
index results in the entire comprehensive design process comparable, the following IR calculations are performed
in the 3 ~ 5 μm band. For the Mex3, the IR value in the positive observation angle range is significantly larger
than that in the negative observation angle range, because the size of the upper baffle of the nozzle is smaller
than that of the lower baffle, and the effect of blocking the heat source is small. The maximum IR value when
Ns = 1 reaches 756.41 W/sr, while the IR curve at Ns = 2 as a whole is much smaller than the IR curve at Ns = 1,
because at this time the introduction of circular cold air can better surround the high-temperature heat flow
and form a certain isolation and protection, these combined effects greatly reduce the IR performance. These
results show that the nozzle based on the principle of two-stage ejection can significantly improve the infrared
radiation characteristics of the aircraft.
Scientific Reports | (2021) 11:8251 | https://doi.org/10.1038/s41598-021-87756-0 8
Vol:.(1234567890)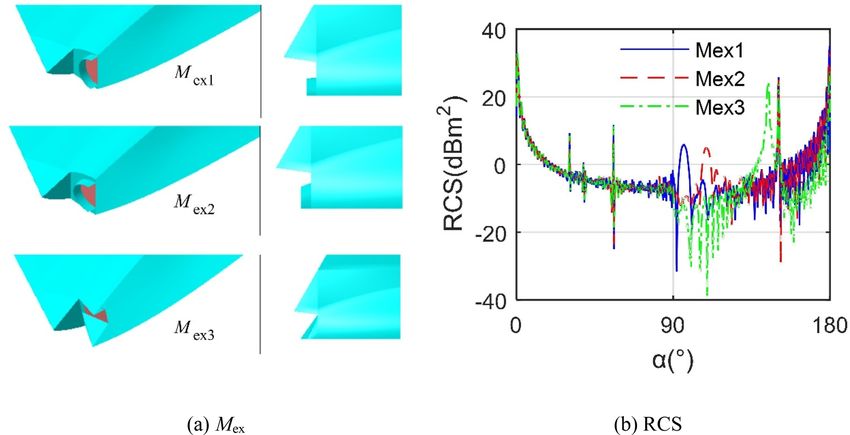
www.nature.com/scientificreports/
Figure 9. RCS of aircraft model under different radar wave frequencies, β = 0°.
Figure 10. RCS of aircraft under different exhaust port models, fR = 10 GHz, β = 0°, drawn using Microsoft Visio
2007 and CATIA V5R20.
Effects of Bd and Hn. Figure 12 provides that the effect of different Mbd models on the stealth performance
of the aircraft is obvious. As the value of Xv increases, the size of the lower baffle of the nozzle becomes larger
and gradually integrates with the aircraft. This design results in a more concise shape of the entire aircraft and a
stable deflection effect on electromagnetic waves, thus the RCS curves of Mbd2, Mbd3, and Mbd4 are very similar.
The RCS curve of Mbd1 has a peak of 24.41 dBm2 at 144.5°, and the last three RCS curves have peaks at 150.5°. For
the IR curves, the IR curve clearly shows an upward contraction trend with the increase of Xv, this is because the
outward extension of the lower baffle effectively blocks the radiation characteristics in the negative observation
angle. As shown in Table 2, the difference between the radar stealth indicators under these four Mbd models is
relatively small, but the IR indicator has a significant decreasing trend with a reduction of 65.5709 W/sr. These
results indicate that the design of Mbd contributes more to the infrared stealth of the aircraft.
Figure 13 indicates that the height of the exhaust port will also have a more obvious impact on the stealth
performance of the aircraft, where Hn1 = 330 mm, Hn2 = 300 mm. For the IR curves, the IR value of Hn1 is obvi-
ously greater than the value of Hn2 except the observation angle is greater than 45°, because reducing the height
of the nozzle can increase the mixing intensity of the hot and cold air flow, which results in the normal infrared
radiation effect of the nozzle being suppressed, but the blocking effect of the upper baffle on the nozzle is slightly
weakened, thus the infrared radiation of the nozzle didn’t weaken much when the observation angle increases
positively. Note that the IR indicator at Hn1 is around 158 W/sr, while that at Hn2 is reduced to 140.0023 W/sr.
The RCS curves under the two Hn are very similar, where the mean indicator here differs by only 0.1285 d Bm2.
Scientific Reports | (2021) 11:8251 | https://doi.org/10.1038/s41598-021-87756-0 9
Vol.:(0123456789)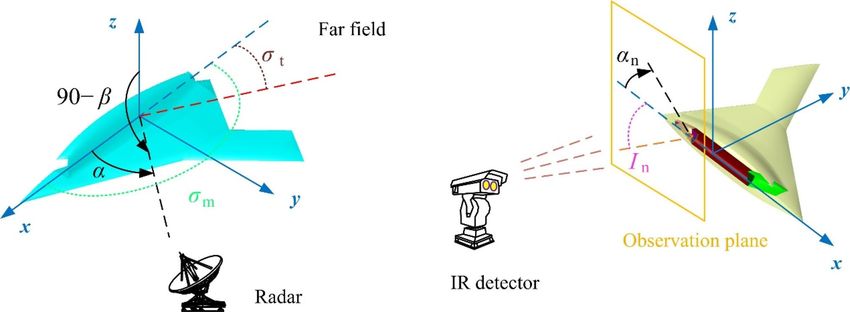
www.nature.com/scientificreports/
Figure 11. Aircraft IR signature under different wave bands and Ns.
Figure 12. Comparison of stealth characteristics of aircraft under different Mbd models.
Mbd 1 2 3 4
Xv (mm) 500 650 850 1150
σm (dBm2) 11.6694 11.0772 11.1147 11.0857
σt (dBm2) 12.3457 12.6437 12.5575 12.5467
In (W/sr) 223.7332 212.3998 187.0830 158.1623
Table 2. Comparison of stealth indicators of aircraft under different Mbd models.
These results indicate that choosing a suitable nozzle height is beneficial to improve the radar/infrared perfor-
mance of the aircraft.
Effects of Wn and Bu. Figure 14 manifests that the difference between RCS and IR curves of aircraft under
different Wn is small. For the IR curves, the values of the four curves are relatively large in the range of 0° ~ 35°,
Scientific Reports | (2021) 11:8251 | https://doi.org/10.1038/s41598-021-87756-0 10
Vol:.(1234567890)www.nature.com/scientificreports/
Figure 13. Effect of exhaust port height on aircraft stealth performance.
Figure 14. Comparison of stealth characteristics of aircraft under different Wn.
exceeding 165.7 W/sr. At this time, the IR of Wn1 and Wn2 is slightly smaller than the other two. Overall, the IR
radiation characteristics at these four Wn values are similar, because the opening width of the nozzle is defined
on the edge of the tail of the aircraft. For the heat flow that is about to leave the tail of the aircraft, the mixing
effect brought by Wn will have little effect on the wall near the outer baffle. For the RCS results, the four curves
are very similar, including shape, maximum value, peak size, peak position and number of fluctuations. In the
range of 90.75° ~ 108.8°, the difference between the four curves is somewhat obvious, because the increase of
Wn reduces the surface area and average height of the side baffle outside the spout, which brings changes to the
lateral electromagnetic scattering characteristics of the aircraft. As shown in Table 3, the results of the various
stealth indicators under different Wn values are very similar, where the maximum difference of the RCS tail indi-
cator is only 0.051 dBm2. These also show that the impact of Wn on the overall stealth performance of the aircraft
is very limited within the given range.
Figure 15 investigates that different Bu parameters will affect the radar and infrared stealth characteristics of
the aircraft, and the impact on the latter is more obvious, where Xu1 = 300 mm, Xu2 = 400 mm and Xu3 = 500 mm.
For the RCS results, the three curves are very similar in shape, and all produce large peaks at 0.25°, 150.5° and
179.8° with the maximum peak reaching 33.04 dBm2. For infrared radiation characteristics, the IR curve of
Bu1 is obviously larger than that of the other two. The IR values of Bu1 and Bu2 are almost equal in the negative
Scientific Reports | (2021) 11:8251 | https://doi.org/10.1038/s41598-021-87756-0 11
Vol.:(0123456789)www.nature.com/scientificreports/
Wn number 1 2 3 4
Wn (mm) 800 850 900 950
σm (dBm2) 10.9572 10.9806 10.9583 10.9544
σt (dBm2) 12.0435 12.0527 12.0426 12.0017
In (W/sr) 140.0023 139.8559 141.4906 141.2781
Table 3. Comparison of stealth indicators of aircraft under different Wn.
Figure 15. Radar/infrared stealth characteristics of aircraft under different Bu.
observation angle range, and the IR result of Bu3 in the positive observation angle range is larger than that of
Bu2, because the size of the upper baffle outside the nozzle increases and extends outward with the increase of
Xu, which is helpful to induce the airflow at the back of the fuselage to flow behind the center of the tail flame.
This is conducive to the mixing of hot and cold airflow to a certain extent, but it also affects the radiation angle
of the tail nozzle. These results indicate that Bu is a non-negligible factor affecting the performance of aircraft
radar and infrared stealth performance.
Comprehensive results discussion. Figure 16 supports that the three stealth indicators have been
improved overall, and the aerodynamic indicator has made a little sacrifice. For the mean RCS of M*, σm gener-
ally maintains a steady downward trend because both ranking factors and priorities are beneficial to this radar
stealth indicator. The tail RCS indicator has been greatly reduced, which is conducive to the rearward stealth of
the exhaust system. As shown in Table 4, σt is reduced from greater than 18 dBm2 to 12.1045 d Bm2, the reduc-
tion is 6.0763 dBm2. This is mainly because of the reasonable choice of exhaust port model and the optimization
of nozzle height. The infrared signature indicator of M* shows a trend of increasing first and then decreasing
sharply. Many factors contributed to this process, including the exhaust port model, nozzle series and lower baf-
fle, where In indicator has been reduced by 430.2313 W/sr. The drag performance of the individual fluctuated
greatly throughout the process with a maximum difference of 1076.172 N, while the Dx indicator of M*increased
by 272.9023 N from 1332.9243 N. Overall, a little drag sacrifice here is also acceptable. These results indicate
that CDM is satisfactory for improving the radar/infrared stealth characteristics of the aircraft’s exhaust system.
The changes in the design parameters or sub-models of the exhaust system are shown in Table 5, where all the
design factors here have been improved under the comprehensive evaluation of CDM. The exhaust port model
changed from a simple round tube to a rectangular design with upper and lower triangular baffles. The nozzle
of the exhaust system was upgraded from single-stage injection to two-stage injection. The size of the upper and
lower baffles, the height and width of the nozzle have also changed. These results indicate that CDM is clearly
effective for the overall design of this aircraft exhaust system.
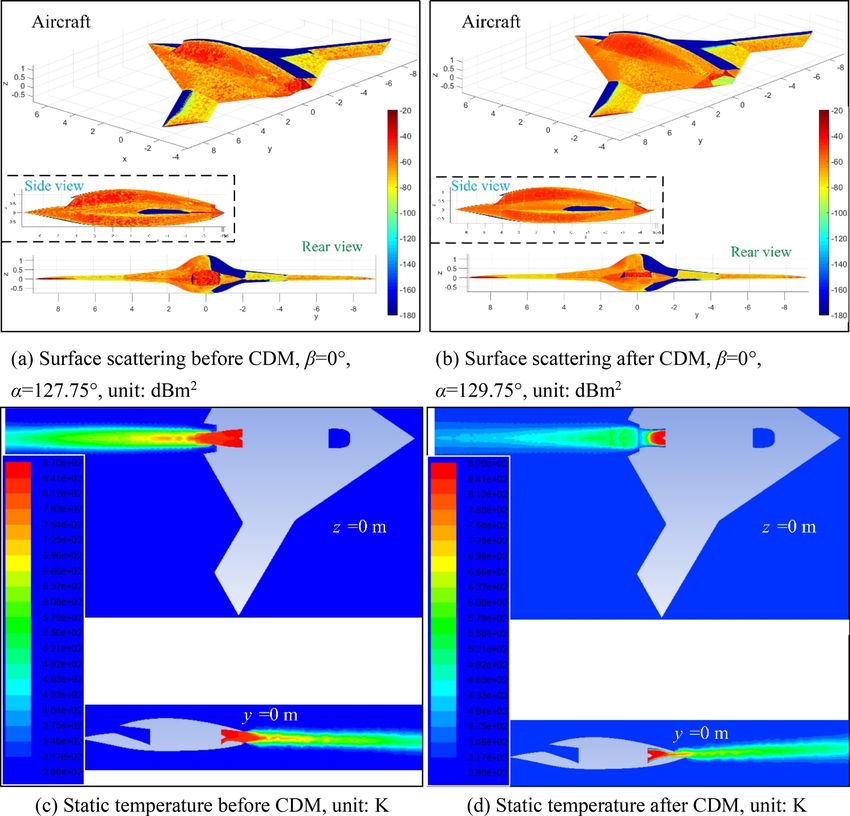
Figure 17 presents that the optimized aircraft model has made significant improvements in surface electro-
magnetic scattering characteristics and plume temperature field. For the Fig. 17a, the cut surface at the tip of the
wing, the wall near the tail nozzle and the upper middle part of the fuselage show the most obvious red under
the current incident wave, because at this time, the angle between the radar wave and the normal direction of
the wing tip is very small, so that the surface here does not have a good ability to deflect the radar wave. The
tail nozzle adopts a conventional round tube design, and the nearby end face and baffle form a strong scattering
Scientific Reports | (2021) 11:8251 | https://doi.org/10.1038/s41598-021-87756-0 12
Vol:.(1234567890)www.nature.com/scientificreports/
Figure 16. History chart of various performance indicators.
σm (dBm2) σt (dBm2) In (W/sr) Dx(N)
m0 13.2120 18.1808 554.3546 1332.9243
M* 10.9492 12.1045 124.1233 1605.8266
Table 4. Aircraft main performance comparison before and after CDM.
Mex Ns Bd(mm) Hn(mm) Wn(mm) Bu(mm)
m0 Mex1 1 Xv = 500 330 800 Xu = 300
M* Mex3 2 Xv = 1150 300 950 Xu = 400
Table 5. Comparison of main design parameters or sub-models of aircraft before and after CDM.
source, that is, a right-angle dihedral angle, which leads to a high RCS level here. For the Fig. 17b, at this time,
the incident azimuth angle of the radar wave has increased by 2°, and the distribution of strong scattering
sources on the surface of the aircraft is still similar compared with the initial model, while the performance of
RCS near the tail nozzle has been obviously changed, because the lower baffle of the nozzle of the optimized
model adopts a shielding design that blends with the curve of the fuselage tail, the baffle on the side of the nozzle
Scientific Reports | (2021) 11:8251 | https://doi.org/10.1038/s41598-021-87756-0 13
Vol.:(0123456789)www.nature.com/scientificreports/
Figure 17. Performance comparison of the aircraft before and after CDM, drawn using Microsoft Visio 2007
and MATLAB 2015A.
does not form a right-angle dihedral angle with the nozzle end surface, the upper baffle is extended from the
surface of the fuselage and cut off with a triangular outer contour, the combined effect of these measures makes
the optimized aircraft model have a good low electromagnetic scattering level. For the Fig. 17c, it can be found
that there is a large-area high-temperature core zone with a temperature range of 696 K ~ 841 K in the tail flame
outside the nozzle of the initial model, where the static temperature of the space in the exhaust nozzle pipe is
basically above 812 K, because the exhaust system at this time uses a single-stage ejection method, which makes
the high-temperature wake jet from the center cone unable to be directly cooled until it reaches the edge of the
nozzle. For the Fig. 17d, it can be noticed that the core area of the plume whose static temperature exceeds 801 K
is confined in the space of the jet pipe, where the static temperature of the tail flame outside the baffle under the
nozzle is basically below 648 K, because the optimized exhaust system has a design based on the principle of
secondary ejection, coupled with the combined effect of nozzle height, outer width, and upper and lower baffles,
the temperature field of the entire aircraft’s tail flame is very popular. These results show that the CDM based on
the Pareto solution of the ranking factor is feasible and effective to improve the electromagnetic scattering and
infrared radiation of this aircraft.
Conclusions
By studying the radar cross-section and infrared radiation characteristics of this aircraft exhaust system, the
relevant parameters and sub-models are fully designed, and the following conclusions can be obtained:
1. The exhaust port model, lower baffle and nozzle height are the main factors affecting the two RCS indicators
of this aircraft model. The design of the upper baffle has a greater impact on the drag indicator than on the
other three indicators.
Scientific Reports | (2021) 11:8251 | https://doi.org/10.1038/s41598-021-87756-0 14
Vol:.(1234567890)www.nature.com/scientificreports/
2. The order that has the greatest influence on the infrared radiation indicator is the nozzle stages, the exhaust
port model, the lower baffle, the nozzle outer width and the nozzle height. For the drag indicator, the order
is the lower baffle, nozzle stages, exhaust port model, nozzle height and nozzle outer width.
3. CDM can effectively improve the radar/infrared stealth performance of the aircraft exhaust system while
sacrificing some aerodynamic drag. This mainly benefits from the Pareto solution based on ranking factors
and priority comparison.
The main contribution of this paper is the presentation of CDM and ranking factors. The former is to improve
the target’s aerodynamic/stealth comprehensive performance, and the latter is to establish relatively good indi-
viduals in the Pareto solution.
Received: 25 December 2020; Accepted: 31 March 2021
References
1. Lozano, F. & Paniagua, G. Airfoil leading edge blowing to control bow shock waves. Sci. Rep. 10(1), 1–18 (2020).
2. Chen, W. J. et al. Experimental investigation of nozzle effects on thrust and inlet pressure of an air-breathing pulse detonation
engine. Chin. J. Aeronaut. 25(3), 381–387 (2012).
3. Zhou, Z., Huang, J. & Wang, J. Radar/infrared integrated stealth optimization design of helicopter engine intake and exhaust
system. Aerosp. Sci. Technol. 95, 105483 (2019).
4. Yan, X. J., Yang, T. & Yao, H. H. Conceptual scheme and key technologies of sixth generation fighters abroad. Aeronaut. Sci. Technol.
29(4), 18–26 (2018).
5. Li, C., Dong, H. & Zhao, K. A balance between aerodynamic and olfactory performance during flight in Drosophila. Nat. Commun.
9(1), 1–8 (2018).
6. Li, M. et al. A gradient-based aero-stealth optimization design method for flying wing aircraft. Aerosp. Sci. Technol. 92, 156–169
(2019).
7. Tan, H. J. & Guo, R. W. Design and wind tunnel study of a top-mounted diverterless inlet. Chin. J. Aeronaut. 17(2), 72–78 (2004).
8. Jiang, H. & Ang, H. S. The Analysis of Aerodynamic and Stealth Characteristic of F-35 Fighter. Aircr. Des. 30(6), 1–10 (2010).
9. Mirkovic, D. et al. Electromagnetic model reliably predicts radar scattering characteristics of airborne organisms. Sci. Rep. 6, 35637
(2016).
10. Ma, Y., Pan, Z. X. & Luo, L. X-47B flying wing aerodynamic configuration analysis. Aeronaut. Sci. Technol. 25(12), 1–4 (2014).
11. Murfitt, S. L. et al. Applications of unmanned aerial vehicles in intertidal reef monitoring. Sci. Rep. 7(1), 1–11 (2017).
12. Yue, K. et al. Numerical simulation of RCS for carrier electronic warfare airplanes. Chin. J. Aeronaut. 28(2), 545–555 (2015).
13. Huang, Z., Jiang, W. & Zhang, Y. Brief introduction to infrared stealth and detection technology of aircraft. Infrared 38(8), 1–7
(2017).
14. Qu, Z. J., Zhang, E. L. & Zhou, F. F. Modeling infrared radiation characteristics for F35 stealth fighter. Infrared Technol. 36(11),
920–925 (2014).
15. Ma, G. J., Zhang, Y. F. & Lai, D. X. Numerical research on infrared radiation of engine exhaust system. Aricraft Des. 35(1), 30–34
(2015).
16. Zhang, Y., Chen, J. & Shen, L. Real-time trajectory planning for UCAV air-to-surface attack using inverse dynamics optimization
method and receding horizon control. Chin. J. Aeronaut. 26(4), 1038–1056 (2013).
17. Jia, Q. L. Numerical calculation of IR radiation for unmanned aerial vehicle. Laser Optoelectron. Prog. 51, 071201 (2014).
18. Li, X. et al. Numerical simulation of infrared characteristics of aero-engine exhaust nozzle. Adv. Aeronaut. Sci. Eng. 4(1), 126–133
(2013).
19. Cheng, W. et al. Infrared signature of serpentine nozzle with engine swirl. Aerosp. Sci. Technol. 86, 794–804 (2019).
20. Zhou, Z. Y., Huang, J. & Yi, M. X. Comprehensive optimization of aerodynamic noise and radar stealth for helicopter rotor based
on Pareto solution. Aerosp. Sci. Technol. 82, 607–619 (2018).
21. Cheng, X. & Sun, M. Wing-kinematics measurement and aerodynamics in a small insect in hovering flight. Sci. Rep. 6, 25706
(2016).
22. Sun, Z. J. et al. Analysis on aerodynamic / stealth synthetical performance of flying wing UAV. Flight Dyn. 36(3), 15–18 (2018).
23. Wang, B. et al. Infrared radiation characteristics calculation and infrared stealth effect analysis of stealth fighter. Trans. Beijing Inst.
Technol. 39(4), 365–371 (2019).
24. Han, J. S. & Han, J. H. A contralateral wing stabilizes a hovering hawkmoth under a lateral gust. Sci. Rep. 9(1), 1–13 (2019).
25. Zhou, Z. Y., Huang, J. & Wu, N. N. Acoustic and radar integrated stealth design for ducted tail rotor based on comprehensive
optimization method. Aerosp. Sci. Technol. 92, 244–257 (2019).
26. Anagnostopoulos, K. A., Charalambopoulos, A. & Fotiadis, D. I. Scattering of electromagnetic spherical waves by a buried sphe-
roidal perfect conductor. Int. J. Eng. Sci. 41(11), 1239–1266 (2003).
27. Zhen, Z. Y. et al. Distributed intelligent self-organized mission planning of multi-UAV for dynamic targets cooperative search-
attack. Chin. J. Aeronaut. 32(12), 2706–2716 (2019).
28. Liu, J. et al. A simulation method of aircraft infrared signature measurement with subscale models. Procedia Comput. Sci. 147,
2–16 (2019).
29. Iemma, U. & Palma, G. Design of metacontinua in the aeroacoustic spacetime. Sci. Rep. 10(1), 18192 (2020).
30. Zhu, H. J., Meng, X. G. & Sun, M. Forward flight stability in a drone-fly. Sci. Rep. 10(1), 1975 (2020).
Author contributions
Z.Z. and J.H. conceived the idea; Z.Z. designed the study and carried out the computational simulations; Z.Z.
and J.H. analyzed the data; Z.Z. wrote the manuscript. All authors reviewed the complete manuscript.
Funding
This work was supported by the project funded by the China Postdoctoral Science Foundation (Grant No.
BX20200035, 2020M680005).
Competing interests
The authors declare no competing interests.
Scientific Reports | (2021) 11:8251 | https://doi.org/10.1038/s41598-021-87756-0 15
Vol.:(0123456789)www.nature.com/scientificreports/
Additional information
Correspondence and requests for materials should be addressed to Z.Y.Z.
Reprints and permissions information is available at www.nature.com/reprints.
Publisher’s note Springer Nature remains neutral with regard to jurisdictional claims in published maps and
institutional affiliations.
Open Access This article is licensed under a Creative Commons Attribution 4.0 International
License, which permits use, sharing, adaptation, distribution and reproduction in any medium or
format, as long as you give appropriate credit to the original author(s) and the source, provide a link to the
Creative Commons licence, and indicate if changes were made. The images or other third party material in this
article are included in the article’s Creative Commons licence, unless indicated otherwise in a credit line to the
material. If material is not included in the article’s Creative Commons licence and your intended use is not
permitted by statutory regulation or exceeds the permitted use, you will need to obtain permission directly from
the copyright holder. To view a copy of this licence, visit http://creativecommons.org/licenses/by/4.0/.
© The Author(s) 2021
Scientific Reports | (2021) 11:8251 | https://doi.org/10.1038/s41598-021-87756-0 16
Vol:.(1234567890)You can also read