JOURNAL Investment - Cantor Fitzgerald
←
→
Page content transcription
If your browser does not render page correctly, please read the page content below

February 2020
Investment
JOURNAL
FEATURED THIS MONTH:
Asset Allocation 2020
Core Equity Portfolio: The investment case for
our preferred names
Core Funds Range: Latest updates on our
range of investment funds, ETFs and Trusts
Ethical Investing: Green Effects providing
sustainable investment returns
StockWatch: Emerging Markets, Engie
R
Cantor Fitzgerald Ireland Ltd Cantor is regulated by the Central Bank of Ireland. Cantor Fitzgerald
Ireland Ltd is a member firm of the Irish Stock Exchange and the London Stock Exchange.
We are part of leading global financial services firm Cantor Fitzgerald

                               FOUNDED IN 1945                                            25 COUNTRIES
                               Cantor Fitzgerald is a firm                                 Cantor and its affiliates employ
                               with significant real estate,                               over 10,000 people in 25
                               capital markets, research                                  countries.
                               and investment expertise.

       Cantor Fitzgerald Ireland
       With a proud history of stockbroking and servicing our private clients and financial advisors in Ireland since 1995, we
       provide a full suite of investment services, primarily in personalised share dealing, pensions and wealth management,
       fund management, debt capital markets and corporate finance. Our clients include private individuals and corporate
       entities, financial institutions, investment funds, credit unions and charities.
       Cantor Fitzgerald Ireland is one of the largest wealth management and stockbroking firms in the country, formed through
       the acquisition of Dolmen Stockbrokers in 2012, L&P Group in 2017 and Merrion Capital Group in 2018.

       DUBLIN: 75 St. Stephen’s Green, Dublin 2. Tel : +353 1 633 3633.
       CORK: 45 South Mall, Cork. Tel: +353 21 422 2122.
       LIMERICK: Theatre Court, Lower Mallow Street, Limerick. Tel: +353 61 436 500.

          Twitter : @cantorIreland     LinkedIn : Cantor Fitzgerald Ireland

       www.cantorfitzgerald.ie

2   CANTOR FITZGERALD IRELAND INVESTMENT JOURNAL FEBRUARY 2020
CONTENTS
      Welcome                                                                          4

      Asset Allocation                                                                 5
      Asset Allocation 2020                                                            6

      Investment Opportunities                                                         9
      Core Portfolio                                                                  10

      Navigating 2020's Investment Challenges                                         12

      Core Investment Funds                                                           16

      Core ETFs & Trusts                                                              18

      Green Effects Fund                                                              20

      Stock Watch:
          Emerging Markets                                                            22

          Engie                                                                       23

      Latest News                                                                    25
      Market Round Up                                                                 26

      Performance Data                                                               27
      Investment Returns                                                              28

      Long Term Investment Returns                                                    29

      Bond Returns                                                                    30

                              CANTOR FITZGERALD IRELAND INVESTMENT JOURNAL FEBRUARY 2020   3
WELCOME...
                           As we move into February the normal question is where did January go? Start of the year still? We are
                           8.5% on the way.

                           A strange month of percentages in markets;              Against the deteriorating macro backdrop some
                           copper is down 10% year to date. Oil is off 15%         companies have continued to outperform, a
                           for the year. US long-dated bonds yield less than       point of focus for our MIM colleagues and high-
                           short dated bonds. The decline in risk assets           lighted by Pramit; the strong are getting stronger.
    Ronan Reid,            globally gathered pace as the deterioration in          Apple, Microsoft, Coca Cola, Amazon, McDonalds
    CEO,
                           the growth outlook became more apparent. With           and Intel were all out with strong beats and sub-
    Cantor Fitzgerald
                           the exception of the S&P which is flat on the           sequent strong share price performance. They
    Ireland
                           year, global equity markets are down on the year        account for over 90% of the small beat in EPS so
                           and have given up most if not all of their Q4 rally.    far.
                           This rally had reflected in part that 2019 was a
                                                                                   Our MIM funds have performed well on both a
                           year of rate cuts; 126 globally and further balance
                                                                                   relative and absolute basis. A broad range of
                           sheet expansion at the Fed, European Central
                                                                                   factors are driving this performance including
                           Bank and Bank of Japan.
                                                                                   stock and sector allocation, tactical trading around
                           Reasons for January declines include a further          key themes of renewables and global payment
                           shut down of all activity in China (oil demand          providers, overweight longer dated Euro/USD
                           alone has fallen 20%, global airlines suspending        bonds as well as diversification into asset classes
                           all flights until March), Chairmen Powell’s reference   such as Gold and Alternative investments which
                           to “elevated asset values”, a Chicago PMI which         have little correlation with the overall market di-
                           highlights the dramatic impact that Boeing issues       rection currently. A challenging backdrop but
                           are having, as well as the realisation of how far       our MIM colleagues are doing well in 2020 after
                           apart the EU and UK are on a trade deal.                a positive 2019.
                           Closer to home two unforeseen events are likely         As we head toward Spring, if you feel it is time
                           to weigh on sentiment for Irish assets. The strong      for your annual financial health check, a member
                           showing of Sinn Fein in the polls would be ex-          of our team would be delighted to talk to you.
                           pected to keep international investors on the
                           side-lines but the January government sale of
                           bonds and recent price actions show it does not         Ronan Reid
                           appear the highest priority. Also the implication       CEO, Cantor Fitzgerald Ireland
                           of the well-publicised write-down and subsequent
                           gating of a number of high profile Irish commercial
                           property funds is likely to weigh on some local
                           risk appetite.

4     CANTOR FITZGERALD IRELAND INVESTMENT JOURNAL FEBRUARY 2020
Asset
 Allocation
                            February 2020

          Asset Allocation 2020                        6

CANTOR FITZGERALD IRELAND INVESTMENT JOURNAL FEBRUARY 2020   5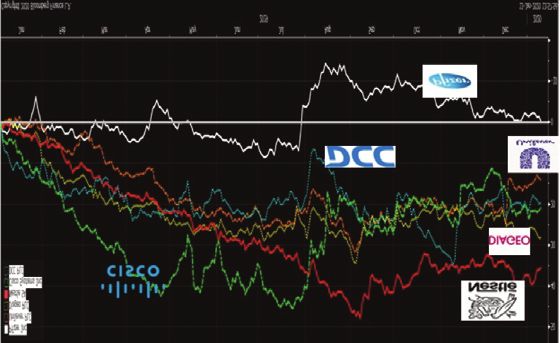
ASSET ALLOCATION

    ASSET ALLOCATION 2020
                                January 2020
                                Global equities ended the month marginally higher (by just 0.2%), having been as much as 2.5% higher
                                in the middle of the month. The New Year began with a continuation of the optimism seen in
                                December, but escalating tensions in the Middle East following the US targeting of a top Iranian official
                                saw equity markets pull back, bond yields move lower and gold move materially higher.
    Pearse MacManus,            The geopolitical tensions however subsided almost as quickly as they came, the US/China trade deal
    Chief Investment Officer,   was finally signed and Britain passed the withdrawal agreement to leave the EU, all of which helped
    Merrion Investment          equity markets higher by mid-month.
    Managers
                                Economic data to start the month also called into question the narrative that a rapid recovery was
                                forthcoming, the US ISM Manufacturing drifting lower from 48.1 to 47.2, along with confirmation of
                                the weakness in the European manufacturing PMIs.
                                Although overall markets were quite strong in the first part of the month, the mix within them was
                                extremely defensive with mega-cap tech, staples and utilities all out performing the broader index.
                                This pattern has been evident for some time and continues despite financial market commentators
                                continuously pointing to supposed economic recovery on the back of great trade progress. If this
                                were the case, the cyclical sectors of the market should not be lagging. We feel this price action is
                                further evidence that the inadvertent response to the Federal Reserve’s decision to expand their
                                balance sheet has driven this rally. We will be watching this trend closely over the next few weeks to
                                see if this source of liquidity for the market has peaked.
                                The second part of the month saw weakness in global equity markets, broadly ascribed to the growing
                                coronavirus scare in China. In particular, the market is concerned about the draconian lock down the
                                authorities have put in place at the most economically sensitive time of year, Chinese New Year.
                                Regardless of how the virus develops, this clampdown on activity will naturally have a severe economic
                                impact, damaging the economic recovery narrative.
                                Global bond yields, copper, oil and iron ore have dropped precipitously on events in China, indicating
                                the growing concerns for global growth. This further delays any evidence of a recovery and could
                                also make it difficult for China to meet its targets in its trade deal with the US. Although we do think
                                this virus is a trigger for a pull-back in what are over-owned, over-valued and over stretched markets
                                we feel it is not the only catalyst. Other events over the latter part of the month are also worth bearing
                                in mind and have the potential to be much longer lasting. In particular, it is no coincidence that the
                                weakness in the markets coincided with the direction of the Federal Reserve’s balance sheet, which
                                saw a small reduction over the second part of the month. Discourse amongst Federal Reserve board
                                members and the wider market has increased over the exact impact of their recent actions. Numerous
                                market commentators are now pointing to the fact, which we have been highlighting for a while, the
                                Fed has inadvertently over stimulated markets beyond its intention.
                                US politics has also taken an unexpected turn. Bernie Sanders, the most left wing of the mainstream
                                candidates has become the leading democratic candidate ahead of the first caucus in Iowa. Although
                                a Sanders presidency is still a far-off prospect, it has become much more likely than people would
                                have thought even a month ago.

                                Outlook
                                An acceleration in growth was priced into equity markets in the first half of 2019, with economic
                                acceleration expected first in H2 2019. When this acceleration didn’t materialise, it was pushed out to
                                Q1 2020. It appears to us that these growth acceleration hopes are likely to be pushed out again due
                                to the corona-virus.

6     CANTOR FITZGERALD IRELAND INVESTMENT JOURNAL FEBRUARY 2020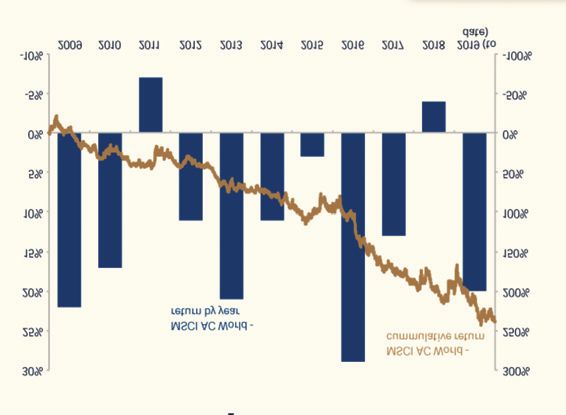
With that consensus expectation for a rapid and sustained improvement in economic growth comes
the consensus outlook for a rapid rebound in earnings. Earnings growth of approximately 10% is
expected for 2020, and looks too optimistic. In the current earnings season, ex some market-exposed
financials and technology, results for industrials and cyclicals have been mixed at best with outlooks
that can be described as hopeful with second-half-weighted recoveries. In absolute terms, earnings
have declined over the last year, leaving the entire gain in equities since end 2018 down to multiple
expansion.
As noted above, one of the key drivers in our view of the most recent move higher in equities was the
provision of liquidity by the Federal Reserve. Whilst the Federal Reserve is likely to keep its balance
sheet large, reliance on repo is likely to fade, the balance sheet will not expand continuously, yet equity
markets appear to have priced an ever-expanding balance sheet.
Ultimately, we are in a low growth, low / zero rate, high risk but highly liquid environment, which means
portfolios should be focused on factors such as high quality, sustainable structural growth, positive
earnings momentum, strong and growing dividends, regulatory tailwinds not headwinds, and insulation
from geopolitical risks. These are the factors which will continue to add value to portfolios over time.

Positioning
We remain close to the lower end of our asset allocation ranges, as concerns about economic growth,
elevated valuations and technically stretched markets encourage a defensive posture.
Within our equity holdings, we sold the residual holdings we had in the oil sector, moving from
underweight to zero. Regulatory headwinds continue to increase for carbon emitters and even despite
the supply shortages from Libya crude is unable to rally. Given how stretched stocks and sectors we
like have become we also reduced our holdings in technology space (back more towards neutral),
adding to some of our holdings in global stock exchanges and to renewable energy holdings in Europe
as the regularity tailwind for this sector continues to grow with the latest iteration of the European’s
Green ambitions.

     WARNING: Past performance is not a reliable guide to future performance. The value of your
                            investment may go down as well as up.

                                      CANTOR FITZGERALD IRELAND INVESTMENT JOURNAL FEBRUARY 2020              7
ASSET ALLOCATION

    ASSET ALLOCATION 2020                                                                                            CONTINUED

                              Merrion Investment Managers Core Funds
                               Name                            Risk Rating (1 - 7)      Sedol             Currency         TER %

                               Merrion Multi-Asset 30 Fund                4           !"#$%&'               EUR             0.68%

                               Merrion Multi-Asset 50 Fund                4           !"#$%%(               EUR             0.68%

                               Merrion Multi-Asset 70 Fund                5            !"#$%)*              EUR             0.68%

                              Merrion Investment Managers Multi-Asset Fund Performance
                              Name                           1 Month %    3 Month %   YTD %      1 Year %      *3 Year %   *5 Year %

                              Merrion Multi Asset 30            1.9           1.9      1.9         8.8               4.0      3.2

                              Merrion Multi Asset 50            2.1           3.2      2.1         12.2              4.6      4.3

                              Merrion Multi Asset 70            2.3           4.6      2.3         16.0              5.6      5.1

                              *Annualised Gross Returns
                              Source: MIM 31/01/2020.

                              The Merrion Multi-Asset (MMA) funds were launched in July 2015. The information includes simulated
                              performance for the MMA funds prior to that date, based on the asset allocation and returns of the
                              Merrion Managed Fund, reweighted for the MMA simulated performance.

                                WARNING: These figures are estimates only. They are not a reliable guide to future performance.

                                   WARNING: Past performance is not a reliable guide to future performance. The value of your
                                                          investment may go down as well as up.

8    CANTOR FITZGERALD IRELAND INVESTMENT JOURNAL FEBRUARY 2020
Investment
Opportunities
February 2020
Core Portfolio 10
Navigating 2020's Investment Challenges 12
Core Investment Funds 16
Core ETFs & Trusts 18
Green Effects Fund 20
Stock Watch:
Emerging Markets 22
Engie 23
CANTOR FITZGERALD IRELAND INVESTMENT JOURNAL FEBRUARY 2020 9DISCRETIONARY STRATEGIES
CORE PORTFOLIO 2020
February 2020
The Cantor Core Portfolio registered a decline of -1.2% during January compared to a decline of -0.2%
for the underlying portfolio benchmark.
During the period there was a continued strong performance by the technology sector which was
reflected in strong gains from our Core Portfolio technology holdings specifically, Alphabet (+8.4%)
and Microsoft (+9.4%). There were also positive performances from French utility group Engie (+8.1%),
David Beaton, US casual dining group McDonalds (+9.7%) after solid fourth-quarter results and French infrastructure
Chief Investment group Vinci (+1.2%).
Officer
Elsewhere in the portfolio there was a positive performance by food group Glanbia (+2.6%) following
weakness during the final quarter of 2019 while reflecting the increased level of market volatility towards
the month-end, the holding in gold producer Newmont Corporation (+5.1%) registered a positive
performance.
These positive performances were however countered by weakness in a number of holdings,
specifically travel & leisure group Carnival (-13.2%) which was negatively impacted by uncertainty over
the coronavirus outbreak.
Related to the uncertainty surrounding the coronavirus was weakness in oil groups Total (-9.1%), Royal
Dutch Shell (-10%), Smurfit Kappa Group (-8.7%) and Fedex (-3.1%) as concerns increased about the
overall impact on global growth of the virus.
Finally, there was weakness in telecoms group BT Group (-15.7%) following a trading update, and Dalata
Hotel Group (-11.4%) as a result of a refocus on Brexit risks ahead of the UK’s departure from the EU at
the end of January.
Following a review of some of the results from our Core Portfolio constituents, we made a number of
changes at the very end of the month.
Within the energy holdings we removed the 3% holding in French oil group Total and reduced the
exposure in Royal Dutch Shell from 5% to 3%. These reductions see us move underweight the energy
sector due to a disappointing results season for the sector, the continued weakness in the underlying
price of crude oil on global growth concerns and the increasingly negative focus on the overall oil
sector as a result of environmental concerns.
Given the increased level of market volatility we increase our exposure to gold through the addition of
3% weighting to a new holding to the portfolio, the Invesco Physical Secured Gold ETF. This ETF is
almost 100% correlated to the underlying gold price and augments our existing exposure to the
commodity though our holding in Newmont Corporation.
The final change to the portfolio sees an increase in exposure to BT Group from 3% to 5%. While the
share price performance to its Q3 results was negative, we see the company's unchanged EBITDA
guidance as positive. Our intention at the outset was to add to BT Group on weakness, assuming that
over the medium term highly rated CEO Philip Jansen (ex Worldpay) will use his private equity
background to turn momentum around and create shareholder value. He is now 12 months into his
role.
10 CANTOR FITZGERALD IRELAND INVESTMENT JOURNAL FEBRUARY 2020Core Portfolio at the 31st January 2020
Price Total Return Fwd P/E Div Yield
Stocks Weightings
31/1/2020 Year to Date FY1 (x) FY1
Alphabet Inc 1432.78 8.4% 22.2x 0.0% 2%
Verizon Communications Inc 59.44 -0.9% 11.7x 4.2% 5%
BT Group* 160.92 -15.7% 7.0x 9.4% 5%
Dalata Hotel Group Plc 4.565 -11.4% 11.6x 2.3% 2%
Amazon.Com Inc 2008.72 10.1% 50.0x 0.0% 4%
McDonald'S Corp 213.97 9.7% 25.2x 2.4% 3%
Carnival 43.53 -13.2% 9.4x 4.7% 3%
Glanbia Plc 10.53 2.6% 11.8x 2.4% 4%
Danone 72.4 -2.0% 19.0x 2.8% 3%
Royal Dutch Shell Plc* 2000 -10.0% 10.2x 7.3% 3%
Allianz Se 215.85 -1.2% 11.7x 4.3% 4%
ING Groep Nv 9.825 -8.1% 7.7x 7.0% 4%
Sanofi 86.95 -3.0% 14.8x 3.6% 3%
Pfizer Inc 37.24 -2.7% 13.4x 4.0% 5%
Vinci Sa 100.2 1.2% 17.2x 2.9% 4%
Siemens Gamesa Renewable Energy 14.405 -7.9% 29.3x 0.5% 3%
DCC Plc 6132 -5.5% 17.4x 2.3% 4%
Fedex Corp 144.64 -3.1% 13.3x 1.8% 3%
SAP Se 117.82 -2.1% 21.9x 1.4% 4%
Paypal Holdings Inc 113.89 6.7% 33.8x 0.0% 4%
Microsoft Corp 170.23 9.4% 30.8x 1.1% 3%
Smurfit Kappa Group Plc 31.28 -8.7% 11.3x 3.3% 3%
Newmont Corp 45.06 5.1% 35.6x 1.8% 3%
Invesco Physical Gold ETC 154 5.6% N/a N/a 3%
Kennedy Wilson Holdings Inc 21.56 -2.0% 11.0x 3.9% 4%
Engie 15.56 8.1% 15.2x 5.0% 5%
Greencoat Renewables Plc 1.215 2.5% 17.4x 5.1% 4%
JPMorgan Emerging Markets Trust 1002.00 -5.1% 18.3x 1.4% 3%
Current Price as at 31/1/2020. Source: Bloomberg. *SIP = Since Inclusion in Portfolio
Cantor Core Portfolio Return -1.2%
Benchmark Return -0.2%
Relative outperformance -1.0%
WARNING: Past performance is not a reliable guide to future performance. The value of your
investment may go down as well as up.
CANTOR FITZGERALD IRELAND INVESTMENT JOURNAL FEBRUARY 2020 11DISCRETIONARY STRATEGIES
NAVIGATING 2020’S
INVESTMENT CHALLENGES
It has been an excellent decade for equity investors, as you can see from the chart below:
Pramit Ghose,
Global Strategist
Source: Refinitiv Datastream as at 29/11/2019.
For any investor who rode out the awful financial crash of 2007-2009 and/or invested in the early part
of the 2010s, they have made substantial gains. In terms of decades, the 2010s was pretty good for
equities, not the best one, but certainly a very strong one.
For many investors who have made these large capital gains, their priority in 2020 is to protect them
while still trying to make money (particularly as € deposit rates are likely to remain at zero or negative
for the next year or two, while yields of high quality European bonds are still negative). There are plenty
of concerns to navigate in 2020. Already we’re seeing Middle East tensions rise, Brexit is moving to the
next, possibly more difficult, phase, and we have the US presidential election, and the more difficult
Phase 2 of the US/China trade talks.
Despite the strong equity markets in recent years, we believe the medium-term outlook for equities
remains reasonably favourable, because of:
- low deposit rates/bond yields forcing investors to look at income yielding assets such as equities
- huge selling of equities by investors in recent years (i.e. many of the bears/sellers have sold)
- benign global growth background
Warning: Past performance is not a reliable guide to future performance. The value of your
investment may go down as well as up.
12 CANTOR FITZGERALD IRELAND INVESTMENT JOURNAL FEBRUARY 2020A strong decade for the S&P
Source: Refinitiv FT Calculations
In particular we believe our Global Equity Income Fund offers investors a common-sense and tried-and-
tested conservative and lower risk way to invest in equities for the 2020s, particularly now after the
strong gains of recent years and when upside gains are likely to be restricted.
Firstly we have been running this strategy successfully since 2000.
Secondly there is an attractive dividend yield of 3.1%.
Thirdly, we believe we can grow the dividend flows by 6% to 8% a year. Why? Because the companies
we select have to pass a number of stringent financial tests to ensure their financial strength, cashflow
strength, and financial capability and management commitment to growing these dividends, no matter
what the financial environment. If we can achieve this dividend growth for the 2020s, then by 2030,
even if there are no capital gains over the decade, the return (gross) would be 44%, and the running
yield on your 2020 initial investment would have climbed to 6%.
Fourthly, which is a similar point to 3 above, we look for boring, “sleep easy at night”, reliable companies
at reasonable valuations with the financial characteristics listed in 3 above….a collection of “tortoises”
that gently but consistently march forward; companies such as Diageo, Unilever, Johnson & Johnson,
Nestlé and Mondelez.
Today, looking forward, that means we have to avoid some of the most fashionable and best momentum
companies, whose shares have performed superbly well recently and are today’s “market darlings” but
whose valuations have reached (and in some cases exceeded) extremely high valuations (and have very
low or zero dividend yields). For example, two shares we used to hold in the Global Equity Income
portfolios, Apple and Microsoft, have been performing very well, even into 2020, but their valuations
have sky-rocketed and their dividend yields have collapsed to about 1%. That doesn’t mean their shares
won’t still do well, but they don’t meet our conservative criteria any more, a huge amount of future
growth is now baked into their valuations, and in our view they are unlikely to repeat the huge share
price appreciation of recent years.
Warning: These figures are an estimate only, they are not a reliable guide to future performance.
Past performance is not a reliable guide to future performance.
CANTOR FITZGERALD IRELAND INVESTMENT JOURNAL FEBRUARY 2020 13We still of course want to invest in longer-term growth areas in companies that meet our criteria. In
Technology we invest in Texas Instruments (high end chips for the increasingly connected world),
Cisco (5G, cybersecurity), Intel (the cloud and the ever-voracious appetite for data centres), and
Accenture (Artificial Intelligence, increasingly digital world). In Healthcare, Danish pharmaceutical
Novo Nordisk is the leading innovator in diabetes and obesity treatments. As we hopefully move closer
to a reasonable US/China trade deal, the Chinese economy should show better growth, which would
help our Asia-exposed holdings - Louis Vuitton (luxury goods), Rio Tinto (mining), Prudential (pensions
and investments), and United Technologies (new buildings via its Carrier [heating and air conditioning]
and Otis [elevators and escalators] businesses).
Interestingly, despite the market strength in 2019 and into early 2020, we can still find a number of
quality companies whose recent updates have slightly disappointed the markets, but where we believe
the longer-term investment case remains strong. These companies have seen their share prices lag in
recent times, offering attractive opportunities to invest/top up.
Source: Bloomberg
But it’s the combination of experience, common sense, diversification, dividend yield and dividend
growth, that makes us believe the Global Equity Income Fund is an excellent investment vehicle to
navigate 2020 (and beyond).
Warning: Past performance is not a reliable guide to future performance. The value of your
investment may go down as well as up.
14 CANTOR FITZGERALD IRELAND INVESTMENT JOURNAL FEBRUARY 2020R
6% INCOME GENERATING INVESTMENT
BLACKWATER RETAIL PARK
Opportunity to invest in Blackwater Retail Park, anchored by Woodie's, a Grafton Group company
KEY FEATURES
• Income yield of 6% per annum
• Secured on a real estate asset with no bank debt
• Long term income profile, underpinned by Grafton Group
• Potential to deliver capital upside from an asset management strategy
• Investment held by a tax efficient, regulated investment fund
• Expected investment term: 5 years
• Minimum investment: €100,000
• Fund is open to qualifying investors only
Warning: The income you get from this investment may go down as well as up, and will fluctuate dependent
on rental income levels and costs.
Warning: This is a high risk investment. The value of your investment may go down as well as up.
You may get back less than you invest.
Warning: If you invest in this product it is anticipated that you will not have any access to your money for
at least a five year period.
For further information or to arrange a meeting, contact:
DUBLIN 01 633 3633 | CORK 021 422 2122 | LIMERICK 061 436 500
www.cantorfitzgerald.ie
Cantor Fitzgerald Ireland Ltd is regulated by the Central Bank of Ireland. Cantor Fitzgerald Ireland Ltd is a member firm of the Irish Stock Exchange and the London Stock Exchange.INVESTMENT OPPORTUNITIES
INVESTMENT FUNDS
Our Core Funds range is a selection of funds that our investment committee feels could compliment
portfolios and enhance diversification. The Core Funds range offers investment options across
multiple asset classes and markets. Funds selected have undergone a comprehensive screening
process by our investment committee and are reviewed regularly.
Niall Sexton,
Core Investment Funds
Portfolio Equity Funds
Construction SEDOL Name
Morningstar
Rating!
Risk Rating (1 - 7) Currency TER % Yield %
Analyst Global Equity Income
B5TRT09 Veritas Global Equity Income
5 EUR 1.13 3.41
Global Equity Income
Merrion Global Equity Income - 5 EUR 0.60 0.00
Global Equity Growth
Fundsmith Global Equity Feeder
5 EUR 1.05 0.55
Global Equity - Ethical Investing
Green Effects
5 EUR 1.28 0.00
European Equity
BFNQYV8 Threadneedle European Select
5 EUR 0.83 0.00
B9MB3P9
UK Equity
B3K76Q9 J O Hambro UK Opportunities
5 GBP 0.82 3.20
US Equity
BYR8HR0 Merian North American Equity
6 EUR 0.89 0.00
Bond Funds
SEDOL Name Risk Rating (1 - 7) Currency TER % Yield %
Corporate Bond
B3D1YW0 PIMCO GIS Global Investment Grade Credit
3 EUR 0.49 3.26
Government Bond
0393238 BNY Mellon Global Bond
4 EUR 0.65 0.00
High Yield
B1P7284 HSBC Euro High Yield Bond
4 EUR 1.35 2.38
Diversified Bond
B39R682 Templeton Global Total Return
4 EUR 1.40 8.77
Alternative Funds
SEDOL Name Risk Rating (1 - 7) Currency TER % Yield %
Multi - Asset Allocation
BD6K5N2 M&G Dynamic Allocation
4 EUR 0.95 0.00
BVFMDG4 Merrion Multi Asset 30 - 4 EUR 0.68 0.00
BVFMDD1 Merrion Multi Asset 50 - 4 EUR 0.68 0.00
BVFMDL9 Merrion Multi Asset 70 - 5 EUR 0.68 0.00
Absolute Return
BH5MDY4 Invesco Global Targeted Return - 3 EUR 0.86 0.00
Source: Bloomberg. Prices as of 31/1/2020..
16 CANTOR FITZGERALD IRELAND INVESTMENT JOURNAL FEBRUARY 2020Fund Performance
Equity Fund Performance
Name 1 Month % 3 Month % YTD % 1 Year % 3 Year % 5 Year %
Global Equity
Veritas Global Equity Income 0.68 3.33 0.68 19.42 8.75 6.96
Global Equity
Merrion Global Equity Income -0.23 2.60 -0.23 14.36 - -
Global Equity Growth
Fundsmith Global Equity Feeder 3.34 7.13 3.34 28.31 17.66 15.19
Global Equity - Ethical Investing
Green Effects 4.48 13.10 4.48 20.29 8.70 8.45
European Equity
Threadneedle European Select 0.31 5.93 0.31 26.89 11.24 7.12
UK Equity
J O Hambro UK Opportunities 0.94 2.01 0.94 8.14 4.35 5.68
US Equity
Merian North American Equity 3.89 8.84 3.89 21.14 9.32 10.02
Bond Fund Performance
Name 1 Month % 3 Month % YTD % 1 Year % 3 Year % 5 Year %
Corporate Bond
PIMCO GIS Global Investment Grade Credit 1.80 1.89 1.80 9.17 3.82 3.01
Government Bond
BNY Mellon Global Bond 3.09 1.80 3.09 11.59 3.49 2.66
High Yield
HSBC Euro High Yield Bond 0.07 1.02 0.07 7.10 3.46 3.36
Diversified Bond
Templeton Global Total Return -0.76 0.75 -0.76 -6.22 -1.91 -1.40
Alternative Fund Performance
Name 1 Month % 3 Month % YTD % 1 Year % 3 Year % 5 Year %
Multi - Asset Allocation
M&G Dynamic Allocation -1.60 1.90 -1.60 5.35 2.52 3.28
Merrion Multi Asset 30 1.90 1.90 1.90 8.80 4.00 3.20
Merrion Multi Asset 50 2.10 3.20 2.10 12.20 4.60 4.30
Merrion Multi Asset 70 2.30 4.60 2.30 16.00 5.60 5.10
Absolute Return
Invesco Global Targeted Return 1.39 2.37 1.39 3.79 -0.10 -0.28
Source: Bloomberg. Prices as of 31/1/2020..
WARNING: Past performance is not a reliable guide to future performance. The value of your
investment may go down as well as up.
CANTOR FITZGERALD IRELAND INVESTMENT JOURNAL FEBRUARY 2020 17INVESTMENT OPPORTUNITIES
ETFs & TRUSTs
Our Core ETF and Investment Trust range is a selection of active and passive collective funds which
are listed on primary exchanges. This range offers a selection of the listed investment options
available across multiple asset classes and markets.
Core ETFs & Trusts
Niall Sexton, Equity ETFs & Trusts
Portfolio Ticker Name SEDOL Currency TER % Yield % UCITS
Construction
Global Equity
Analyst
IQQW iShares MSCI World UCITS ETF B297PF5 EUR 0.50 1.59 Yes
SDGPEX iShares Global STOXX 100 Select Dividend ETF B401VZ2 EUR 0.46 4.19 Yes
European Equity
SX5EEX iShares Euro STOXX 50 ETF 7018910 EUR 0.10 2.90 Yes
SPDR® S&P Euro Dividend Aristocrats UCITS B7KHKP4 EUR 0.30 3.15 Yes
UK Equity
CTY City of London Investment Trust Plc 0199049 GBp 0.44 4.47 No
US Equity
SPY5 SPDR S&P 500 UCITS ETF B6YX5T0 USD 0.09 1.40 Yes
SPDR® S&P U.S. Dividend Aristocrats UCITS ETF B6YX5V2 USD 0.35 2.03 Yes
Emerging Market Equity
JMG JPMorgan Emerging Markets Investment Trust Plc 0341895 GBP 1.02 1.79 No
Bond ETFs & Trusts
Ticker Name SEDOL Currency TER % Yield % UCITS
Corporate Bond
EUNR iShares Euro Corporate Bond Ex-Financials ETF BSKRK39 EUR 0.20 1.09 Yes
Government Bond
EUNH iShares Core Euro Government Bond ETF B4WXJJ6 EUR 0.09 0.62 Yes
High Yield
IHYG iShares Euro High Yield Corporate Bond ETF B66F475 EUR 0.50 3.77 Yes
Commodity ETFs & Trusts
Ticker Name SEDOL Currency TER % Yield % UCITS
Precious Metals
SGLD Invesco Physical Gold ETC B599TV6 USD 0.19 0.00 No
Commodity
OILB ETFS 1 Month Brent ETF B0CTWC0 USD 0.49 0.00 No
Source: Bloomberg. Prices as of 31/1/2020..
18 CANTOR FITZGERALD IRELAND INVESTMENT JOURNAL FEBRUARY 2020Fund Performance
Equity Performance
Name 1 Month % 3 Month % YTD % 1 Year % 3 Year % 5 Year %
Global Equity
iShares MSCI World UCITS ETF 0.18 6.17 0.18 21.60 10.47 9.19
iShares Global STOXX 100 Select Dividend ETF -1.27 2.41 -1.27 13.48 5.49 5.21
European Equity
iShares Euro STOXX 50 ETF -3.27 1.32 -3.27 19.02 7.38 5.00
SPDR® S&P Euro Dividend Aristocrats UCITS -1.89 1.43 -1.89 13.41 7.92 6.65
UK Equity
City of London Investment Trust Plc -3.92 2.68 -3.92 12.41 6.71 5.82
US Equity
SPDR S&P 500 UCITS ETF 1.13 8.07 1.13 26.10 13.45 12.31
SPDR® S&P U.S. Dividend Aristocrats UCITS ETF -1.52 2.33 -1.52 16.99 9.15 10.47
Emerging Market Equity
JPMorgan Emerging Markets Investment Trust Plc -5.83 3.94 -5.83 14.90 14.28 12.01
Bond Performance
Name 1 Month % 3 Month % YTD % 1 Year % 3 Year % 5 Year %
Corporate Bond
iShares Euro Corporate Bond Ex-Financials ETF 1.09 0.79 1.09 6.21 2.82 2.06
Government Bond
iShares Core Euro Government Bond ETF 2.36 0.58 2.36 8.15 4.00 2.41
High Yield
iShares Euro High Yield Corporate Bond ETF -0.38 1.79 -0.38 6.64 3.20 3.23
Commodity Performance
Name 1 Month % 3 Month % YTD % 1 Year % 3 Year % 5 Year %
Precious Metals
Invesco Physical Gold ETC 4.24 4.94 4.24 19.85 9.09 4.21
Commodity
ETFS 1 Month Brent ETF -13.21 -0.82 -13.21 2.14 4.56 -1.68
Source: Bloomberg. Prices as of 31/1/2020..
WARNING: Past performance is not a reliable guide to future performance. The value of your
investment may go down as well as up.
CANTOR FITZGERALD IRELAND INVESTMENT JOURNAL FEBRUARY 2020 19INVESTMENT OPPORTUNITIES
GREEN EFFECTS FUND FACTSHEET
FEBRUARY 2020
Fund Objectives
The objective of the fund is to achieve long term capital growth through a basket of ethically screened stocks. The fund invests in a
wide range of companies with a commitment to either supporting the environment or demonstrating a strong corporate
responsibility ethos. Sectors such as wind energy, recycling, waste management, forestry and water-related businesses all feature
prominently within the fund. The fund can only invest in the constituents of the Natural Stock Index (NAI) which was set up in 1994
and currently consists of 30 global equities.
Key Information GREEN EFFECTS FUND NAV SINCE INCEPTION
Morningstar Rating ★★★
€300
Fund Inception Oct 2000
€250
NAV €248.94
€200
Minimum Investment €5,000
€150
Dealing Frequency Daily
€100
Investment Manager Cantor Fitzgerald Ireland Ltd
€50
Custodian Northern Trust
€0
Administrator Northern Trust
Sales Commission 3%
Source: Cantor Fitzgerald Ireland Ltd Research
TER % 1.24%
Investment Mgt Fee 0.75% ESMA RISK RATING
*Prices as of 31/1/2020
Source: Bloomberg & Cantor Fitzgerald Ireland Ltd Research Lower Risk 1 2 3 4 5 6 7 Higher Risk
Fund & Share Class Information Typically Lower Rewards Typically Higher Rewards
Fund Size €79.6m
LARGEST SECTOR EXPOSURE %
Fund ISIN IE0005895655
Recycling 21.96%
Fund Sedol 0589565 Manufacturing 8.09%
Bloomberg GEFINVL ID Manufacturing Paper 6.76%
Wind Power 6.47%
Domicile Ireland Energy 4.35%
Building-Heavy Construction 4.05%
Structure UCITS Fund Waste/Water Tretmnt 3.59%
Technology 3.53%
Historic Yield 0 1 2 3 4 5 6 7 8 9 10 11 12 13 14 15 16 17 18 19 20 21 22 23 24
*Fund Yield 1.35%
GEOGRAPHIC EXPOSURE %
Fund yield is historic based on full year 2017 dividend
PAN-EUROPE 36.00%
rope
income received. The fund does not distribute income to
AMERICAS 33.53%
icas
investors. All dividend income is reflected within the NAV
EUROPE 15.35%
Asia
price of the fund.
ASIA 14.40%
rope
Australia 0.47%
ralia
Total number of holdings South Africa 0.25%
frica
Number of holdings 30 0 5 10 15 20 25 30 35
Market Capitalisation Exposure CURRENCY EXPOSURE %
Large: > €3bn 60% USD 31.32%
USD
EUR 15.35%
EUR
Medium: €500m - €3bn 37% JPY 14.40%
JPY
Small: < €500m 3% GBP 13.00%
GBP
SEK 7.79%
NOK
NOK 7.75%
SEK
DKK 7.46%
DKK
BRL 2.17%
BRL
0 5 10 15 20 25 30 35
20 CANTOR FITZGERALD IRELAND INVESTMENT JOURNAL FEBRUARY 2020Top 15 Positions Sector Exposure Compared to a Traditional Global
TESLA INC 8.76%
Equity Fund
SMITH & NEPHEW 8.09%
The fund does not invest in banks, oils, mining, metals or large cap technology stocks. From a
SVENSKA CELLULOSA 6.76% performance and relative returns perspective this is something that all investors should bear
TOMRA SYSTEMS 6.72% in mind when considering investing in the fund. The overriding investment theme from a
sectoral perspective remains that of alternative energy, water, waste management and similar
VESTAS 6.47% companies with a strong corporate social responsibility (CSR) focus in both their culture and
ORMAT 4.35% work practices.
MAYR MELNHOF 4.06%
ACCIONA 4.05% Performance As of 31/1/2020.
KURITA 3.59% 1 Month YTD 1 Year 3 Year* 5 Year*
STEELCASE 3.53%
Green Effects 4.5 4.5 20.3 8.7 8.4
KINGFISHER 3.18%
RICOH 3.05% MSCI World € 0.7 0.7 22.4 11.1 10.1
SHIMANO 2.92%
S&P 500 € 1.3 1.3 25.7 13.5 12.8
EAST JAPAN RAILWAY CO. 2.92%
STEICO 2.04% Euro STOXX 50 -2.6 -2.6 19.3 7.7 5.3
Source: Cantor Fitzgerald Ireland Ltd Research
Friends First Stewardship Ethical 1.4 1.4 28.7 13.5 11.0
Fund Sector Exposure vs MSCI World
Sectors GE MSCI New Ireland Ethical Managed -2.4 -2.4 7.9 5.4 6.4
Consumer Discretionary 15% 13%
Source: Cantor Fitzgerald Ireland Ltd Research, Bloomberg and Northern Trust.
Consumer Staples 10% 10%
Energy 0% 6%
Financials 0% 17%
Annual Returns
Health Care 16% 13%
2000 2001 2002 2003 2004 2005 2006 2007 2008 2009
Industrials 33% 11%
2.40% -11.25% -30.00% 9.71% 14.38% 23.95% 22.52% 6.42% -38.47% 31.28%
Information Technology 6% 16%
Telecomunications Services 0% 3% 2010 2011 2012 2013 2014 2015 2016 2017 2018 2019
Open Ended Fund 1% 0%
13.47% -19.61% 16.02% 19.87% 18.42% 15.72% 6.62% 6.8% -5.91% 23.34%
Utilities 7% 3%
Materials 4% 5% 2020
Real Estate 2% 3% 4.50%
Cash 5% 0%
Source: Cantor Fitzgerald Ireland Ltd Research Source: Cantor Fitzgerald Ltd Research, Bloomberg and Northern Trust
email: greeneffects@cantor.com
WARNING: Past performance is not a reliable guide to future performance. The value of your investment may go down as well as up.
CANTOR FITZGERALD IRELAND INVESTMENT JOURNAL FEBRUARY 2020 21INVESTMENT OPPORTUNITIES
STOCKWATCH
Emerging Markets
Historically, companies with higher than average growth trends trade at a higher share valuation than
those with lower growth trends. Logically, there is a high correlation between a region’s GDP growth
and domestic companies’ earnings growth. Considering this, a rational investor could justify paying a
Darren McKinley, valuation premium for emerging market exposure. Currently emerging market valuations, 14x 2020
CFA earnings, look compelling. Assuming the Coronavirus can be contained to a H1 2020 issue, we see
Senior Equity merit in adding strategically to emerging markets in the short term, for long term gains.
Analyst.
A review of the MSCI Emerging Market Index that the US$ may have peaked with the Fed
highlights an index that is still 18% below its expected to be on hold through 2020. A weaker
peak level recorded in 2007 and has been con- dollar and lower energy prices benefit emerging
solidating sideways for over a decade. In contrast, market economies and businesses.
the S&P 500 Index is now trading 135% above
Investors have shunned emerging markets as
its peak recorded in 2008 and European equities
the trade war between USA and China unfolded.
(SXXE) are within touching distance of 2008
Tariffs negatively impacted sales in China and
index levels. At 14x 2020 earnings for the emerg-
interrupted international companies’ supply
ing market index, the comparable metric for
chain. For instance, Caterpillar reported a 14%
the USA is 18x and Europe is 12x.
fall in Asian unit sales in Q3 2019. Now that a
In 2020 consensus expects global growth of phase one deal has been done, we expect
3.2%, up from 3% in 2019. China (+6% YoY), emerging markets to benefit as much, if not
India (+6.3% YoY) and Brazil (+2.2% YoY) are more, than the USA. We wouldn’t be surprised
expected to be the key drivers of global growth to see Caterpillar report 15% growth in unit
in 2020 as the US, Europe, UK and Japan growth sales through Q4 2020. Judging by a recent
rates are expected to stall or slow. We view fund manager survey by Bank of America, other
Emerging Market growth as more structural in investors agree that emerging markets are now
nature whilst a significant portion of developed compelling and have been adding to EM ag-
market growth is more cyclical in nature, albeit gressively in January 2020.
technology is also positively impacting growth
We have been recommending that private
globally. We think there is much more downside
clients add exposure via the JPM EM Investment
risk to cyclical growth as we move toward
Trust. This instrument is a UK listed asset with a
2021/2022 and consensus forecasts imply that
risk weighting of 4. The trust has a 32.8% weight-
G10 growth momentum may have peaked.
ing in China, 20% in India and the balance
2019 was a year of rate cuts (71 rate cuts by 49 spread across other emerging markets. Its top
central banks) and further loosening of monetary holdings include TSMC, HDF, Alibaba, Tencent
policy, including balance sheet expansion at and AIA. Please ask your portfolio manager for
the Fed, ECB and BOJ. Expectations are now further information and the KID document.
JPM EM INVESTMENT TRUST 1-YEAR SHARE PRICE
Source: Bloomberg 28/01/2020
22 CANTOR FITZGERALD IRELAND INVESTMENT JOURNAL FEBRUARY 2020Engie
Engie is a global energy and services utility company that operates in three core sectors, low
carbon electricity generation (predominately renewables and natural gas), energy infrastructures
and customer solutions.
Pierce Byrne, CFA
Investment Analyst The energy infrastructure segment, known perspective the utility sector offers stability
as the Networks division, represents c.45% of through consistent cash flow generation
the company. This segment includes LNG re- throughout the business cycle. Considering
gasification, natural gas storage and transport, the deterioration in macroeconomic data in
and electricity and natural gas distribution. FY19, falling earnings growth and other global
The Networks business offers cash flow pre- tensions the utility space is well positioned
dictability through long term government to outperform. Secondly, Engie possesses a
contracts. The Low Carbon Power Generation, significant yield of 5.5%. This is particularly at-
which represents 34% of the business, com- tractive given falling rates globally and a con-
prises of renewables power generation, thermal tinued dovish outlook from central banks. Ex-
power generation and nuclear power gener- pectations are for this dividend to grow by
ation. Engie has transformed its power gen- 5% annually. Thirdly, at its recent capital
eration business to low CO2 generation, re- markets day management outlined its medi-
sulting in 56% less CO2 emissions in 2018 um-term targets which includes 7%-9% re-
compared to 2012. Its renewables segment curring net income CAGR for the next three
(c.23% of group EBIT) generated 24 GW of years. This is particularly impressive given it
power last year. Engie expects to add c.9GW plans €6bn worth of disposals over the same
by 2021, bringing the total generation through period. A key driver of its medium-term growth
renewables to c.33GW. The Client Solutions, is renewable power generation and infras-
which represents 25% of the business, com- tructure. As mentioned, it expects to add
prises of a variety of energy services offered 9GW of wind and solar of wind and solar ca-
to businesses, consumers and territories. The pacity over the next three years (+112%). This
client solutions segments is diverse, supplying is important given the shift to cleaner fuel.
30,000 clients across public buildings and in- Along with this, it offers low carbon generation
frastructure (€6bn revenue 2018), private build- through gas. Finally, its relatively cheap. From
ings (€4.3bn), industries (€6bn) and collective a 12m forward P/E (13.5x) perspective its
housing (€2.2bn). trading in line with its historical average, a
30% discount to Iberdrola (peer) and a 13%
There are several reasons to be positive on
discount to Enel (peer).
the stock at present. Firstly, from a top down
ENGIE 1-YEAR SHARE PRICE
Source: Bloomberg 30/01/2020
CANTOR FITZGERALD IRELAND INVESTMENT JOURNAL FEBRUARY 2020 23R
QUARTERLY MARKETS
UPDATE
DUBLIN | Thursday, 27th February 2020 | 12.45 - 1.45pm
This February we will host our Quarterly Markets Update for our private clients, over a
light lunch. We will share our thinking on markets for the year ahead, with a particular
focus on pensions and managing your investments pre and post retirement.
REGISTER YOUR INTEREST BY FRIDAY, 14th FEBRUARY
If you are a client of Cantor Fitzgerald, please email EventsIreland@Cantor.com with your account
number for reference
If you are interested in attending but are not yet a client, please indicate this in your email and we can
put you in contact with one of our advisors
www.cantorfitzgerald.ie
Twitter : @cantorIreland LinkedIn : Cantor Fitzgerald Ireland
Cantor Fitzgerald Ireland Ltd is regulated by the Central Bank of Ireland. Cantor Fitzgerald Ireland Ltd is a member firm of the Irish Stock Exchange and the London Stock Exchange.Latest News
February 2020
Market Round Up 26
CANTOR FITZGERALD IRELAND INVESTMENT JOURNAL FEBRUARY 2020 25LATEST NEWS
MARKET ROUND-UP
Ed Murray, Senior Portfolio Manager
JANUARY 2020
Coronavirus – an interruption NEWS IN BRIEF...
to the narrative?
Australia Day – Australians dominate
world golf
What are the chances on Australia Day
Markets look stretched on fundamental valuations, trading at premiums to long term that we see two Aussies, Lucas Herbert
averages. Technically they also look overbought on the charts and this epidemic could win the European Tour event in Dubai
be the catalyst or excuse for a pullback. The lockdown in Wuhan combined with travel while on the far side of the world Marc
restrictions will certainly hit Asian activity, if we look back to the SARS outbreak in 2003. Leishman win the Farmers Insurance
Chinese GDP slowed from ~10% quarter on quarter pre SARS to 3.5% during the event in Torey Pines, San Diego.
outbreak and then rebounded to about 13%. The sectors most impacted were tourism,
retail and transport. At the end of January we are seeing no different, the big gaming
resorts like Wynn’s and Las Vegas Sands have been hit. The cruise liners and airlines
are all lower, in the luxury space the likes of LVMH and in the consumer end, Starbucks
have closed 50% of its c.4,300 stores across China, while reducing opening hours in
the remaining stores. Weakness was seen across most commodity sectors, undoing
much of the positive sentiment from the signing of the US-China trade. Oil slipped on
the prospect of a fall-off in Chinese demand for the commodity. Likewise the mining
stocks were weaker. What the impact will be is the unknown. Does this become a
global pandemic impacting global economies, many of which are fragile and reliant
on Central Bank support?
Over the past decade, the assets which rose in value at least 70% of the time when
stocks suffer major drawdowns due to growth or policy shocks are US Treasuries, Gold Kobe Bryant – RIP
and the Yen. If one believes this is an acute event like SARS, then any shakeout in the
markets could offer a good entry point into the sectors mentioned above but also
into the tech/growth sectors, that may sell off aggressively in the short term on
overstretched valuations, but offer a sustainable long term investment opportunity
for one’s portfolio.
The chart below highlights some of the moves back in 2003 during the SARS outbreak.
MARKET ROUNDUP
Slán leat a chara
The UK our closest trading partner and
ally in Europe departs the union. While
they are officially gone, the gamesman-
ship kicks off as we knuckle down to iron
out a new trade deal between the Euro-
pean Union and the UK. Thankfully we
have a good Irish man at the negotiating
Source: Bloomberg 30/01/2020.
table in Phil Hogan.
26 CANTOR FITZGERALD IRELAND INVESTMENT JOURNAL FEBRUARY 2020Performance
DATA
February 2020
Investment Returns 28
Long Term Investment Returns 29
Bond Returns 30
CANTOR FITZGERALD IRELAND INVESTMENT JOURNAL FEBRUARY 2020 27PERFORMANCE DATA
INVESTMENT RETURNS
Equities
Index 31/12/19 31/01/20 % Change % ytd Change 52 Week High Date
ISEQ 7183.41 6998.2 -2.6% -2.6% 7,386 10/01/2020
FTSE 7542.44 7286.01 -3.4% -3.4% 7,727 30/07/2019
DAX 13249.01 12981.97 -2.0% -2.0% 13,640 22/01/2020
Eurostoxx50 3745.15 3640.91 -2.8% -2.8% 3,814 17/01/2020
Stoxx600 (Europe) 415.84 410.71 -1.2% -1.2% 425 24/01/2020
Nasdaq (100) 8733.073 8991.512 3.0% 3.0% 9,272 24/01/2020
Dow Jones 28538.44 28256.03 -1.0% -1.0% 29,374 17/01/2020
S&P500 3230.78 3225.52 -0.2% -0.2% 3,338 22/01/2020
Nikkei 23656.62 23205.18 -1.9% -1.9% 24,116 17/01/2020
Hang Seng 28189.75 26312.63 -6.7% -6.7% 30,280 15/04/2019
China (Shanghai Composite) 3050.124 2976.528 -2.4% -2.4% 3,288 08/04/2019
India 41253.74 40723.49 -1.3% -1.3% 42,274 20/01/2020
MSCI World Index 2358.47 2342.41 -0.7% -0.7% 2,419 22/01/2020
MSCI BRIC Index 339.99 324.87 -4.4% -4.4% 354 20/01/2020
Currencies
Currency Pair % Change % ytd Change 52 Week High Date
EuroUSD 1.1213 1.1093 -1.1% -1.1% 1.1448 20/03/2019
EuroGBP 0.84593 0.84 -0.7% -0.7% 0.9325 12/08/2019
GBP/USD 1.3257 1.3206 -0.4% -0.4% 1.3514 13/12/2019
Euro/AUD 1.59713 1.65798 3.8% 3.8% 1.6787 07/08/2019
Euro/CAD 1.45668 1.46822 0.8% 0.8% 1.5223 06/03/2019
Euro/JPY 121.77 120.17 -1.3% -1.3% 127.5000 01/03/2019
Euro/CHF 1.08559 1.06888 -1.5% -1.5% 1.1477 23/04/2019
Euro/HKD 8.7323 8.6156 -1.3% -1.3% 8.9866 20/03/2019
Euro/CNY 7.8149 7.6577 -2.0% -2.0% 7.9712 26/08/2019
Euro/INR (India) 80.0858 78.7401 -1.7% -1.7% 82.1114 05/02/2019
Euro/IDR (Indonesia) 15553.76 15050.07 -3.2% -3.2% 16,254.5600 14/05/2019
AUD/USD 0.7021 0.6692 -4.7% -4.7% 0.7265 05/02/2019
USD/JPY 108.61 108.35 -0.2% -0.2% 112.4000 24/04/2019
US Dollar Index 96.389 97.39 1.0% 1.0% 99.6670 01/10/2019
Commodities
Commodity % Change % ytd Change 52 Week High Date
Oil (Crude) 61.06 51.56 -15.6% -15.6% 65.40 08/01/2020
Oil (Brent) 66 58.16 -11.9% -11.9% 75.60 25/04/2019
Gold 1517.27 1589.16 4.7% 4.7% 1,611.42 08/01/2020
Silver 17.8523 18.0425 1.1% 1.1% 19.65 04/09/2019
Copper 279.7 251.7 -10.0% -10.0% 302.05 17/04/2019
CRB Commodity Index 401.58 404.17 0.6% 0.6% 427.50 04/04/2019
DJUBS Grains Index 29.275 28.0265 -4.3% -4.3% 32.38 17/06/2019
Gas 2.189 1.841 -15.9% -15.9% 2.91 26/02/2019
Wheat 558.75 553.75 -0.9% -0.9% 592.50 22/01/2020
Corn 387.75 381.25 -1.7% -1.7% 476.00 18/06/2019
Bonds
Issuer Yield Change % ytd Change 52 Week High Date
Irish 5yr -0.312 -0.328 -0.02 -158.9% 0.29 13/02/2019
Irish 10yr 0.119 -0.144 -0.26 -52.8% 0.93 05/02/2019
German 2yr -0.601 -0.67 -0.07 8.0% -0.49 05/03/2019
German 5yr -0.473 -0.642 -0.17 85.9% 0.76 22/02/2019
German 10yr -0.185 -0.434 -0.25 -183.5% 0.21 01/03/2019
UK 2yr 0.545 0.504 -0.04 -20.2% 0.85 27/02/2019
UK 5yr 0.601 0.412 -0.19 -29.5% 1.03 28/02/2019
UK 10yr 0.822 0.524 -0.30 -30.6% 1.33 01/03/2019
US 2yr 1.5691 1.3132 -0.26 -22.7% 2.56 05/03/2019
US 5yr 1.691 1.3134 -0.38 -23.9% 2.57 04/03/2019
US 10yr 1.9175 1.5068 -0.41 -20.8% 2.77 01/03/2019
Source for all tables above: Bloomberg and Cantor Fitzgerald Ireland Ltd Research.
28 CANTOR FITZGERALD IRELAND INVESTMENT JOURNAL FEBRUARY 2020PERFORMANCE DATA
LONG TERM INVESTMENT RETURNS
Asset Class Performances (returns in Local Currency)
Equities
2007 2008 2009 2010 2011 2012 2013 2014 2015 2016 2017 2018 2019 2020
MSCI World Index 9.8% -40.2% 30.9% 12.5% -4.9% 16.7% 27.5% 2.9% -1.9% 5.3% 20.11% -10.44% 25.19% -0.68%
MSCI Emerging Market Index 39.7% -53.1% 78.7% 19.4% -18.2% 18.7% -2.3% -4.6% -17.2% 8.6% 34.35% -16.58% 15.38% -4.69%
China 98.0% -64.9% 82.6% -12.8% -20.2% 5.8% -3.9% 52.9% 10.5% -12.3% 6.56% -24.59% 22.30% -2.41%
Japan -10.0% -41.1% 21.1% -1.3% -15.6% 25.6% 59.4% 7.1% 9.1% 0.4% 19.10% -12.08% 18.20% -1.91%
India 48.8% -51.8% 78.5% 19.1% -23.6% 28.0% 9.8% 30.1% -5.6% 1.8% 27.91% 6.67% 13.79% -1.41%
S&P500 5.6% -37.0% 26.4% 15.1% 2.1% 16.0% 32.4% 11.4% 0.2% 9.5% 19.42% -6.24% 28.88% -0.16%
Eurostoxx50 10.4% -41.8% 27.0% -1.8% -13.1% 19.6% 22.7% 1.2% 4.5% 0.7% 6.49% -14.34% 24.78% -2.78%
DAX 22.3% -40.4% 23.8% 16.1% -14.7% 29.1% 25.5% 2.7% 9.6% 6.9% 12.51% -18.26% 25.48% -2.02%
ISEQ -24.7% -65.1% 29.8% -0.1% 2.6% 20.4% 35.7% 15.1% 31.2% -4.0% 7.99% -22.14% 31.09% -2.58%
Commodities
2007 2008 2009 2010 2011 2012 2013 2014 2015 2016 2017 2018 2019 2020
Gold 31.3% 5.5% 24.0% 29.7% 10.2% 7.0% -28.3% -1.5% -10.5% 8.6% 13.68% -2.14% 18.87% 3.93%
Brent Oil 54.2% -51.4% 70.9% 21.6% 13.3% 3.5% -0.3% -48.3% -36.4% 52.4% 17.69% -19.55% 22.68% -11.88%
Crude Oil 57.2% -53.5% 77.9% 15.1% 8.2% -7.1% 7.2% -45.9% -31.3% 45.0% 12.47% -24.84% 34.46% -15.56%
Copper 5.9% -53.6% 137.3% 32.9% -22.7% 6.3% -7.0% -16.8% -24.0% 17.4% 31.73% -20.28% 6.31% -10.01%
Silver 15.4% -23.8% 49.3% 83.7% -9.8% 8.2% -35.9% -19.5% -11.3% 15.8% 7.23% -9.36% 15.32% 0.51%
CRB Commodity Index 14.1% -23.8% 33.7% 23.6% -7.4% 0.4% -5.7% -4.1% -14.6% 12.9% 2.19% -5.36% -1.86% 0.65%
Currencies
2007 2008 2009 2010 2011 2012 2013 2014 2015 2016 2017 2018 2019 2020
Euro/USD 10.5% -4.3% 2.0% -6.6% -3.2% 1.8% 4.1% -12.1% -9.7% -3.1% 14.15% -4.54% -2.20% -1.06%
Euro/GBP 9.1% 30.0% -7.2% -3.3% -2.8% -2.6% 2.2% -6.5% -5.0% 15.7% 4.05% 1.17% -5.88% -0.74%
GBP/USD 1.3% -26.5% 10.2% -3.3% -0.4% 4.6% 1.9% -6.0% -4.9% -16.3% 9.51% -5.55% 4.06% -0.36%
US Dollar Index -8.3% 6.1% -4.2% 1.5% 1.5% -0.5% 0.4% 12.7% 8.9% 3.6% -9.87% 4.26% 0.32% 0.98%
Source for all tables above: Bloomberg and Cantor Fitzgerald Ireland Ltd Research
Warning: Past performance is not a reliable guide to future performance.
CANTOR FITZGERALD IRELAND INVESTMENT JOURNAL FEBRUARY 2020 29PERFORMANCE DATA
INDICATIVE PERFORMANCE FIGURES &
MATURITY DATES FEBRUARY 2020
Cantor Fitzgerald Capital Protected Products
Cantor Fitzgerald Capital Protected Products Underlying Indicative Indicative Indicative Option A Option B Option A Option B
Asset Initial Current Underlying Asset Participation Participation Indicative Indicative
(Ticker) Strike Level Performance Rate Rate Performance Performance
EUROSTOXX 50 DOUBLE GROWTH NOTE* SX5E 2986.73 3647.53 22.12% 200% 30.00% N/a
US $ Dividend Aristocrats Bond III SPXD8UE 2255.84 2341.47 3.80% 100% 220% 3.80% 8.35%
US $ Dividend Aristocrats Bond IV SPXD8UE 2206.04 2341.47 6.14% 80% 200% 4.91% 12.28%
US $ Dividend Aristocrats Bond V SPXD8UE 2336.40 2341.47 0.22% 50% 170% 0.11% 0.37%
US $ Dividend Aristocrats Bond VI SPXD8UE 2357.33 2341.47 -0.67% 50% 140% 0.00% 0.00%
PROTECTED ABSOLUTE RETURN STRATEGIES* SLGLARA 12.05 12.00 -0.47%
CARMPAT 615.33 645.66 4.93%
ETAKTVE 128.74 142.03 10.32%
Weighted Basket 4.93% 120% 5.91% N/a
GLOBAL REAL RETURN NOTE* BNGRRAE 1.27 1.38 8.17% 150% 12.26% N/a
PROTECTED MOMENTUM BOND* MSQTDFAA 1.46 1.52 3.63% 200% 7.26% N/a
PROTECTED MOMENTUM BOND II* MSQTDFAA 1.46 1.52 3.55% 200% 7.10% N/a
PROTECTED MOMENTUM BOND III* MSQTDFAA 1.52 1.52 0.00% 200% 0.00% N/a
PROTECTED BEST SELECT BOND* SGMDBSFE 155.51 156.20 0.44% 200% 0.88% N/a
PROTECTED BEST SELECT BOND II* SGMDBSFE 152.86 156.20 2.19% 200% 4.37% N/a
PROTECTED BEST SELECT BOND III* SGMDBSFE 151.87 156.20 2.85% 200% 5.70% N/a
PROTECTED BEST SELECT BOND IV* SGMDBSFE 148.10 156.20 5.47% 200% 10.93% N/a
PROTECTED BEST SELECT BOND V* SGMDBSFE 143.95 156.20 8.51% 200% 17.02% N/a
PROTECTED BEST SELECT BOND 6* SGMDBSFE 148.01 156.20 5.53% 200% 11.07% N/a
PROTECTED BEST SELECT BOND 7* SGMDBSFE 149.98 156.20 4.14% 200% 8.29% N/a
PROTECTED BEST SELECT BOND 8* SGMDBSFE 147.95 156.20 5.57% 200% 11.15% N/a
PROTECTED BEST SELECT BOND 9* SGMDBSFE 150.42 156.20 3.84% 180% 6.91% N/a
PROTECTED STAR PERFOMERS BOND* BNPIAFST 130.53 140.96 7.99% 180% 14.39% N/a
PROTECTED STAR PERFOMERS BOND II* BNPIAFST 130.91 140.96 7.68% 170% 13.05% N/a
PROTECTED STAR PERFOMERS BOND III* BNPIAFST 133.58 140.96 5.53% 170% 9.39% N/a
PROTECTED STAR PERFOMERS BOND IV* BNPIA2MT 166.28 172.57 3.78% 200% 7.56% N/a
PROTECTED STAR PERFOMERS BOND V* BNPIA2MT 165.75 172.57 4.12% 200% 8.23% N/a
PROTECTED STAR PERFOMERS BOND VI* BNPIA2MT 166.02 172.57 3.95% 200% 7.89% N/a
PROTECTED STAR PERFOMERS BOND 7* BNPIA2MT 168.56 172.57 2.38% 200% 4.76% N/a
PROTECTED STAR PERFOMERS BOND 8* BNPIA2MT 168.78 172.57 2.25% 200% 4.49% N/a
PROTECTED STAR PERFOMERS BOND 9* BNPIA2MT 168.28 172.57 2.55% 200% 5.09% N/a
Strike and Maturity Dates for Cantor Fitzgerald Bonds:
Bond Strike Date Maturity Date
Protected Absolute Return Strategies 24/03/16 31/03/21
US $ Dividend Aristocrats Bond III 26/03/18 06/03/23
US $ Dividend Aristocrats Bond IV 31/05/19 08/05/23
US $ Dividend Aristocrats Bond V 26/07/19 03/05/23
US $ Dividend Aristocrats Bond VI 22/11/19 29/10/24
EuroSTOXX 50 Double Growth Note 24/03/16 09/04/21
Global Real Return Note 29/04/16 12/07/21
Protected Momentum Bond 27/09/19 27/09/24
Protected Momentum Bond II 22/11/19 06/12/24
Protected Momentum Bond III 24/04/20 31/01/25
Protected Best Select Bond 15/06/18 22/06/23
Protected Best Select Bond II 14/08/18 21/08/23
Protected Best Select Bond III 26/09/18 03/10/23
Protected Best Select Bond IV 02/11/18 09/11/23
Protected Best Select Bond V 21/12/18 02/01/24
Protected Best Select Bond 6 27/02/19 05/03/24
Protected Best Select Bond 7 23/04/19 30/04/24
Protected Best Select Bond 8 14/06/19 21/06/24
Protected Best Select Bond 9 16/08/19 23/08/24
Protected Star Performers Bond 27/09/16 30/09/22
Protected Star Performers Bond II 16/12/16 21/12/22
Protected Star Performers Bond III 16/03/17 22/03/22
Protected Star Performers Bond IV 24/05/17 30/05/22
Protected Star Performers BondV 26/07/17 02/08/22
Protected Star Performers BondVI 20/09/17 27/09/22
Protected Star Performers Bond 7 24/11/17 01/12/22
Protected Star Performers Bond 8 21/12/17 28/12/22
Protected Star Performers Bond 9 09/03/18 16/03/23
Source for all tables above: Bloomberg.
30 CANTOR FITZGERALD IRELAND INVESTMENT JOURNAL FEBRUARY 2020Cantor Fitzgerald Kick Out Notes
Cantor Fitzgerald Bond Issue Underlying Indicative Indicative Indicative
Asset Initial Current Underlying Asset Indicative
(Ticker) Strike Level Performance Performance
REAL ESTATE KICKOUT NOTE* SPG 190.52 133.15 -30.11% Next Potential Coupon 90%
URW 233.60 123.15 -47.28%
DLR 74.80 122.99 64.43%
WELL 65.25 84.91 30.13% 0%
BRAND LEADERS KICKOUT BOND* BAS 79.09 60.88 -23.02% Next Potential Coupon 13.5%
RYA 13.49 15.51 15.02%
SAMSUNG 44800 57200 27.68%
FP 53.21 43.98 -17.35% 0%
BRAND LEADERS KICKOUT BOND II* ML 89.60 105.20 17.41% Next Potential Coupon 13.5%
RYA 12.59 15.51 23.19%
SAMSUNG 43800 57200 30.59%
RDSA NA 27.79 23.38 -15.85% 0.0%
BRAND LEADERS KICKOUT BOND III* CRH 22.38 33.93 51.61% Next Potential Coupon 11.0%
ML 84.50 105.20 24.50%
FP 46.05 43.98 -4.48%
BAS 60.72 60.88 0.26% 11%
EURO BLUE CHIP KICKOUT BOND III* ITX 31.50 30.34 -3.69% Next Potential Coupon 30.0%
BN 62.79 72.66 15.72%
ADS 183.05 282.70 54.44%
CRH 32.82 33.93 3.38% 30.0%
EURO BLUE CHIP KICKOUT BOND IV* BMW 86.69 64.12 -26.04% Next Potential Coupon 27.0%
FP 48.70 43.98 -9.69%
ADS 177.25 282.70 59.49%
CRH 33.56 33.93 1.10% 0%
EURO BLUE CHIP KICKOUT BOND V* ADS 199.95 282.70 41.39% Next Potential Coupon 22.5%
ABI 102.15 67.83 -33.60%
BAYN 107.00 73.43 -31.37%
FP 43.92 43.98 0.14% 0%
OIL & GAS KICK OUT IV RDSA 26.98 23.38 -13.34% Next Potential Coupon 10%
FP 50.33 43.98 -12.62%
BP/ 5.34 4.58 -14.28%
XOM 79.01 62.12 -21.38% 0%
OIL & GAS KICK OUT V RDSA 28.98 23.38 -19.32% Next Potential Coupon 10%
FP 49.12 43.98 -10.46%
BP/ 5.56 4.58 -17.66%
XOM 77.69 62.12 -20.04% 0%
IRISH KICK OUT 1 CRH 27.17 33.93 24.88% Next Potential Coupon 10.5%
SKG 25.10 31.38 25.02%
BIRG 5.32 4.42 -16.88%
RYA 11.41 15.51 35.99% 0.0%
IRISH KICK OUT 2 CRH 28.72 33.93 18.14% Next Potential Coupon 10.5%
SKG 24.89 31.38 26.07%
KSP 44.72 55.60 24.33%
RYA 10.81 15.51 43.54% 10.5%
IRISH KICK OUT 3 CRH 29.47 33.93 15.13% Next Potential Coupon 10.5%
SKG 28.14 31.38 11.51%
BIRG 4.35 4.42 1.66%
RYA 9.98 15.51 55.38% 10.5%
IRISH BULL & BEAR KICK OUT CRH 31.03 33.93 9.35% Next Potential Coupon 9.0%
SKG 27.16 31.38 15.54%
BIRG 3.65 4.42 20.97%
RYA 10.00 15.51 55.10% 9.0%
GOLD KICK OUT BOND NEM 38.74 45.06 16.31% Next Potential Coupon 10%
GOLD 16.89 18.52 9.65%
AU 18.93 20.36 7.55%
KL 42.01 41.13 -2.09% 10.0%
EURO FINANCIALS KICKOUT BOND* BNP 68.40 48.22 -29.50% Next Potential Coupon 20%
GLE 48.91 29.27 -40.17%
INGA 15.72 9.84 -37.43%
SAN 5.77 3.531 -38.85% 0.0%
EURO FINANCIALS KICKOUT BOND II* BNP 62.85 48.22 -23.28% Next Potential Coupon 15%
GLE 41.96 29.27 -30.26%
INGA 15.00 9.84 -34.40%
SAN 5.503 3.531 -35.83% 0.0%
CANTOR FITZGERALD IRELAND INVESTMENT JOURNAL FEBRUARY 2020 31You can also read