Just Getting Started; Best Is Yet To Come! - Dalal & Broacha
←
→
Page content transcription
If your browser does not render page correctly, please read the page content below
Initating Covearage
                                       DALAL & BROACHA
                                       S T O C K B R O K I N G P V T. L T D .

       Just Getting Started; Best Is Yet To Come!

 508, Maker Chambers V,               Avinash Tanawade
 221 Nariman Point, Mumbai 400 021.   Senior Analyst
 91-22- 2282 2992, 2287 6173          022-67141449
 research@dalalbroachaindia.com,      avinash.tanawade@dalal-broacha.com
 equity.research@dalal-broacha.com
HOME FIRST FINANCE COMPANY
INITIATING COVERAGE | BFSI
Equity Research Desk
JUST GETTING STARTED; BEST IS YET TO COME!
April 20, 2021
Home First Finance Company (Home First) is a technology Rating TP (Rs) Up/Dn (%)
driven, affordable housing finance company, which can BU Y 622 35
double its AUM in the next three years, supported by deep
distribution in relevant markets, data Science backed Market dat a
underwriting and diversified financing profile. Besides, Current pric e Rs 462
stable-to-improving margins, increasing efficiency in cost Market Cap (Rs.Bn) (Rs Bn) 42
structure, and a well-provided balance sheet will enhance Market Cap (US$ Mn) (US$ Mn) 557
the core return ratio (RoA 2.7% in FY20 to 3.9% in FY23) Fac e Value 2
Rs
over the medium term.
52 Weeks High/Low Rs 639/441
What do we like about Home First?
Av erage Daily Volume ('000) 106
As revenue growth (FY20-FY23 CAGR of 31%) is expected to BSE Code 543259
be higher than cost growth (FY20-FY23CAGR of 23%), the
Bloomberg HOMEFIRS:IN
company’s cost to income ratio (C/I ratio) will continue to So urce: B lo o mberg
trend down in our view providing significant operating
leverage. Many HFCs have shown a similar trend. For example,
Can Fin Homes’ C/I ratio improved from 33% (loan book at ~ One Year Performance
Rs 40 Bn) in FY13 to 15.7% (loan book at ~ Rs 200 Bn) in FY20. 120
The company’s asset quality performance in 9MFY21 has 110
displayed a solid resilience with stage-3 assets at 1.6%,
100
collection efficiency at 98% (Dec 2020), and zero restructuring.
ECL provision as of Q3FY21 is at Rs 0.46 Bn resulting in a total 90
provision to total loan ratio at 1.4% & Stage-3 PCR is at 90.4%. 80
With capital adequacy ratio (post completion of IPO) of 63%, Feb-21 Mar-21 Apr-21
Home First Nifty
Home First is well positioned to grow without the need to Source: Bloomberg
raise capital over the medium term.
Strong ownership (True North, Aether & Warburg Pincus) % Shareho lding Mar-21 Jan-21
provides the required comfort in Company’s ability to achieve Promoters 33.70 33.70
its mid-to-long-term goals FII 10.86 6.73
What Does Home First Bring to the Table? DII 41.70 40.66
Others 12.79 18.91
Home First does a more holistic assessment of the
To t al 100 100
customer’s family income & provides right loan amount. So
Source: BSE
the customers are willing to pay that little extra (Home First’s
average yield stood at 13% vs 9-11% of large peers).
The company’s technology led operating model helps it to
deliver industry-leading productivity ratios & the turnaround
time of 48 hr vs. industry average of 8 to 10 working days.
Home First’s branch productivity is one of the highest among
its small size peers (AuM & Disbursement per branch stood at
Rs 565 Mn & Rs 253 Mn respectively).
Financial Summary
Y/E Mar (Rs Bn) FY20 FY21E FY22E FY23E
Adj BVPS 116 156 176 200
EPS (Rs) 10 12 20 25
P/ABV (x) 4.0 3.0 2.6 2.3
P/E (x) 46 39 24 18
RoA (%) 2.7 2.6 3.5 3.8 Avinash Tanawade
RoE (%) 10.9 8.8 11.5 12.9 (022) 67141449
Source: Dalal & Broacha Research, Company avinash.tanawade@dalal-broacha.com
Please refer to our disclaimer given at the last page. | 1 |
HOME FIRST FINANCE COMPANY DALAL & BROACHA STOCK BROKING PVT LTD
Valuation and outlook
We like Home First because of its Niche positioning, solid
profitability and sustainable growth trajectory. Besides, its ability
to leverage technology for better service delivery, funding
availability with competitive cost of funds and investment by
marque private equity players (like True North, Warburg Pincus,
Aether Mauritius and Bessemer India) adds to positivity. We
believe that it offers an ‘early stage’ investment opportunity
given strong growth momentum, focused strategy and high
capitalization. We have already seen similar instances wherein
such companies have delivered strong returns, the classic
example being GRUH Finance – was trading at >10.7x FY19 P/BV
for RoA of ~2.7% levels. Thus, we have assigned a 'Buy’ rating on
Home First with a price target of Rs 622, valuing the stock at 3.1x
FY23E P/Adj BV.
Business Profile
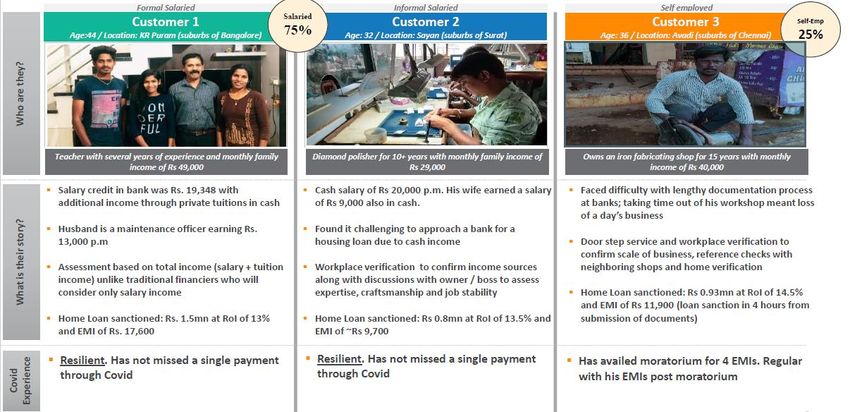
Home First focuses on a niche customer segment, which Most of Home First’s
might not be exactly creditworthy for most of the larger banks customers are first time
home buyers and may not
and HFCs. Most of Home First’s customers are first time home have credit histories
buyers and may not have credit histories supported by tax supported by tax returns
and other documents.
returns and other documents.
The company does a more holistic assessment of the
customer’s family income, spends time with the customer to
understand what other sources of income they have, how
many family members are working and so on. This holistic The company try to fill the
assessment and providing the right loan amount are very home financing gap for this
critical for the customers. segment that large NBFCs
/HFC/banks normally do not
These are the people who are either salaried (employed by cater to because of
operational costs and lack
small firms or work in junior positions in larger companies), of proven credit history.
or self-employed, (running small businesses like providing
transportation facilities in auto rickshaw or other vehicles,
running grocery shops, and other businesses).
In terms of product features as well the risk-reward metrics Over the past few years, the
company has focused more
concerns, the company has a granular portfolio with high on customers with existing
customer equity, typically for self-occupied house (92% of credit history – the share of
loans), Salaried customers (74% of loans) with very small such customers in total AUM
increased from 55% to 68%
exposure to Developer financing (2% of loans). over FY17-9MFY21.
The company try to fill the home financing gap for the
segment that large NBFCs /HFC/banks normally do not cater
to because of operational costs and lack of proven credit
history.
20 April 2021 | 2 |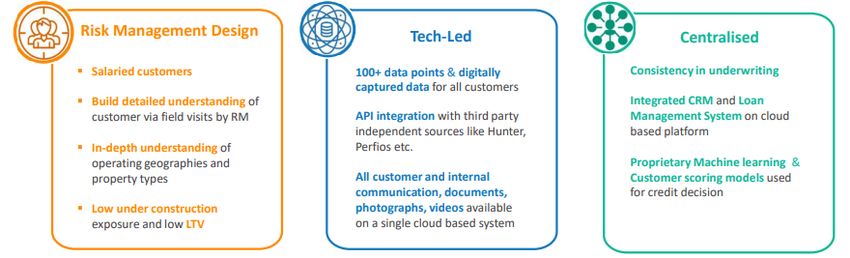
HOME FIRST FINANCE COMPANY                                                           DALAL & BROACHA STOCK BROKING PVT LTD

  Portfolio Matrix
  Chart 1: Sharp focus on Housing Loans                      Chart 2: Higher proportion of salaried customers

                           Developer Finance
    Loans against
      property
                                                                                                Self
         5%
                                                                                              employed
                                                                                                25%         Corporate
                                         Housing Loan                                                          1%
       Loans for                             92%
      commercial
       property
                                                                                 Salaried
          1%
                                                                                   74%

  Source: Dalal & Broacha Research, Company                  Source: Dalal & Broacha Research, Company

  Chart 3:Optimal balance of credit tested & new to credit   Chart 4: Granular portfolio

                                                                        0.5mn-                   1mn-
            New to
                                                                         1mn                     1.5mn   1.5mn-
            Credit                                                                                20%
                                                                         32%                             2.5mn
             32%
                                                                                                           9%

                                                                                                           Above
                                         With                                             Upto             2.5mn
                                        Credit                                           0.5mn               3%
                                        History                                           36%
                                         68%

  Source: Dalal & Broacha Research, Company                  Source: Dalal & Broacha Research, Company

 Few example of Customer

 Source: Dalal & Broacha Research, Company

20 April 2021                                                                                                           | 3 |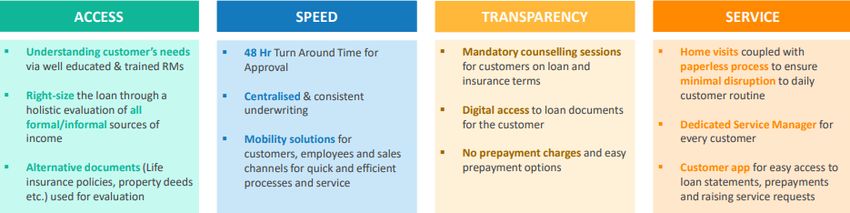
HOME FIRST FINANCE COMPANY DALAL & BROACHA STOCK BROKING PVT LTD
Robust Credit Approval Process
Initial Screening and Pre-Sanction Check: Fresh customer
leads are logged into the system by its relationship RM conduct home &
managers (RM). Thereafter, RM conducts home & workplace workplace visits & submit
visits and submit the completed digital loan application the completed digital loan
along with its commentary on visits and personal discussion application along with its
commentary on visits and
with the customer. This is cross checked by its underwriting
personal discussion with
and operations team for several factors including the customer.
completeness of application form, KYC, eligibility, fraud
check, credit bureau, income assessment, LTV, value of
collateral, bank statements, debt burden and third party
databases for income and asset ownership.
Customer Credit Underwriting: The Company has The Company has
centralized underwriting team assisted by data science centralized underwriting
backed customer-scoring model to evaluate a customer’s team assisted by data
ability to repay the loan and maintain consistency in science backed customer-
underwriting procedures across branches and regions. The scoring model to evaluate a
customer’s ability to repay
company utilize proprietary machine learning credit scoring the loan and maintain
models for credit assessment process and bifurcates consistency in underwriting
customers into different categories based on the level of procedures across branches
risk, to make a final decision. and regions.
Loan Collection and Monitoring: The Company has set up
a robust and tiered, collections management system with All its borrowers register
prescribed collection action at each stage of severity of for an automated debit
default. All its borrowers register for an automated debit facility, which reduces its
facility, which reduces its cash management risk, and tracks cash management risk, and
track the status of
the status of instalments collected on a real time basis instalments collected on a
through a collections module. Approximately 93% of its real time basis through a
collections for the financial year 2020 were non-cash based. collections module.
Value Proposition
Source: Dalal & Broacha Research, Company
20 April 2021 | 4 |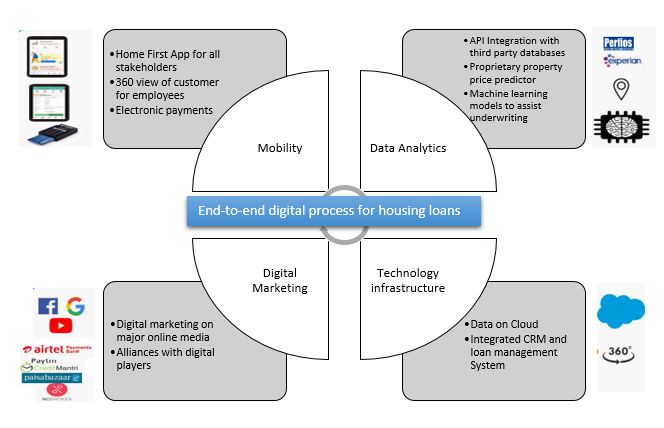
HOME FIRST FINANCE COMPANY DALAL & BROACHA STOCK BROKING PVT LTD
New bright kid on the block!
(“An organization’s ability to learn, and translate that learning into
action rapidly, is the ultimate competitive advantage”)
Given the under-penetration in the niche customer segment Despite the liquidity crunch,
that Home First caters to, we feel that it will be able to the company has posted a
FY15-FY18 AUM CAGR of
maintain its strong loan book growth in the foreseeable 69% while disbursements
future. grew at 56% CAGR.
Despite the liquidity crunch, the company has posted a
FY15-FY20 AUM CAGR of 61% while disbursements grew at
50% CAGR. Currently, the company’s loan book stood at ~Rs
40 Bn, which will likely double in the next three years,
supported by diversified sourcing channels and expanding
distribution network (stood at 72 branches vs. 42 three
years back).
There are many examples where well managed companies
are able to double their loan book in two to three years. For We believe Home First is in
e.g. Can Fin Homes has doubled its loan book from Rs 40.2 the early growth phase and
Bn in FY 13 to Rs 82.31 B n in FY15, while GRUH Finance has there is a lot of scope to
doubled its loan book from Rs 40.8 Bn in FY12 to Rs 89.3 expand the business.
Bn in FY15.
We believe Home First is in early growth phase and there is
a lot of scope to expand the business.
Significant headroom for growth
Chart 5: Home First Chart 6: Aavas Financiers
36.2
78
24.4
59
41
13.6
27
8.5
17
5.5
FY16 FY17 FY18 FY19 FY20 FY16 FY17 FY18 FY19 FY20
Source: Dalal & Broacha Research, Company Source: Dalal & Broacha Research, Company
Chart 7:can fin homes Chart 8: GRUH Finance
174
207
156
184
157
132
133
111
106
89
70
82
54
58
41
40
FY13 FY14 FY15 FY16 FY17 FY18 FY19 FY20 FY12 FY13 FY14 FY15 FY16 FY17 FY18 FY19
Source: Dalal & Broacha Research, Company Source: Dalal & Broacha Research, Company
20 April 2021 | 5 |
HOME FIRST FINANCE COMPANY DALAL & BROACHA STOCK BROKING PVT LTD
Chart 9: Aadhar Housing Finance Chart 10: Repco Home Finance
114
100 118
110
80 99
89
77
60
32 47
18 35
FY16 FY17 FY18 FY19 FY20 FY13 FY14 FY15 FY16 FY17 FY18 FY19 FY20
Source: Dalal & Broacha Research, Company Source: Dalal & Broacha Research, Company
Loan growth reported by major payers in last five years
Rs in Bn FY15 FY16 FY17 FY18 FY19 FY20 5Y CAGR
HDFC 2282 2595 2965 3628 4066 4509 15%
LIC Housing Finance 1084 1252 1456 1675 1946 2106 14%
Indiabulls Housing Finance 522 687 913 1222 1205 930 12%
PNB Housing 173 276 415 623 847 833 37%
Source: Dalal & Broacha Research, Company
HUGE OPPORTUNITY AVAILABLE IN TARGET SEGMENT
Currently, India has one of the largest young population in There is significant housing
the world, with a median age of 28 years. There is a shortage in India, mostly in
significant housing shortage in India, mostly in lower lower income segments in
urban as well as rural (over
income segments in urban (95% of urban housing shortage 90% of housing shortage is
is in EWS/LIG segment) and rural (90% of rural housing in EWS/LIG segment) areas-
shortage is in EWS/LIG segment) areas— Home First’s target that Home First targets
segment.
Catering to this segment requires a special skillset in
As a result of its expertise,
absence of requisite income proofs as lending to them, is
experience and business
based on an assessment of their income through various model, Home First is able to
methods, including their cash flows. As a result of its effectively serve such
expertise, experience and business model, Home First can customers and grow its
effectively serve such customers and grow its business. business.
Over the years, HFC players saw many ups and downs not
only in terms of business growth but also in terms of return
We believe companies which
ratio. Among this players, most of the time companies are focused on retail
which are focused on retail housing loan and specifically on housing loan and
the salaried segment (who have predictable cash flows) are specifically on salaried
able to maintain their return ratio across cycles. segment (who have
predictable cash flows) are
Best examples to prove this theory is GRUH Finance & Can able to maintain their return
ratio across cycles.
Fin Homes, which are able to maintain their credit cost
under control and able to generate handsome returns for
their investors. Home First is also such outlier, who focused
on housing (92% of total loan) and specifically on salaried
segment (74% of total loan).
20 April 2021 | 6 |HOME FIRST FINANCE COMPANY DALAL & BROACHA STOCK BROKING PVT LTD
Superior asset quality aided by data and technology
analytics
Home First’s asset quality performance in 9MFY21 has
displayed a solid resilience with stage-3 assets at 1.6%,
COVID19 was the most-
collection efficiency at 98% (Dec 2020), 1+ DPD pool at 7.5% rigorous stress test of the
(Q3FY21) and zero restructurings. company’s underwriting till
date, which the company
COVID19 was the most-rigorous stress test of the has pass with flying colours.
company’s underwriting till date, which the company has
pass with flying colours.
On provisions, ECL provision as of Dec 2020 is at Rs 461.8
million resulting in a total provision to loan outstanding On provisions, ECL
ratio at 1.4% and Stage-3 provision coverage ratio is at provision as of Dec 2020 is
at Rs 461.8 million resulting
90.4%. in a total provision to loan
The company has also imposed more stringent credit outstanding ratio at 1.4%
and Stage-3 provision
guidelines and further strengthening the underwriting coverage ratio is at 90.4%.
process keeping in mind the COVID-19 environment for new
customers as well as existing customers for already
approved loans.
Chart 11: Asset Quality have a relatively lower impact of the pandemic
Gross NPA Net NPA
1.6%
1.1%
1.0% 1.0%
0.9%
0.8% 0.8%
0.7%
0.6% 0.6% 0.6%
0.5%
FY18 FY19 FY20 Q1FY21 Q2FY21 Q3FY21
Source: Dalal & Broacha Research, Company
Sturdy reduction in bounce rate
The company’s bounce rates have gone down substantially Under pre-COVID waterfall,
to ~ 20% in Q3FY21 from 36.4% in Q1FY21, supported by 10% bounce rates used to
strong recovery in collection efficacy and high-touch translate into 1.5% to 2% of
model. 30 days past due, which
would further translate into
Jan and Feb 2021 the bounce rates stood at around 20%, a NPA of about anywhere
indicating that the delinquency trend will continue at this between 70 bps to ~ 1%.
current level for maybe another two to three quarters post
which it will likely to come back to the pre-COVID levels.
Under pre-COVID waterfall, 10% bounce rates used to Now 20% bounce rates could
translate into 1.5% to 2% of 30 days past due, which would translate into a NPA of
further translate into a NPA of about anywhere between 70 anywhere between 1.4% to
bps to ~ 1%. ~2%
Now 20% bounce rates could translate into a NPA of
anywhere between 1.4% to ~ 2%.
20 April 2021 | 7 |HOME FIRST FINANCE COMPANY DALAL & BROACHA STOCK BROKING PVT LTD
Chart 12: Movement of Bounce Rate
Bounce rate
36.4%
28.3%
20.1%
11.7% 10.8% 10.2% 10.9% 10.5%
9.2% 9.5% 10.0%
Q1FY19 Q2FY19 Q3FY19 Q4FY19 Q1FY20 Q2FY20 Q3FY20 Q4FY20 Q1FY21 Q2FY21 Q3FY21
Source: Dalal & Broacha Research, Company
Chart 13: Strong recovery in collection efficiency
100%
90%
80%
70%
60%
50%
Apr-20 May-20 Jun-20 Jul-20 Aug-20 Sep-20 Oct-20 Nov-20 Dec-20
Apr-20 May-20 Jun-20 Jul-20 Aug-20 Sep-20 Oct-20 Nov-20 Dec-20
Collection efficiency 72.5% 64.4% 78.4% 84.6% 94.3% 99.8% 96.3% 96.6% 97.6%
Unique customers 72.9% 63.7% 74.7% 79.8% 83.5% 93.8% 95.3% 95.5% 96.1%
Source: Dalal & Broacha Research, Company
Chart 14: Movement of DPD 1+ & DPD 30+
DPD 1+ DPD 30+
7.5%
6.7%
4.4%
4.1%
3.1% 3.2%
2.0% 2.0%
1.7% 1.5%
1.4% 1.3%
FY18 FY19 FY20 Q1FY21 Q2FY21 Q3FY21
Source: Dalal & Broacha Research, Company
20 April 2021 | 8 |HOME FIRST FINANCE COMPANY DALAL & BROACHA STOCK BROKING PVT LTD
Strategic Market Selection & Contiguous Expansion
(A wise man once said that “Choose your battles wisely because if
you fight them all you'll be too tired to win the really important
ones”)
While increasing the scale of its operations, Home First has
strategically expanded to geographies where there is
substantial demand for affordable housing finance along According to the CRISIL
with industry portfolio-at-risk levels. Report, the 60 districts in
which the company is
According to the CRISIL Report, the 60 districts in which the present accounted for ~ 48%
company is present accounted for ~ 48% of the affordable of the affordable housing
housing finance market in India during FY19 and have a finance market in India
high per capita income with rising levels of urbanization. during FY19 and have a high
per capita income with
As per the estimates of the Twelfth Five Year Plan, 10 states rising levels of urbanization.
accounted for approximately 76% of the urban housing
shortage. These ten states account for ~98% of its portfolio.
Chart 15: State-wise urban housing shortage
3.5 3.1
3.0
2.5
1.9
Rs Mn
2.0
1.3 1.3 1.3 1.2
1.5 1.2 1.1 1.0 1.0
1.0 0.6 0.5 0.5 0.4 0.4 0.4 0.4 0.3
0.5 0.2 0.2
0.0
Source: Dalal & Broacha Research, Company
Home First focuses on a few geographies where it has a good understanding and scales
up gradually to manage costs and asset quality better.
In the last three years, the company has demonstrated its ability to successfully identify
new regions to set up branches and grow its market share in such regions. For e.g. the
company has identified Jaipur, Ahmedabad, Surat, Indore, Nagpur, Raipur, Hyderabad,
Bengaluru and Chennai to set up its branches.
The following table reflects the improvement in its market share, in terms of origination
of home loans in the bucket size of Rs 500,000 to Rs 2500,000, for the periods indicated;
Home First’s market share Home First’s market share
Branch Location
during Q1 FY18 during Q4 FY20
Jaipur 0.1% 2.3%
Ahmedabad 1.7% 2.7%
Surat 1.7% 2.5%
Indore 0.2% 2.3%
Nagpur 0.9% 2.2%
Raipur 0.3% 0.8%
Hyderabad 0.2% 1.1%
Bengaluru 0.2% 1.9%
Chennai 1.0% 2.0%
Source: Dalal & Broacha Research, Company
20 April 2021 | 9 |HOME FIRST FINANCE COMPANY DALAL & BROACHA STOCK BROKING PVT LTD
State-Wise Mortgage-to-GDP Ratio
Per Capita Home mortgage loan Percentage of Percentage of
States Income (Rs '000) outstanding as a % of GDP GLA % Branches %
States Data Home First
Maharashtra 176 15.6% 20% 21%
Karnataka 188 12.4% 9% 6%
Telangana 181 12.0% 5% 6%
Tamil Nadu 172 11.1% 11% 15%
Delhi 329 10.5% - -
Haryana 203 10.0% 1% 1%
Kerala 184 8.3% - -
Andhra Pradesh 144 8.2% 2% 6%
Gujarat 175 7.9% 39% 28%
Uttar Pradesh 55 7.6% 3% 1%
Rajasthan 99 6.7% 5% 8%
Uttarakhand 182 6.7% - -
Madhya Pradesh 83 6.1% 4% 7%
Punjab 143 5.8% - -
Chhattisgarh 90 5.7% 1% 1%
Source: Dalal & Broacha Research, Company
Branch opening strategy:
Whilst demand for credit in its target segment remains Before setting up new
abundant, execution remains key given the largely informal branches, the company
credit assessment requires extensive understanding of local conduct in-depth studies
geography. and market research to
assess potential demand for
Therefore before setting up new branches, the company its products and engage
conduct in-depth studies and market research to assess the with local property valuers
potential demand for its products and engage with local and legal advisors.
property valuers and legal advisors.
The company has outreach program where a person works
in the location for about six months, builds up a small
portfolio and then put the branch. This way the company
can identify all the issues and problems at an earlier stage.
Currently, the process is underway in ~ 20 locations and will
put up branches in these locations in upcoming quarters.
Better efficiency
Average AUM per Disbursements per
HFCs (Rs Mn)
branch branch
Gruh Finance 895 254
Aspire Home Finance 329 17 Better branch efficiencies
Aadhar Housing Finance 378 105 than most of its small-size
peers.
Aavas Financiers 339 127
Aptus Value Housing Finance 200 81
Home First 565 253
Source: Dalal & Broacha Research, Company
20 April 2021 | 10 |HOME FIRST FINANCE COMPANY DALAL & BROACHA STOCK BROKING PVT LTD
Diversified Sourcing Channels
(The greater the diversity, the greater the perfection)
Home First has a diverse range of lead sourcing channels,
which includes connectors, architects, affordable housing During FY20, 55% of its
leads come from
developers, in addition to conducting loan camps and micro
connectors, followed by
marketing activities, and utilizing employee and customer 18.5% from builder
referrals and branch walk-in customers. ecosystem, 9.3% from
During FY20, 55% of its leads come from connectors, branches, 7.7% from
followed by 18.5% from builder ecosystem, 9.3% from marketing, 4.3% from
construction community,
branches, 7.7% from marketing, 4.3% from construction
2.1% from micro connectors,
community, 2.1% from micro connectors, 2.3% from digital 2.3% from digital and 0.7%
and 0.7% from strategic alliance. from strategic alliance.
Connectors are third-parties who provide the company with
customer leads on a commission basis paid only when a
loan is disbursed and they do not assist in the loan
As of Sep 30, 2020, the
application process.
company has over 800
The company’s connectors are generally individuals such as active connectors, which has
insurance agents, tax practitioners and local shopkeepers. increased from over 470
As of September 30, 2020, the company has over 800 active active connectors in March
connectors, which has increased from over 470 active 31, 2018.
connectors in March 31, 2018.
The company has also entered into arrangements with
certain digital lead aggregators and other digital players
within the housing and real estate ecosystem, which helps
the company to source leads with embedded customer data.
Increasing strategic tie-ups
Home First has established a tie-up with one of the leading Home First has also entered
payment banks in the country, Airtel Payments Bank, for into arrangements with a
providing housing loans in affordable category to their range of new fintech
customers. partners including No
Broker Technologies
It has also entered into arrangements with a range of new
Solutions, Lendingkart
fintech partners including No Broker Technologies Technologies and One97
Solutions, Lendingkart Technologies and One97 Communications (Paytm) for
Communications (Paytm) for advertising and promotional advertising and promotional
activity of its affordable housing loans. activity of its affordable
housing loans.
VNC Group, a manufacturer and distributor of building
materials used in construction was on-boarded as an
alliance partner in south India to jointly address the needs
of an individual house builder.
The company has also initiated its campaign on Paytm using
the banner advertisement channel.
20 April 2021 | 11 |HOME FIRST FINANCE COMPANY DALAL & BROACHA STOCK BROKING PVT LTD
Leveraging Technology to increase scale & better
productivity
What we most like about Home First is that they are not just
riding on the latest buzzwords – ‘Tech’ and ‘Analytics’. Home First is using
Instead, the company is using them as a platform to technology across the
differentiate itself from the peers. Home First is using value chain right from
technology across the value chain right from origination to origination to
disbursements to collections. disbursements to
Because of this, the company can deliver industry-leading collections.
productivity ratios and has a turnaround time of 48 hours
against the industry average of 8 to 10 working days.
It uses data analytics, application scorecard, mobile
application for recording & monitoring leads and geo-
tagging of properties to mitigate risks and improve
efficiency. This also provides streamlined approval and The company can deliver
documentation procedures and reduce incidence of error. industry-leading
productivity ratios and has
In short, Home First uses its technology prowess to right- the turnaround time of 48
price the risk, improve customer retention, maintain healthy hours against industry
asset quality, and provide better risk-adjusted returns to its average of 8 to 10 working
days.
investors.
The company’s integrated customer relationship
management and loan management system provides a
holistic view of its customers and ensures connectivity and
uniformity across its branches.
Scalable operating model built on holistic technology use
Source: Dalal & Broacha Research, Company
20 April 2021 | 12 |HOME FIRST FINANCE COMPANY DALAL & BROACHA STOCK BROKING PVT LTD
How technology helps to meet strategic objectives
Business growth: The Company has entered into
arrangements with several digital lead aggregators and The Company has entered
other digital companies in the housing and real estate into arrangements with
several digital lead
ecosystem such as Homelane, Paisa Bazaar, Quikr India, aggregators and other
Credit Mantri and Aapka Painter, which helps the company digital companies in the
to source leads embedded with customer data. housing and real estate
ecosystem such as
Improve underwriting: To improve underwriting accuracy
Homelane, Paisa Bazaar,
and to identify areas of concern, the company has entered Quikr India, Credit Mantri
into arrangements with numerous third party service and Aapka Painter, which
providers to obtain additional information such as fraud helps the company to
related data, banking, investment and taxation related data, source leads embedded with
customer data.
and vehicle ownership of customers.
Technology Driven Collections System: Home First has
built a robust collections management system wherein
approximately 93% of its collections for FY2020 were non-
cash based, which eases stress on monitoring financial
transactions and reduces its cash management risk.
Furthermore, the company perform predictive analytics to
predict the probability of default, which helps them in
obtaining early signals of potential defaults and initiate
appropriate action to mitigate risks.
Overall, Home First is focused on creating an end-to-end digital
process for housing loans encompassing digital marketing,
exhaustive customer data capture through API integrations with
third-party databases such as Hunter and Perfios, automated
underwriting via machine learning algorithms and instant approvals
through mobility solutions.
Data Science backed centralized underwriting
Source: Dalal & Broacha Research, Company
20 April 2021 | 13 |HOME FIRST FINANCE COMPANY DALAL & BROACHA STOCK BROKING PVT LTD
Multiple sources of funding helps to maintain healthy
liquidity
Home First has built a diversified funding mix which
includes: 1) term loans and working capital facilities from Availability of funds from a
Banks (47% of total borrowing); 2) proceeds from loans wide range of sources has
assigned and securitized (19% of total borrowing); 3) reduced the company’s
proceeds from the issuance of NCDs (7% of total borrowing); dependency on any one
and 4) refinancing from the NHB (26% of total borrowing). segment.
Availability of funds from a wide range of sources has
reduced the company’s dependency on any one segment.
The company has zero borrowings through commercial
paper and its cost of borrowing has been trending
Because of the company’s
downwards. sturdy track record number
Its liquidity buffer as of Dec 2020 stood at 15.43 Bn. of its lender relationship
Because of the company’s sturdy track record number of its increased from 10 in FY18
to 17 in 3QFY21.
lender relationship increased from 10 in FY18 to 17 in
3QFY21.
In the last few years, the company has improved its credit
ratings from ‘CARE A-’ in FY17 to ‘CARE A+’ Q2FY20 and
also currently have an A+ (stable) rating from ICRA.
We believe believes any rating upgradation going forward
will reduce the cost of borrowings and improve profit
margins.
Chart 16: Borrowing Break-up
Pvt Banks Public Banks NBFC NHB Refinance NCD DA
Q3FY21 19% 28% 1% 26% 7% 19%
Q2FY21 22% 27% 2% 21% 7% 21%
Q1FY21 21% 29% 2% 21% 5% 22%
Q4FY20 25% 33% 2% 21% 19%
Q3FY20 28% 32% 1% 18% 21%
Q2FY20 30% 32% 1% 20% 17%
Q1FY20 21% 39% 2% 23% 15%
0% 10% 20% 30% 40% 50% 60% 70% 80% 90% 100%
Source: Dalal & Broacha Research, Company
With access to various sources of funds and a focus on long- Home First regularly explore
assignment transactions,
term borrowings, Home First has a favourable asset-liability
which helps the company to
position across all categories. optimize its capital usage,
Home First regularly explore assignment transactions, bring down leverage, and
which helps the company to optimize its capital usage, improve cost of funds as
bring down leverage, and improve cost of funds as well as well as balance the existing
liquidity position.
balance the existing liquidity position.
Securitization per se works very well from an ALM point of
view also because it is linked directly to the asset. It helps
build credibility with banks and lending institutions as they
review the company’s book and form an opinion on its book
on a more detailed basis because securitization goes
through a fairly detailed level of audit.
20 April 2021 | 14 |HOME FIRST FINANCE COMPANY DALAL & BROACHA STOCK BROKING PVT LTD
Prepayment of the loans, which is the key risk to asset and
liability mismatch. While the contractual tenure of the home
While the contractual tenure
loans is around 17 to 20 years, the effective tenure is in the of the home loans is around
region of around 6 to 7 years. 17 to 20 years, the effective
Consistent demand for affordable housing loans and tenure is in the region of
diversified sourcing channels are helping the company to around 6 to 7 years.
award new loans to continuously maintain the higher assets
than liabilities.
Chart 17: ALM Position as of December 31, 2020
Inflows (Rs Bn) Outflows (Rs Bn) Surplus (Rs Bn)
80.0 69.4 16.0
70.0 13.5 59.0 14.0
56.3
60.0 12.0
50.0 40.9 42.8 10.5 10.0
8.6 9.0
40.0 7.5 7.5 33.3 8.0
30.0 22.6 6.0
16.0 13.6
20.0 11.9
7.5
4.0
10.0 4.4 2.0
0.0 0.0
0-3months 3-6 months 6-12 1-3 years 3-5 years 5+ years
months
Source: Dalal & Broacha Research, Company
VERY WELL CAPITALISED
With capital adequacy ratio (post completion of IPO) of 63%
compared to 15% regulatory threshold, Home First is well
positioned to grow without the need to raise capital over the
medium-term.
It has sufficient headroom
It has sufficient headroom for debt capital to fund its for debt capital to fund its
planned growth and will likely to tie up additional funds at planned growth and will
competitive rates accordingly. Promoters and PE investors likely to tie up additional
have regularly infused equity capital in the company to funds at competitive rates
accordingly.
support business growth of the company.
Because of which, the company has been maintaining
healthy capitalization levels over the past few years. Due to
periodic capital infusion, the gearing level reduced from
3.7x in FY19 to 2.7x in FY20. It has further go down post
recent capital raise.
Chart 18: Healthy capital adequacy
Tier I capital Tier II capital
Promoters and PE investors
have regularly infused
1.3 equity capital in the
1.3
0.8 company to support
0.8
business growth of the
42.3 47.7 51 company.
37.7
9MFY21
FY18
FY19
FY20
Source: Dalal & Broacha Research, Company
20 April 2021 | 15 |HOME FIRST FINANCE COMPANY DALAL & BROACHA STOCK BROKING PVT LTD
Profitability to be driven by improving operating
efficiency; Scalable Operating Model
(“Persistence is what makes the impossible possible, the possible
likely, and the likely definite”)
Home First has built a technology driven operating model,
As revenue growth is
which can increase its operations and drive growth in expected to be higher than
revenue with lower incremental costs. cost growth, the company’s
As revenue growth is expected to be higher than cost cost to income ratio (C/I
growth, the company’s cost to income ratio (C/I ratio) will ratio) will continue to trend
down in our view providing
continue to trend down in our view providing significant
significant operating
operating leverage. leverage.
Many HFCs have shown a smiler trend. For example Can Fin
Homes’ C/I ratio improved from 33% (loan book at ~ Rs 40
Bn) in FY13 to 15.7% (loan book at ~ Rs 200 Bn) in FY20,
while GRUH Finance & PNB Housing saw C/I ratio drop from
19.7% & 23% (loan book at ~ Rs 40 Bn) in FY12 to 15.7%
(loan book at ~ Rs 174 Bn) & 19.6% (loan book at ~ Rs 847
Bn) in FY19.
Given the nature of the process, operating costs are
typically very high in the initial years; therefore, players who
are, over a period of time, able to achieve a fair degree of
standardization in the process by building models revolving
around specific customer profiles and geographies are
usually able to manage operating costs efficiently.
Significant headroom for growth
Chart 19: GRUH Finance Chart 20: Can Fin Homes
Loan Book (Rs Bn) C/I Ratio (%) Loan Book (Rs Bn) C/I Ratio (%)
200 26 250 50
200 40
150 22
33.0
19.7 150 28.4 26.7 30
18.9 18.5
100 17.5 18
16.7 100 19.7 20
15.9 15.7 17.3 16.2 16.3 15.7
50 14.1 14
50 10
40.8 54.5 70.2 89.3 111.2 132.4 155.9 174.1 40 58 82 106 133 157 184 207
0 10 0 0
FY12 FY13 FY14 FY15 FY16 FY17 FY18 FY19 FY13 FY14 FY15 FY16 FY17 FY18 FY19 FY20
Source: Dalal & Broacha Research, Company Source: Dalal & Broacha Research, Company
Chart 21:PNB Housing Chart 22: Home First
AuM (Rs Bn) C/I Ratio (%) Loan Book (Rs Bn) C/I Ratio (%)
1000 35 40 70
800 30.8 30.9 30
28.9 30 60 60
600 25.2 25
23.0 22.4 20 50 50
400 19.6 20 45
17.2 16.9 10 40
200 15
40 66 106 173 276 415 623 847 833 13.6 24.4 36.2
0 10 0 30
FY12 FY13 FY14 FY15 FY16 FY17 FY18 FY19 FY20 FY18 FY19 FY20
Source: Dalal & Broacha Research, Company Source: Dalal & Broacha Research, Company
20 April 2021 | 16 |HOME FIRST FINANCE COMPANY DALAL & BROACHA STOCK BROKING PVT LTD
What will make the company more efficient?
The company has invested a lot of money in people, process
and technology over the past few years. With the completion
of large part of franchise investments, leverage benefits will
flow as it gains scale.
Furthermore, the company is looking to increase the
productivity in its existing branches. We believe operating
leverage will improve as efficiency across branches will
enhance over the medium term. Most large branches are Home First is not solely
operating at C/I ratio of 22-25% vs overall C/I ratio of 45% dependent on volume to
in FY20. As of H1FY21, Home First has 21 large branches bring efficiency. It is also
operating with Avg Gross Loan Assets (GLA) of Rs 1049 Mn, using technology to
leverage economies of scale
21 mid-sized branches operating with Avg GLA of Rs 508 to enhance productivity and
Mn, and 28 small branches operating with Avg GLA of Rs reduce turnaround times
164 Mn. and transaction costs.
Home First is not solely dependent on volume to bring
efficiency. It is also using technology to leverage economies
of scale to enhance productivity and reduce turnaround
times and transaction costs.
Its digital service delivery mechanisms and operating model
brings uniformity in its operations, increases customer
satisfaction and expand business in geographies that offer
growth opportunities. Going forward, we believe the
company will further leverage its technology and strong
internal processes to support growth and improve operating
efficiencies.
Margins remain Strong
Home First has been operating at healthy and consistent
spreads of over 4.5% for the past few quarters. During
Q3FY21, the company’s spread has improved by 60 bps YoY
to 5% on account of rate reset in existing term loans and
competitive marginal cost of fresh borrowing. With healthy pricing power
resulting in relatively sticky
The company does a more holistic assessment of its family yields along with a
income and providing the right loan amount are very critical diversified borrowing
for the customers, so they are willing to pay that little extra profile resulting in
to get that additional service (Home First’s average yield moderated CoF, we expect
stood at 13% vs 9-11% of large peers). healthy margins to continue
over the next few years.
With healthy pricing power resulting in relatively sticky
yields along with a diversified borrowing profile resulting in
moderated CoF, we expect healthy margins to continue over
the next few years.
Chart 23: Stable on-book spreads
18.0% Portfolio Yield Cost of Borrowing Spread 9.0%
16.0%
13.1% 13.1% 7.0%
14.0% 12.6% 12.9% 13.0%
12.3%
12.0% 4.8% 5.0% 5.0%
4.6%
3.8% 3.9% 4.1%
10.0% 3.0%
8.0%
8.8% 8.4% 8.8% 8.5% 8.3% 1.0%
6.0% 8.0%
4.0% -1.0%
FY18 FY19 FY20 Q1FY21 Q2FY21 Q3FY21
Source: Dalal & Broacha Research, Company
20 April 2021 | 17 |HOME FIRST FINANCE COMPANY DALAL & BROACHA STOCK BROKING PVT LTD
Healthy return ratios
With stable other income and healthy improvement in
operating leverage, we see a healthy PPOP profile in the
With stable other income
medium to long term. With a stellar credit quality, we expect and healthy improvement in
the best in class credit cost to continue. operating leverage, we see a
Thus, we expect a healthy RoA profile and with increasing healthy PPOP profile in the
leverage resulting a strong RoE improvement over the medium to long term.
medium term.
We remain structurally positive on the housing landscape in
the wake of high affordability, favorable demographics and
support from the government in terms of PMAY.
With a CAR of ~63% and leverage of 2.5x, we believe Home
First has adequate capital to grow at a rate of ~30% per
annum for the next 3-4 years
Chart 24: return ratios are in rising trend
ROA ROE
13.1
10.9 11.5
10.7
8.8
5.1
3.5 3.8
2.4 2.7 2.6
1.4
FY18 FY19 FY20 FY21E FY22E FY23E
Source: Dalal & Broacha Research, Company
ROA Tree
RoA Prognosis FY18 FY19 FY20 FY21E FY22E FY23E
NII / Assets 5.4 5.5 5.4 4.9 5.4 5.7
Other Income / Assets 0.4 2.0 2.2 2.1 2.8 2.9
Net Income / Assets 5.8 7.5 7.6 7.0 8.2 8.6
Opex / Assets 3.5 3.7 3.4 2.7 3.1 3.2
Provisions / Assets 0.2 0.4 0.6 0.8 0.4 0.4
PBT / Assets 2.1 3.4 3.6 3.5 4.7 5.0
Tax / Assets 0.7 1.0 0.9 0.9 1.2 1.3
RoA 1.4 2.4 2.7 2.6 3.5 3.8
Leverage (x) 3.7 4.5 4.1 3.4 3.2 3.4
RoE 5.1 10.7 10.9 8.8 11.5 12.9
Source: Dalal & Broacha Research, Company
20 April 2021 | 18 |HOME FIRST FINANCE COMPANY DALAL & BROACHA STOCK BROKING PVT LTD
Competitive Landscape
Chart 25: Among the fastest growing affordable HFCs Chart 26: Focused on home loans
AUM Growth (FY18-20 CAGR) % Housing exposure (FY20)
92% 85%
63% 83%
74%
50% 60%
38%
20%
Home First Aadhar HF Aavas Aptus Value Home First Aadhar HF Gruh Aavas Aptus Value
Financiers HF Finance Financiers HF
Source: Dalal & Broacha Research, Company Source: Dalal & Broacha Research, Company
Chart 27: Strong Disbursement per branch/employee Chart 28: Industry leading productivity metrics
Disbursement/branch (Rs Cr) AUM/branch (Rs Cr) AUM/Employee (Rs Cr)
Disbursement/Employee (Rs Cr)
25 25 90
57
13
11 38 34
7 8 25 20
2 2 1 1 5 5 2 2
Home Aadhar HF Gruh Aavas Aptus Home Gruh Aadhar HF Aavas Aptus
First Finance Financiers Value HF First Finance Financiers Value HF
Source: Dalal & Broacha Research, Company Source: Dalal & Broacha Research, Company
FY20 NIM COF C/I Ratio GNPA NNPA ROA ROE CAR
HDFC 3.4 7.9 9.0 2.0 1.5 2.0 21.7 17.6
LIC Housing 2.3 8.1 13 2.9 2.0 1.2 14.0 13.9
PNB Housing 3.0 8.3 17 2.8 1.8 0.8 8.1 18.0
Can Fin Homes 3.5 7.5 16 0.8 0.5 1.9 17.4 22.3
Repco Home Finance 4.6 8.5 21 4.3 2.5 2.5 18.0 25.9
Aavas Financier 8.2 8.4 42 0.5 0.3 3.8 12.7 56.0
Home First 5.4 8.7 45 1.0 0.8 2.7 10.9 48.9
Source: Dalal & Broacha Research, Company
AUM CAGR Home ATS Salaried FY20
FY20
(Rs Bn) FY15-20 Loan (Rs Lakh) (%) P/BV
HDFC 5167 15 76 27 62 5.2
LIC Housing 2106 14 77 26 85 1.1
PNB Housing 833 37 58 NA 45 0.8
Can Fin Homes 207 20 90 18 71 3.2
Repco Home Finance 118 14 81 15 48 1.1
Aavas Financier 78 56 74 8 35 8.7
Home First 36 61 92 10 73 3.1*
Source: Dalal & Broacha Research, Company / * Post IPO BVPS
20 April 2021 | 19 |HOME FIRST FINANCE COMPANY DALAL & BROACHA STOCK BROKING PVT LTD
Financials
Exhibit 1: Exhibit 3:
P&L (Rs Mn) FY20 FY21 FY22 FY23 Ratios FY20 FY21 FY22 FY23
Interest
3547 4328 5371 6633 Growth (%)
income
Interest
1938 2371 2753 3340 NII 53 22 34 26
expense
NII 1609 1957 2619 3292 PPOP 71 37 45 27
Non-interest
649 814 1339 1710 PAT 75 31 66 28
income
Net revenues 2258 2771 3958 5002 Advances 41 14 28 29
Operating
1,020 1,075 1,496 1,866 Spread (%)
expenses
PPOP 1238 1696 2462 3136 Yield on
13.3 13.2 13.2 12.9
Funds
Provisions 165 312 170 213 Cost of
8.8 8.7 8.4 8.3
Funds
PBT 1073 1385 2292 2923
Spread 4.5 4.5 4.8 4.7
Tax 280 349 578 737
NIM 5.0 4.5 5.0 5.1
PAT 792 1036 1715 2187
Asset quality (%)
Source: Dalal & Broacha Research, Company
Exhibit 2: Gross NPAs 1.0 2.0 1.8 1.5
Balance
FY20 FY21 FY22 FY23 Net NPAs 0.8 1.3 1.1 0.8
sheet
Share capital 157 175 175 175 Provisions 26 38 42 46
Reserves &
9178 13918 15633 17819 Return ratios (%)
surplus
Net worth 9334 14093 15808 17994
RoE 10.9 8.8 11.5 12.9
Borrowings 24938 29756 36004 44969
RoA 2.7 2.6 3.5 3.8
Other
530 591 700 875
liability Per share (Rs)
Total
34802 44439 52512 63838
liabilities EPS 10.1 11.9 19.6 25.0
BV 119 161 181 206
Fixed assets 210 217 269 337
ABV 116 156 176 200
Investments 1456 3219 3840 3390
Valuation (x)
Loans 30139 34371 44022 56817
P/E 45.7 39.0 23.6 18.5
Cash 2221 5818 3435 2220
P/BV 3.9 2.9 2.6 2.2
Other assets 777 815 946 1074
P/ABV 4.0 3.0 2.6 2.3
Total assets 34802 44439 52512 63838
Source: Dalal & Broacha Research, Company Source: Dalal & Broacha Research, Company
20 April 2021 | 20 |HOME FIRST FINANCE COMPANY DALAL & BROACHA STOCK BROKING PVT LTD
Disclaimer
Dalal & Broacha Stock Broking Pvt Ltd, hereinafter referred to as D&B (CINU67120MH1997PTC111186) was
established in 1997 and is an integrated financial services player offering an extensive range of financial solutions and
services to a wide spectrum of customers with varied needs ranging from equities to mutual funds to depository services.
D&B is a corporate trading member of Bombay Stock Exchange Limited (BSE), National Stock Exchange of India Limited
(NSE). D&B along with its affiliates offers the most comprehensive avenues for investments and is engaged in the securities
businesses including stock broking (Institutional and retail), depository participant, portfolio management and services
rendered in connection with distribution of primary market issues and financial products like mutual funds, fixed deposits.
Details of associates are available on our website i.e. www.dalal-broacha.com
D&B is registered as Research Analyst with SEBI bearing registration Number INH000001246 as per SEBI (Research
Analysts) Regulations, 2014.
D&B hereby declares that it has not defaulted with any stock exchange nor its activities were suspended by any stock
exchange with whom it is registered in any time in the past. It has not been debarred from doing business by any Stock
Exchange / SEBI or any other authorities; nor has its certificate of registration been cancelled by SEBI at any point of time.
SEBI and Stock Exchanges have conducted the routine inspection and based on their observations have issued advice
letters or levied minor penalty on D&B for certain operational deviations in routine course of business.
D&B offers research services to clients as well as prospects. The analyst for this report certifies that all of the views
expressed in this report accurately reflect his or her personal views about the subject company or companies and its or their
securities, and no part of his or her compensation was, is or will be, directly or indirectly related to specific
recommendations or views expressed in this report.
Other disclosures by D&B (Research Entity) and its Research Analyst under SEBI (Research Analyst) Regulations,
2014 with reference to the subject company(s) covered in this report-:
D&B or its associates may have financial interest in the subject company.
D&B or its associates do not have any material conflict of interest in the subject company.
The Research Analyst or Research Entity (D&B) has not been engaged in market making activity for the subject company.
D&B or its associates may have actual/beneficial ownership of 1% or more securities of the subject company at the end of
the month immediately preceding the date of publication of Research Report.
Disclosures in respect of Research Analyst:
Whether Research Analyst or his/her relatives have actual/beneficial ownership of 1% or more No
securities of the subject company at the end of the month immediately preceding the date of
publication of Research Report:
Whether the Research Analyst or his/her relative’s financial interest in the subject company. No
Whether the research Analyst has served as officer, director or employee of the subject company No
Whether the Research Analyst has received any compensation from the subject company in the No
past twelve months
Whether the Research Analyst has managed or co‐ managed public offering of securities for the No
subject company in the past twelve months
Whether the Research Analyst has received any compensation for investment banking or No
merchant banking or brokerage services from the subject company in the past twelve months
Whether the Research Analyst has received any compensation for products or services other than No
investment banking or merchant banking or brokerage services from the subject company in the
past twelve months
Whether the Research Analyst has received any compensation or other benefits from the subject No
company or third party in connection with the research report
D&B and/or its affiliates may seek investment banking or other business from the company or companies that are the
subject of this material. Our salespeople, traders, and other professionals may provide oral or written market commentary
or trading strategies to our clients that reflect opinions that are contrary to the opinions expressed herein, and our proprietary
trading and investing businesses may make investment decisions that may be inconsistent with the recommendations
expressed herein.
20 April 2021 | 21 |HOME FIRST FINANCE COMPANY DALAL & BROACHA STOCK BROKING PVT LTD
In reviewing these materials, you should be aware that any or all of the foregoing, among other things, may give rise to
real or potential conflicts of interest including but not limited to those stated herein. Additionally, other important
information regarding our relationships with the company or companies that are the subject of this material is provided
herein. This report is not directed to, or intended for distribution to or use by, any person or entity who is a citizen or
resident of or located in any locality, state, country or other jurisdiction where such distribution, publication, availability
or use would be contrary to law or regulation or which would subject D&B or its group companies to any registration or
licensing requirement within such jurisdiction. Specifically, this document does not constitute an offer to or solicitation to
any U.S. person for the purchase or sale of any financial instrument or as an official confirmation of any transaction to any
U.S. person. Unless otherwise stated, this message should not be construed as official confirmation of any transaction. No
part of this document may be distributed in Canada or used by private customers in United Kingdom. All material presented
in this report, unless specifically indicated otherwise, is under copyright to D&B. None of the material, nor its content, nor
any
copy of it, may be altered in any way, transmitted to, copied or distributed to any other party, without the prior express
written permission of D&B . All trademarks, service marks and logos used in this report are trademarks or registered
trademarks of D&B or its Group Companies. The information contained herein is not intended for publication or
distribution or circulation in any manner whatsoever and any unauthorized reading, dissemination, distribution or copying
of this communication is prohibited unless otherwise expressly authorized. Please ensure that you have read “Risk
Disclosure Document for Capital Market and Derivatives Segments” as prescribed by Securities and Exchange Board of
India before investing in Indian Securities Market. In so far as this report includes current or historic information, it is
believed to be reliable, although its accuracy and completeness cannot be guaranteed.
Name Designat io n Email Pho ne Sect o r
Head of
Mr. Kunal Bhatia kunal.bhatia@dalal-broacha.com 022 67141442 Auto | Auto Ancillary | FMCG
Research
Mrs.Charulata Gaidhani Sr. Analyst charulata.gaidhani@dalal-broacha.com 022 67141446 Pharma | Healthcare
Mr. Mayank Babla Sr. Analyst mayank.babla@dalal-broacha.com 022 67141412 IT | Telecom | Media
Mr. Avinash Tanaw ade Sr. Analyst avinash.tanaw ade@dalal-broacha.com 022 67141449 BFSI
Mr. Akshay Ashok Analyst akshay.ashok@dalal-broacha.com 022 67141486 BFSI
Ms. Timshar Dhamodiw ala Associate timshar.dhamodiw ala@dalal-broacha.com 022 67141441 IT | Telecom | Media
Address: - 508, Maker Chambers V, 221 Nariman Point, Mumbai 400 021.
Tel: 91-22- 2282 2992, 2287 6173, Fax: 91-22-2287 0092
E-mail: equity.research@dalal-broacha.com
20 April 2021 | 22 |You can also read