KĀPITI COAST ECONOMIC UPDATE - IN THIS ISSUE September Quarterly Indicators Focus on Housing Kāpiti Success Stories - Cindy Foote and Andrea ...
←
→
Page content transcription
If your browser does not render page correctly, please read the page content below

December 2017 issue 2

KĀPITI COAST
ECONOMIC
UPDATE

IN THIS ISSUE
September Quarterly Indicators
Focus on Housing
Kāpiti Success Stories –
 Cindy Foote and Andrea Corrigan
 Life and Work After 50 – Doing it Differently

KIA ORA
                                     It’s been a busy year on the Kāpiti Coast and as many of us are starting to wind down
                                     for the Christmas break our retailers, tourism operators and accommodation providers
                                     are gearing up for the summer season.
                                     Our district’s economy is in good health and we expect the growth trend that we’ve
                                     enjoyed over the past 12 months to continue. As we look ahead to the New Year, the
                                     Council will continue to facilitate and support opportunities to grow our local economy
                                     and attract investment for visitor and business markets. This includes working with Air
                                     New Zealand to support initiatives that will increase passenger numbers, both inbound
                                     and outbound.
                                     Projects, such as Transmission Gully and Peka Peka to Ōtaki Expressway, will continue
                                     to both challenge and bring growth opportunities to our district. The Council remains
                                     focussed on working with the business community to help mitigate any negative impacts
                                     of construction and respond positively to change.
Finally, please join me in welcoming Sarah Todd, Economic Development Manager, to the Council team. Sarah will lead
the development and implementation of our economic development work programme and will work closely with key
stakeholders to explore opportunities for growth.
Have a safe and happy Christmas and best wishes for 2018.
Ngā mihi
James Cootes
Ward Councillor for Ōtaki and member of the Kāpiti Economic Development Leadership Group

SUMMARY
Kāpiti’s economy grew by 3.8% over the 12 months to              20%. The most recent BNZ-BusinessNZ Performance of
September 2017, according to Infometrics’ provisional            Services Index and Performance of Manufacturing Index
estimate of GDP. This positive result follows growth             Survey pointed towards continued expansion of business
of 3.6% the previous year. Indicators of spending and            activity across the lower North Island.
investment are expanding sharply, particularly those
                                                                 The tourism sector in Kāpiti is growing. Commercial guest
related to construction. Traffic flows rose 3.2% in the year
                                                                 nights rose 3.1% over the September year, while visitor
to September 2017.
                                                                 spending increased 5.3%. Infometrics’ analysis of Airbnb
Population growth in Kāpiti remained strong, and growth          data shows that the number of Airbnb listings rose from
has averaged 0.9%pa over the past 10 years.                      185 in October 2016 to 375 in September.
These additional people have added significantly to              For the full Infometrics report visit:
demand in Kāpiti. Electronic card data from Marketview           www.ecoprofile.infometrics.co.nz/kapiti+coast+district/
shows that retail spending in Kāpiti climbed 3.8%, car           QuarterlyEconomicMonitor
registrations increased by 16%, while residential building
consent numbers rose 33% in the year to September 2017.
Job advertisment data has shown increases to the
number of positions being advertised in the lower North
Island. Nevertheless, there are still some workers in more
vulnerable positions, with the number of people seeking
Jobseeker Support rising slightly. But the prospect of
increased government spending bodes well for those
commuting to Wellington for public sector jobs.
Business spending and investment remain buoyant.
Commercial vehicle sales increased 35% over the past year,
while the value of non-residential building consents climbed

   For more information please contact Cheryl Paget, Programme Advisor – Economic at Kāpiti Coast District Council
   cheryl.paget@kapiticoast.govt.nz 027 555 3505

                                                                                                  KĀPITI COAST ECONOMIC UPDATE   1
SEPTEMBER QUARTERLY INDICATORS >>>
Statistics by Infometrics (unless otherwise stated)

                                                                  NET MIGRATION
   GDP                                                            Annual number of persons, Kāpiti
                                                                  Coast District
   Gross domestic product growth
   Annual average % change Sep 16 – Sep 17                                 SEP 17
                                                                                                           215
          KĀPITI COAST
              DISTRICT                          3.8%                       SEP 16                          216
        NEW ZEALAND              2.5%                                    10 YEAR
                                                                        AVERAGE     -33

          WELLINGTON                                                             -100       0        100     200       300
              REGION              2.1%
                        0%                2%                 4%   Kāpiti Coast District experenced a permanent and long-
                                                                  term net migration gain of 215 persons in the year to
                                                                  September 2017. This compares with a gain of 216 a year
                                                                  ago, and a ten year average loss of 33.
   Gross domestic product ($m)
   Annual level, Kāpiti Coast District                            New Zealand’s annual net migration increased to 70,983
                                                                  from 69,947 a year ago.
          2K

           1K
                                                                  GUEST NIGHTS
                                                                  Annual average % change
          0K                                                      Sep 16 – Sep 17
               07 008 009 010 2011 012 013 014 015 016 017
             20   2   2  2         2   2   2   2   2   2

                                                                        KĀPITI COAST                       3.1%
   GDP in Kāpiti Coast District                                             DISTRICT

   For the year to September 2017
                                                                       NEW ZEALAND          2.6%

            $1,638                                                      WELLINGTON
                                                                            REGION
                                                                                          0.2%

             million
                                                                                    0%          1%    2%       3%       4%

                                                                  Total guest nights in Kāpiti Coast District increased by
                                                                  3.1% in the year to September 2017. This compares with an
   GDP in Kāpiti Coast District was up 3.8% for the year          increase of 2.6% in New Zealand.
   to September 2017 compared with a year earlier.
                                                                  Visitors stayed a total of 178,831 nights in Kāpiti during the
   Growth was higher than in New Zealand (2.5%) and
                                                                  year to September 2017, which was up from 173,375 nights
   higher than in the Wellington Region (2.1%).
                                                                  a year ago.
   GDP was $1,638 million in Kāpiti Coast District for the
                                                                  The occupancy rate (excluding holiday parks) was 26.6%
   year to September 2017 (2010 prices).
                                                                  in September 2017 (Statistics New Zealand Commercial
   Annual GDP growth in Kāpiti Coast District peaked              Accommodation Monitor Kāpiti-Horowhenua)
   at 4.8% in the 12 months to June 2017.

                                                                                                       KĀPITI COAST ECONOMIC UPDATE   2
UNEMPLOYMENT                                              JOBSEEKER
RATE                                                      SUPPORT
Average annual rate                                       RECIPIENTS
    Kāpiti Coast District                                 Annual average, Kāpiti Coast District
    Wellington Region
    New Zealand

     7.5%                                                        2k

       5%
       %                                                         1k

     2.5%                                                        0k
           07 08 09 10 2011 012 013 014 015 016 2017                    10
                                                                             20
                                                                               11     12     13     14       15     16
                                                                                                                         20
                                                                                                                           17
         20 20 20 20        2   2   2   2   2                         20            20     20     20       20     20

The annual average unemployment rate in Kāpiti was 4.9%   Working age Jobseeker Support recipients in Kāpiti in
in September 2017, down from 5.4% a year earlier.         the year to September 2017 increased by 4.5% compared
                                                          with the previous year. Growth was higher relative to
The unemployment rate in Kāpiti Coast District was the    New Zealand, where the number of Jobseeker Support
same as the New Zealand, where the unemployment rate      recipients increased by 0.6%.
was also 4.9% over the 12 months to September 2017.
                                                          An average of 1,418 people were receiving a Jobseeker
Over the last ten years, the unemployment rate reached    Support benefit in Kāpiti in the 12 months to September
a peak of 6.7% in March 2013.                             2017. This compares with an average of 1,453 since 2010.

                                                                                                         KĀPITI COAST ECONOMIC UPDATE   3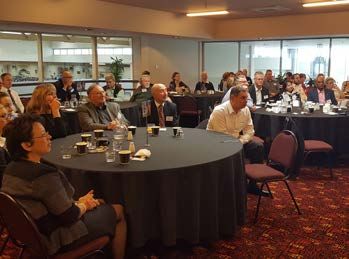
TRAFFIC FLOW
Annual average % change Sep 16 – Sep 17

KĀPITI COAST
    DISTRICT                    3.2%
                                                        Traffic flows in Kāpiti increased
                                                        by 3.2% over the year to
NEW ZEALAND          2.3%                               September 2017. This compares
                                                        with an increase of 2.3% across
 WELLINGTON                                             New Zealand.
     REGION                    3.0%
               0%   1%         2%     3%         4%

CAR REGISTRATIONS
Annual number, Kāpiti Coast District

The number of new and
first time cars registered in
Kāpiti increased by 16% in                   2k
the year to September 2017
compared with the previous
12 months. Growth was
higher than in the rest of New                   1k
Zealand, where car sales
increased by 9.4%.

A total of 1,892 cars were                   0k
registered in Kāpiti in the                         07 08 09 010 2011 012 013 014 015 016 017
                                                  20 20 20   2        2   2   2   2   2   2
year to September 2017. This
compares with the ten year
average of 1,415.

COMMERCIAL VEHICLE
REGISTRATIONS
Annual number,                                          The number of commercial
                                                        vehicles registered in Kāpiti
Kāpiti Coast District                                   increased by 35% in the year to
                                                        September 2017, compared with
                                                        the previous 12 months. Growth
                                                        was higher than in New Zealand,
                                                        where commercial vehicle sales
  SEP 17                            397                 increased by 19%.

                                                        A total of 397 commercial
  SEP 16                   295                          vehicles were registered in
                                                        Kāpiti in the year to September
 10 YEAR
AVERAGE             226                                 2017. This is higher than the ten
                                                        year annual average of 226.
           0             200               400

                                                                KĀPITI COAST ECONOMIC UPDATE    4
FOCUS ON HOUSING >>>
Housing is a topical subject in New Zealand, in terms of supply and demand,
quality and affordability, and is likely to be discussed for some time to come.
Being able to live in a house that is warm, dry and affordable, Kāpiti Coast forecast residential dwellings and
whether you are paying a mortgage or rent, is important for households, 2013 to 2043
well-being, but is becoming increasingly difficult for lower
income households. Dwellings
Recent data shows that housing is becoming less Households
affordable when based on the estimated average mean 35,000
earnings of $43,760 in 2016. The average house price in 30,000
Kāpiti over the last 12 months was $504,798 up over 15% 25,000
from a year ago. There are variances within the region, 20,000
for example the median sale price in Ōtaki in September 15,000
2017 was $381,500 whilst in Paraparamu Beach houses 10,000
reached a median of $561,750. (REINZ) 5,000
0
Rental prices are also less affordable, the September 2017 2013 2018 2023 2028 2033 2038 2043
quarter estimate is $377 a week, which is more than the Source: Sense Partners
New Zealand average of $304. Rental properties were last
affordable in September 2009. Tenancy bond data shows
that in recent years the highest rents in Kāpiti for flats and House price growth
apartments of all sizes have been in Paraparaumu Beach Annual % change
South and Raumati Beach, while the lowest rents have
been in Ōtaki and Paraparaumu Central. Kāpiti Coast District
New Zealand
There are many reasons why house prices and rents have
gone up. Some of this is about supply and demand – 30%
there are simply not enough properties for the number of
people who want to live in them. In places like Waikanae 20%
Beach, around 35% of houses are classed as unoccupied
dwellings – houses that are often baches or holiday homes. 10%
That’s a lot of houses that just aren’t in the market at all.
The cost of accommodation in the rest of the Wellington 0%
region is a factor, as first time buyers priced out of the city
look further afield for a home, and the retired looking for the -10%
quality of life that the coast offers. Empty nesters are also
moving here, cashing up on their city properties with half -20%
07 08 09 10 11 12 13 14
20 20 20 20
an eye to comfortable living for later life. In the 12 months to 20 20 20 20
20
15
20
16
20
17
September 2017, a total of 1,074 houses were sold in Kāpiti,
Source: Infometrics
a 15% decrease on the previous year. So prices are going
up, and sales are going down.
You don’t have to go far in the district to see the number
Rent affordability index
of new houses being built. Residential consents have Quarterly level
increased by 33% in the year to September 2017, and of the
Kāpiti Coast District
2,101 residential buildings that were consented between
New Zealand
1 July 2007 to 31 July 2017, 78.9% were for houses, 15.0%
were for retirement village units, and 5.9% were for town
0.45
houses, flats and other dwellings, and less than 1% were
for apartments. In the 10 years between 2007 and 2017, 0.425
Council has consented on average approximately 210
residential buildings per annum. 0.4
Forecasts based on currently known, planned residential 0.375
development suggest that this average rate of residential
0.35
development is projected to continue over the next 25
to 30 years. (ID Profile) As such, the forecast suggests that 0.325
residential development will meet demand. At no point is
residential demand forecast to exceed residential supply, 0.3
11
06 07 08 09 10
20
12
20 20 20 20 20 20
which is good news, but doesn’t help those looking for a 20
13
20
14
20
15
20
16
20
17
new place now. Source: Infometrics
KĀPITI COAST ECONOMIC UPDATE 5
RESIDENTIAL                                                      NON-RESIDENTIAL
CONSENTS                                                         CONSENTS
Quarterly number, Kāpiti Coast District                          $m, annual running total, Kāpiti Coast
                                                                 District
       100                                                                 50

       50                                                                  25

        0                                                                   0
           06 07 08 09 10 2011 012 013 014 015 016 2017                           07 08 09 10 2011 012 013 014 015 016 017
         20 20 20 20 20        2   2   2   2   2                                20 20 20 20        2   2   2   2   2   2

A total of 71 new residential building consents were issued in   Non-residential building consents to the value of $30
Kāpiti in the July to September 2017 quarter, compared with      million were issued in Kāpiti during the current year to
68 in the same quarter last year.                                September 2017.

On an annual basis, the number of consents in Kāpiti             The value of consents increased by 20% over the year
increased by 33% compared with the same 12-month period          to September 2017. By comparison, the value of consents
a year ago. The number of consents across New Zealand            across New Zealand increased by 5.9% over the same period.
increased by 3.0% over the same period.
                                                                 Over the last 10 years, consents in Kāpiti Coast District
                                                                 reached a peak of $41 million in the year to June 2017.

HOUSE PRICES                                                     HOUSE SALES
Annual % change Sep 16 – Sep 17                                  Annual number, Kāpiti Coast District
                                                                          2K
      KĀPITI COAST
          DISTRICT                   15.4%

     NEW ZEALAND            3.1%                                           1K

       WELLINGTON
           REGION         7.2%                                            0K
                                                                              07 008 009 010 2011 012 013 014 015 016 017
                     0%      5%      10%     15%      20%                   20   2   2  2         2   2   2   2   2   2

             Average current house value
                 Kāpiti Coast District
               For the year to September 2017                                        1,074
              $504,798                                                       Houses sold in Kāpiti
                                                                          year ending September 2017
The average current house value in Kāpiti Coast District         House sales in Kāpiti in the year to September 2017
was up 15% in September 2017 compared with a year                decreased by 15% compared with the previous year.
earlier. Growth outperformed relative to the rest of New         Growth outperformed relative to the rest of New Zealand,
Zealand, where prices increased by 3.1%.                         where sales decreased by 17%.

The current average current house value is $504,798 in           A total of 1,074 houses were sold in Kāpiti in the 12 months
Kāpiti. This compares with $637,670 in New Zealand.              ended September 2017. This compares with the ten year
                                                                 average of 1,087.
                                                                                                         KĀPITI COAST ECONOMIC UPDATE   6
KĀPITI SUCCESS STORIES >>> Text by Journalist Sharon Stephenson
CINDY FOOTE
What Cindy Foote doesn’t know about the property market could probably fit onto the back of a
postage stamp.
Cindy, who set up Jade “What really gets me out of bed in the morning is helping
Property Management people to find a home. Everyone wants a nice roof over
in 2006, bought her first their heads and I’m passionate about helping tenants to
section when she was find that.”
18. Two weeks later the
Cindy’s certainly got her work cut out for her, with an increase
share-market collapsed.
in demand for rentals – particularly in the $380–$460 a week
“I was paying 21% bracket – in the last few years. “I recently had a viewing of a
interest and it was three three-bedroom home in Kāpiti that 30 people turned up to.
years before I could A few years ago, I would be lucky to have 10.”
afford to build on the
Cindy doesn’t believe the opening of the Kāpiti Expressway
section,” recalls Cindy
has had a huge impact, but instead puts the increase down
of her first foray into the
to low interest rates, more Aucklanders and Wellingtonians
property market.
buying in the region, more first-home buyers and not
enough houses being built. “It’s not unique to Kāpiti.”
But that didn’t deter the born-and-bred Kāpiti entrepreneur
and while raising two children (Deanne now 27 and She does, however, expect the demand for Kāpiti rental
Brandon, 25) and completing a degree in valuation and properties to “go through the roof” once Transmission
property management, Cindy found herself managing Gully is operational. “I can see a real housing crisis looming
around 30 rental properties for family and friends if we don’t get more houses built.”
for free.
The grandmother of three is doing her bit to help – she’s
Realising she was good at it, Cindy started Jade Property currently working on a project to provide social housing
Management from her Kāpiti home. Fast forward eleven in Kāpiti. “I’ve got a section and if the bank says yes I’m
years and she now has around 300 rental properties on going to build a few houses for social housing tenants. In
her books. my experience, they are great tenants and are so thankful
to have a place to call home.”
ANDREA CORRIGAN
From helping introduce Red Bull to the UK to working with celebrities such as Jack Nicholson and
Jodie Foster in an Aspen ski resort, there’s not much Andrea Corrigan hasn’t done.
Her latest incarnation is as a residential real estate agent, and because they know
having started with The Professionals and now with they can get more for their
Bayleys Kāpiti. It’s a role that British-born Andrea believes money here.”
brings together the various strands of her colourful career,
Although Kāpiti has long
from marketing and sales to dealing with people.
been seen as a retirement
Andrea moved to Kāpiti with her partner Amanda in 2010 haven, Andrea says
(the couple have two children - Lacey, 3, and four-month- young families are also
old Finn). She admits she’s been incredibly busy” since increasingly drawn to the
getting into real estate. warmer climate, affordable
housing and infrastructure,
“I’ve doubled my listings year-on-year,” says Andrea.
including good schools and
“When I started in 2015, prices were stable, houses were
early childhood centres.
selling for $20-$30K within RV and properties were taking
two-three months to sell.” “We’re also seeing a lot of people in their late 50s and
early 60s buying up here and renting it out until they’re
Almost three years on and Andrea says there aren’t
ready to retire.”
enough houses in Kāpiti to meet demand.
Andrea predicts Transmission Gully will have a “huge” impact
“Some of that increase has come from the Kāpiti
on housing, with the pressure to build more houses for the
Expressway making the area more attractive to buyers,
expected influx of those wanting to buy on the coast.
but lower interest rates have also see a huge influx of
especially first home buyers who’ve been priced out of “I think there will be a rush to buy houses before
the market in Wellington coming to Kāpiti for the lifestyle Transmission Gully is completed,” she says.
KĀPITI COAST ECONOMIC UPDATE 7KĀPITI SUCCESS STORIES >>>
LIFE AND WORK AFTER 50 –
DOING IT DIFFERENTLY
Kāpiti Coast District Council, Kāpiti Coast Chamber of Commerce and Electra Business Breakfast
joined forces to run four events in October aimed at dispelling the myth that it’s the young and tech
savvy who are leading the way in creating new businesses and adding value to the workforce.
Two workshops were community focussed, aimed at “[We]…need to think creatively in terms of rostering older staff
senior entrepreneurs who aren’t ready for retirement and to fully utilise the potential these workers can bring to your
want to “take charge and re-create their future”, and two business…age should not define the years we spend in the
were business focussed, aimed at raising awareness of workforce.” - Feedback from the Electra Business Breakfast
the benefits of age-friendly employment. Geoff Pearman
from Partners in Change ran the workshops, and feedback
was very positive.
“As I am very new to business and closer to 60 than
I would like to be, I was the exact target audience for these
presentations. Well done!” - Peter H
“What Geoff was talking about was very timely for me.
I am currently thinking about ‘what next’ for me and both his
presentations and book will help me to think this through.
I had stalled on my thinking but since the presentations
have started developing a plan. Thanks for organising
these events.” - Helena C
Self-employment in Kāpiti is booming. Not only are 31.5%
of employees in Kāpiti self-employed, but since 2010 self-
employment has grown 3.5% per annum, a much faster
rate than employee jobs, at 0.9% growth. This growth
means 951 new self-employed jobs since 2010. With the
median age of the self-employed in 2013 at 52.1 years
(53.2 for men, 50.6 for women), the workshops aimed at
encouraging senior entrepreneurs were a natural priority
for Council and the Chamber.
Feedback following the events was that a senior
entrepreneur network should be created in Kāpiti, and
Council and Chamber will look at ways to support senior
entrepreneurs in the New Year.
With 20% of the district’s population aged 50-54, employers For more information on rethinking retirement and workforce
in Kāpiti are starting to face the reality that the workforce ageing go to www.partnersinchange.co.nz
is ageing and have to consider how to keep valued and
Self-employment in Kāpiti report:
experienced staff, and begin succession planning for staff
www.kapiticoast.govt.nz/Our-District/Economic-Profile/
wishing to retire.
KĀPITI COAST ECONOMIC UPDATE 8You can also read