KALRO Farmer Insights - Kenya - Mercy Corps AgriFin
←
→
Page content transcription
If your browser does not render page correctly, please read the page content below
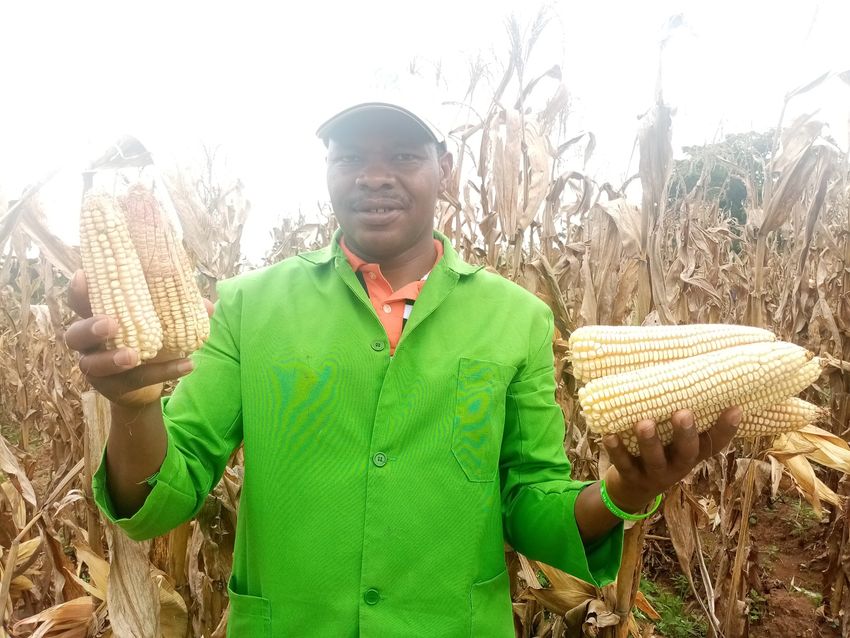
KALRO

 Credit: KALRO
Farmer Insights
Kenya

 February, 2021
AGRIFIN
 We work with +14m farmers & over 130 partners
 across Africa

Mercy Corps’ AgriFin is funded by the Mastercard Foundation and Bill and
Melinda Gates Foundation to help organizations design, test and scale
digitally-enabled services for Africa’s smallholder farmers.

• Objective to develop services that increase farmer income, productivity
 and resilience, with 50% outreach to women.
• Work with private & public sector scale partners such as banks, mobile
 network operators, agribusinesses, technology innovators and
 governments.
• We help our partners develop bundles of digitally-enabled services,
 including smart farming, financial services, market access and logistics
 supporting data-driven partnerships.

AGRIFIN AND KALRO
AgriFin Impact Series

In recognition of the wide reach and diverse range of products and services offered through the AgriFin ecosystem we are working with 60 Decibels to
measure our impact across some of our strategic partners. Partners were selected based on their area of expertise and level of engagement. This approach
considers differences across the following categories by adding the element of flexibility in the research approach; products and services offered, expected
outcomes, harvest periods and data available.

AgriFin & KALRO

AgriFin has worked closely with KALRO to enable smallholder farmers to access accurate and localized weather information via their mobile phones.
KALRO selected aWhere as a weather data provider that could offer a subscription to a package of agricultural meteorological information and insights.
This package covers the whole of Kenya (at 5 arc-minute resolution) and provides: access, via API, to daily updated agricultural meteorological
information; access, via ftp, to a daily updated set of agriculturally targeted and GIS ready spatially coherent weather surfaces; and access via web browser,
to a GIS server of the above geo-spatial weather surfaced.

Farmers can access the weather information via the Kenya Agricultural Observatory Platform (www.kaop.co.ke) where they can register to receive SMS
weather updates tailored to their county, constituency and ward location. Alternatively users may access weather information and agro-advisory messages
via the website by entering their county, sub-county and ward information. The weather information includes min and max temperatures, chance of rainfall,
and amount of rainfall for the next 14 days as well as historical information for the last 7- 10 days.

Lean Data Insights For KALRO 4

Welcome To We enjoyed hearing from 223 of your farmers - they had a lot to
 say!
Your 60dB Results

 Contents

 Headlines
 03 / Performance Snapshot
 04 / Top Actionable Insights
 05 / Farmer Voices

 Detailed Results
 07 / Deep Dive Into Key Questions

 What Next
 38 / How To Make The Most Of These Results

 Appendix
 39 / Detailed Benchmarking Summary
 41 / Methodology
Lean Data Insights For KALRO 5

KALRO Performance KALRO is providing a unique service to an underserved farmer
 base. There is an opportunity to address farmers challenges and
Snapshot deepen impact.

Inclusivity Ratio Impact What Impact First Access Farmer Voice
 • 38% speak about increased “Thanks to the organization I am able to plant maize crops
 ability to manage household in adverse weather conditions. I get a good a harvest and

0.52 43% 76%
 hence able to provide food for my family.”
 expenses

 • 30% talk about ability to afford
degree of reaching low- quality of life first time accessing Data Summary
 education
income farmers ‘very much improved’ service provided
 KALRO Performance: 223 farmers interviewed during February
 • 28% speak about increased 2021.
 household consumption Quintile Assessment compares KALRO’s performance with
 60dB Agriculture Benchmark for Farmer as Customer
 comprised of 47 companies, 17 countries, and 16,000 farmers.
 Full details can be found in Appendix.

Net Promoter Score® Challenges Crop Revenue Crop Production
 Performance vs. 60dB Benchmark

51 28% 26% 33% ` TOP 20%

 TOP 40%

 report challenges ‘very much increased’ ‘very much increased’ MIDDLE
on a -100 to 100 scale
 BOTTOM 40%

 BOTTOM 20%
Lean Data Insights For KALRO 6

Top Actionable Insights KALRO is improving farm outcomes. Farmers make specific
 suggestions to KALRO and ask for help to cope with the
 pandemic.

Headline Detail & Suggested Action

 KALRO has a Net Promoter Score of 51 which suggests high farmer loyalty and strong word of mouth! Farmers value
Going Great: knowledge of improvements, receiving accurate and reliable information via SMS and the KAOP App.

KALRO is improving farm management and Nine out of 10 farmers said the way they farm has improved because of KALRO. Specifically, they are planning farming
returns activities better and make adjustments based on KALRO’s weather information.
 An idea: Reward referrals and leverage farmers’ strong word-of-mouth to scale.

 Majority of farmers are concerned about access to fertilizer and seeds in the next six months. 65% of farmers
A Finding That Jumped Out: anticipate input prices being high. These worries were more pronounced in the context of COVID-19. These asks are
 similar what we are hearing from farmers across Kenya: see feedback from 1500+ farmers on our Kenyan farmer
Farmers ask for affordable inputs to apply the dashboard here.
information and cope with COVID-19.
 A recommendation: Can KALRO cater to demands for complementary service offerings, especially during this difficult
 time?

 28% of farmers experiences challenges with KALRO’s services. Restricted usage on mobile application and inaccurate
Area For Improvement: weather information were most often reported challenges. Farmers also identified these as areas of improvement for
 KALRO.
Farmers are facing challenges with mobile
application and inaccurate information. For discussion: Farmers do love your service! What can KALRO do to reduce farmers facing challenges?
Lean Data Insights For KALRO 7

Farmer Voices Impact Stories
 79% shared how KALRO services had improved their quality of life

 “The quality of life has changed because there has “I now practice cost effective farming. The amount of
 been an increase in product production. fertilizer I use stays longer . The surplus amount I
 Consequently, income has increased. I have added used to spend on fertilizer i now use to pay farmers.”
 more crops in the farm. I have also ventured in
 poultry farming.”
 “It has helped me increase my total income and I am
 now able to pay for electricity comfortably.”
 “I have reduced stress levels. I no longer second
We love hearing farmer voices.
 guess if it will rain or not.”
Here are some that stood out. “My family has the privilege of consuming healthy
 “I was able to settle some cash loans and constructed meals thanks to the crops I harvest. I do not spend
 a house for my farm workers to live in.” money buying bread, they consume cassava that I
 have planted.”

 Opinions On KALRO Value Proposition Opportunities For Improvement
 57% were Promoters and were highly likely to recommend 84% had a specific suggestion for improvement

 “The App has helped me to know if we're going to go “The app should have historical information about
 through a dry season hence fill my water tanks to what is expected in a given season. When it warns
 avoid lack of water. This enables me to plant and about drought, give options on what a farmer can do
 harvest cow feeds on time.” in the drought season.”
 “I have been using it to know when I can irrigate my “Give information on where to get certain types of
 crops. When it is about to rain, I reduce on watering seeds such as diseree. In future, open county satellite
 my crops. This predictions has helped me to save on offices so that any one can access even the illiterate
 cost I incurred while irrigating . The only disadvantage people since it is not easy for them to use the
 is that it limits us on the number of times we can log platforms.”
 in and use the farm.”
Lean Data Insights For KALRO 8

 Who is KALRO reaching?
Key Questions
 • Income, farm and disability profile
We Set Out To Answer • Importance of KALRO offerings
 • Availability of alternatives in market
 • Exposure and resilience to climate shocks

 What impact is KALRO having?
 • Impact on way of farming
 • Changes in crop production, productivity and revenue
 • Impact on quality of life
 • Impact on recovery from climate shocks

 Are farmers satisfied with KALRO & why / why not?
 • Net Promoter Score & drivers
 • Top challenges experienced
 • Suggestions for improvement

 Additional insights of interest to KALRO

 • Experience with COVID-19
“The information on the app has made me do more
diversification on bananas. There is enough maize for • COVID-19 and challenges with inputs
food consumption. Food is available.” • COVID-19 – information and market access
 • COVID-19 and new crops
Lean Data Insights For KALRO Profile Impact Satisfaction Bespoke Insights 9

About The Farmer The median farmer cultivated 3 acres in the last 12 months and
 applied KALRO’s information to 85% of it.

We asked questions to understand the About The Farmers We Spoke With
farmers’ homes, farms, and engagement Data relating to farmer characteristics (n = 223)
with KALRO.
Farmers were predominantly and lived in KALRO Engagement
a household with 5 members. 3 51% Duration
The average farmer had been using (months)
KALRO’s offerings for 11 months. The Acres were cultivated Of household income
crops that these offerings were applied to 38 Longest
 by the median farmer last year came from
contributed 51% of the average farmers’
 last year crop that used KALRO’s
household income last year. offerings

 5 85% 11 Average

 Average household size Of the land cultivated
 last year applied the
 information received
 from KALRO’s services
 1 Shortest
Lean Data Insights For KALRO Profile Impact Satisfaction Bespoke Insights 10

Poverty And Inclusivity There is opportunity for KALRO to reach more low-income
 farmers, compared to national Kenyan averages.

Using the Poverty Probability Index® / we Income Distribution of KALRO Farmers Relative to Kenya Inclusivity Ratio
measured how the income profile of your National Average Degree to which KALRO is reaching low-
farmers compares to the Kenya average. % living below $XX per person per day (2011 PPP) (n = 223) income farmers in Kenya

24% of KALRO farmers live on less than
$3.20 per day. This is lower than the
 Emerging Middle Class
Kenyan national and rural averages of 47% Extremely Poor Poor Low Income

 0.52
 + Above
and 65% respectively. 100%
 88%
This implies that KALRO is serving
wealthier farmers than the Kenya national 71%
 65%
averages, resulting in an inclusivity ratio of
 % of households
 BOTTOM 20%

0.52. We calculate the degree to
 47%
 56% which you are serving low-
 34% income farmers compared to
 the general population. 1 =
 23%
 parity with national pop. ; > 1
 24% = over-serving; < 1 = under-
 0% serving.
 See Appendix for calculation.
 6%
 $- $1.90 $3.20 $5.50 Max

 KALRO Kenya Nati onal Average Kenya Rural Average
Lean Data Insights For KALRO Profile Impact Satisfaction Bespoke Insights 11

Access and Alternatives Close to three quarters of farmers are accessing farming or
 weather-related information for the first time and only a fifth
 could easily find a good alternative to it.

To understand the organization’s First Access Access to Alternatives
contribution, we ask farmers if it is Q: Before you started interacting with KALRO’s SMS services or KAOP Google Q: Could you easily find a good alternative to the farming or weather-related
facilitating access to a new product or Play Store App, did you have access to farming or weather-related information that you received from KALRO’s SMS service or KAOP Google
 information like those that KALRO provides? (n = 223) Play Store App? (n = 222)
service and whether this offering can be
easily replaced by an alternative. TOP 40% BOTTOM 40%

The high percentage of farmers who are
accessing KALRO services for the first time No
suggests that it is reaching an under-
served farmer base. Maybe
 Accessing farmer or
The low availability of alternatives shows weather-related Yes
that KALRO is providing a scarce service. 76% information for the
 first time 71%

 Had prior access to 9%
 24%
 similar information
 20%
Lean Data Insights For KALRO Profile Impact Satisfaction Bespoke Insights 12

Resilience to Shocks About two-thirds of the farmers whose community experienced
 a climate shock in the last 2 years have been able to recover.

 Of all farmers said their community Shocks Experienced By Community Effect and Recovery for Household
91% experienced at least one climate related
 shock in the last 24 months
 Q: In the last 24 months, which of the following shocks affected your
 community / village? (n = 223, multiple responses allowed except
 Q: To what extent was your household able to recover from this
 event? (n = 203)**
 ‘None’)

 Irregular weather patterns 46%
Of this group of 203 farmers…
 Recovered, better off than
 Drought or severe lack of rain 36% before shock

24% Were not affected by the shock that hit
 their community 24% 25% Recovered, at the same
 level as before shock
 Flooding 20%

 Recovered, worse than
 Significant pest or farm disease before shock
 19% 9%

63%
 outbreak
 Have recovered fully Not recovered yet
 3%
 Other* 12% 38%
 Not affected

 None

 12%
 9%
 Have not recovered

 * Responses in Other include unexpected frost, soil erosion and natural fire ** Not affected is based on farmers reporting None to question: Which of
 these shocks affected your household the most?
Lean Data Insights For KALRO Profile Impact Satisfaction Bespoke Insights 13

Disability Profile The disability rate among KALRO farmer households is slightly
 less than that of Kenya’s national population.

We used the Washington Group Disability Disability Profile of KALRO’s farmer Households
questions on disability to understand the % who said a member of their household had a lot of difficulty doing any of the following or cannot do at all. (n = 223)
profile of households and how products,
services, marketing, training, or after-sales
support could be more inclusive.
KALRO farmer households have a 2.2%
 2% Respondents said that one or more of their household members had al least one of six
 disabilities

disability prevalence, which is lower than
Kenya’s national population disability rate of 1% 0%
3.5%. difficulty seeing, even if wearing difficulty remembering or
You can use this information to identify glasses (if available) concentrating
ways to better serve your farmers. For
example, if respondents have challenges
with eyesight, consider larger text size or 0% 0%
more visuals on the KAOP App and SMS’s. difficulty hearing, even if using a difficulty with self-care, such as
 hearing aid (if available) washing all over or dressing

 1% 0%
 difficulty walking or climbing steps difficulty communicating or being
 understood, using their usual language
Lean Data Insights For KALRO 14

 Who is KALRO reaching?
Key Questions
 • Income, farm and disability profile
We Set Out To Answer • Importance of KALRO offerings
 • Availability of alternatives in market
 • Exposure and resilience to climate shocks

 What impact is KALRO having?
 • Effectiveness of KALRO’s information
 • Impact on way of farming
 • Changes in crop production, productivity and revenue
 • Impact on quality of life
 • Impact on recovery from climate shocks

 Are farmers satisfied with KALRO & why / why not?
 • Net Promoter Score & drivers
 • Top challenges experienced
 • Suggestions for improvement

 Additional insights of interest to KALRO
“"I have been able to improve my investment in farming • Experience with COVID-19
since the rate of return is high. Part of the income is
used in taking of household needs thus less strain." • COVID-19 and challenges with inputs
 • COVID-19 – information and market access
 • COVID-19 and new crops
Lean Data Insights For KALRO Profile Impact Satisfaction Bespoke Insights 15

Effectiveness of KALRO’s About three-quarters of farmers reported applying all
 information.
Information

To understand how effective KALRO’s Effectiveness of Information
information was, we asked farmers how Q: How much of this information did you apply?
much of the information they applied on % of respondents who said ‘All of it’ regarding effectiveness of information; n = 157
their farm.

 100%
 90%
 80%
 70%
 70%
 60%
 50%
 40%
 30%
 20% 12% 15%
 10% 2%
 0%
 All of it Most of it Some of it Very little of it
Lean Data Insights For KALRO Profile Impact Satisfaction Bespoke Insights 16

Way of Farming Nine of 10 farmers reported an improvement in the way they
 farm due to KALRO.

We tried to gauge the effect of KALRO’s Changes In Way Of Farming
SMS service or KAOP Google Play Store Q: Has your way of farming changed because of the farming or weather-
App on farmers’ management of their related information that you received from KALRO’s SMS service or KAOP
farm. Google Play Store App? (n = 223)
 BOTTOM 40%
46% farmers said that their way of
farming had ‘very much improved’. Very much improved:
 “The information that I had access to helped improve the health of
Farmers who reported improvements in Very much improved 46%
 my vegetables. This in turn increased the number of customers I got
their way of farming also spoke of
 for my veggies.”
increased crop production.
 Slightly improved 47% “It has helped in prediction of rain. It has helped in planning on when
 to plant.”

 No change 6%

 Got slightly worse 0%
 Slightly improved:
 “I now irrigate my crops 4 times in a week during the dry season. This
 Got much worse 1% ensures my crops are well hydrated and remain healthy.”
Lean Data Insights For KALRO Profile Impact Satisfaction Bespoke Insights 17

Way of Farming: Farmers talked about improved farming schedules and using
 different crops on their farm
Top Outcomes

Farmers were asked to describe – in their Top Three Self-Reported Outcomes for 93% of Farmers Who Say Way of Farming
own words – the ways in which their Improved
farming had changed because KALRO. Q: Please explain how your way of farming has improved. (n = 207, multiple responses allowed). Open-ended,
 coded by 60 Decibels.
The top outcomes are shown on the right.
Others changes included: “I am able to know when to plant my maize seeds on time and after the rain
 Spoke about improved planning
• Timely land preparation (12%) stops when to also apply fertilizer that would be beneficial for their health.”
 of farming practices such as
• Knowledge on crop health and diseases 38% when to weed, plant, spray and
 (12%) harvest.
 (35% of all respondents)

 Reported a change in the timing “I have stopped spending money on buying water for irrigation. I just wait for
 of seeds or crops planted the rainy season in order to plant onions.”
 14% (13% of all respondents)

 Spoke about a change in type of “I now plant green grams and cow peas; they take a short time of 3 months to
 13% seeds and crops planted grow. I only plant certified green gram variety while planting.”
 (12% of all respondents)
Lean Data Insights For KALRO Profile Impact Satisfaction Bespoke Insights 18

Crop Production Most of the farmers reported increase in crop production. Three-
 quarters of this group realized the increase without planting
 additional land, suggesting an increase in productivity.

We asked farmers if they had noticed Impact on Production Reasons for Increases in Production
changes in the production of crop using Q: Has the total production from your [crop/livestock] changed because of Q: Was this increase because you planted additional land or was it from
KALRO’s services and what might have KALRO’s SMS services or KAOP Google Play Store App? (n=223) the same amount of land? (n=176)
caused it.
 BOTTOM 40%
Farmers whose production remained
unchanged reported no improvements in
the way they farm and farm revenue. Very much increased 33%
21% of farmers said increased production 5% Additional land
came from planting additional land. 21%
 Slightly increased 46%
 Same land

 No change 20% Other
 74%

 Slightly decreased 0%

 Very much decreased 1%
Lean Data Insights For KALRO Profile Impact Satisfaction Bespoke Insights 19

Crop Revenue (1/2) About three-quarters of farmers reported increase in money
 earned from crops that used KALRO’s services. Ability to sell
 more and reduced costs were primary reasons for the increases.

We asked farmers if they had noticed Returns from Crops Reasons for Increased Returns
changes in the revenue they earned from Q: Has the money you earn from farming changed because of KALRO’s Q: What were the main reasons for the increase in money earned?
the crop after receiving KALRO’s SMS services or KAOP App? (n=222) (n=161)
information.
 MIDDLE
Farmers who reported improved crop
revenue were more likely to mention
quality of life improvements. Very much increased 26% Increased volume sold 49%
Farmers attributed no change in crop
revenue to the following:
 Slightly increased 47%
1. 29% had not harvested their crop Reduction in cost 28%

2. 14% had used the crop for domestic
 No change 27%
 use
 Increase in pri ce 14%
3. 12% could not apply the information
 as they are in a different stage in the Slightly decreased 0%
 farming cycle
 Other 4%
 Very much decreased 0%
Lean Data Insights For KALRO Profile Impact Satisfaction Bespoke Insights 20

Crop Revenue (2/2) On average, farmers reported a 21% increase in crop revenue,
 which accounts for 51% of total household income.

51% 21% 36%
 of household income last year came Was the net average increase in Rated this change a significance of 4 or
 from farming revenue from crops that were using 5 when thinking about its contribution
 KALRO’s services to household income

Household Income Impacted By SunCulture Change In Crop Returns Significance of Change in Crop Returns
Q: In the last 12 months, what proportion (%) of your household’s total Q: a) Can you give a rough estimate how much your money earned from Q: On a scale of 1 to 5, where 1 is not significant at all and 5 is very
income, came from crop? (n=215) crop has increased because of KALRO’s services? (n=220) significant how significant is this increase to your overall household
 income? (n=161)

 55%
 Almost all
 20% Earning money for the first time
 (75-100%) 27%
 No change or decrease
 More than half 33%
 27%
 (50-75%) Increased by a little (0-25%)
 34%

 Less than half Increased by less than half (25-50%)
 35% 9%
 (25-50%)
 Increased by more than half (>50%) 3%
 31% 0%
 A little bit Almost all (75-100%)
 16% 5 4 3 2 1
 (1-25%)
Lean Data Insights For KALRO Profile Impact Satisfaction Bespoke Insights 21

Quality of Life Eight of 10 farmers reported improvements in the overall quality
 of life because of KALRO.

To gauge depth of impact, farmers were asked Perceived Quality of Life Change
to reflect on whether their quality of life has Q: Has your quality of life changed because of KALRO’s SMS service and
changed because of KALRO. KOAP App? (n = 223)

20% said they had not experienced any change TOP 40%
yet. Primary reason being that farmers were
waiting to complete a harvest season. Very much improved:
 Very much improved 43% “My children now attend school with all the necessary equipment
 80% report they are required like books and masks. I have started expanding
 improved
 the kitchen area of my house.”
 outcomes
 Slightly improved 27%
 “I was able to increase the wages I pay my farm attendant since I
 have been getting good returns from farming.”
 No change 20%

 Got slightly worse 0% Slightly improved:
 “I have reduced stress levels. I no longer second guess if it will rain
 or not.”
 Got much worse 0%
Lean Data Insights For KALRO Profile Impact Satisfaction Bespoke Insights 22

Quality of Life: Farmers talked about increased ability to manage household
 expenses, afford educational expenses and being able to put
Top Outcomes food on the table for family and community.

Farmers were asked to describe – in their Top Three Self-Reported Outcomes for 80% of Farmers Who Say Quality of Life Improved
own words – the positive changes they Q: Please explain how your quality of life has improved. (n = 176) , multiple responses allowed). Open-ended, coded by 60 Decibels.
were experiencing because of KALRO.
The top outcomes are shown on the right.
 “I have been able to pay my water bill and comfortably buy food for my
Some other themes that emerged: Spoke about increased ability to
 household. I also aid my parents in paying some of their bills.”
• Increased income (20%)
 38% manage household expenses
 (30% of all respondents)
• Income or profit re-invested in farm
 (17%)

 “I sold 3 goat, added the money from the maize income and bought a calf.
 Mentioned an increased ability
 I used the money for maize to pay school fees.”
 30% to afford education
 (23% of all respondents)

 Spoke about being able to put “I can constantly provide food for my family to consume and have extra to
 food on the table feed the needy in the community.”
 28% (22% of all respondents)
Lean Data Insights For KALRO Profile Impact Satisfaction Bespoke Insights 23

Recovery From Climate Two thirds of farmers who were hit by a climate shock in the last
 24 months said that KALRO had a positive impact on their
Shocks recovery.

We asked 154 producers who reported Impact of KALRO on Recovery
being affected by a climate shock if KALRO Q: Did you involvement with the KALRO have a positive, negative or no
had impacted their recovery from the effect on your recovery? (n=154)
climate shock reported earlier.
Farmers who applied all or most of the
information on their farm were more Significant positive effect 24%
 64% report “The information is helpful since I have been able to tell when the
likely to report that KALRO had a positive positive rains will come therefore know when to plant. I now have a
effect on their recovery. effects
 timetable to pump water whereby I am able to save on water and
 Some positive effect 40%
 finances especially when I get to know the exact day it will rain.”

 No effect 36%
 “Last year October, I was able to decide the right time to plant maize
 thanks to the weather forecast provided by KALRO, the rainy season
 Some negative effect 0% would come early. I did not have to set up the irrigation's kits. This
 was a cost-effective practice.”

 Significant negative effect 1%
Lean Data Insights For KALRO Profile Impact Satisfaction Bespoke Insights 24

Additional Insights: Varied Farmers who used KALRO’s services for over a year were more
 likely to report improvements in farming outcomes and overall
Experience By Tenure quality of life.

We wanted to understand if farmers who Impact On Farmers by Tenure
had worked with KALRO for longer
experienced their services differently and
reporting greater impact. Key: Farmer Interaction with KALRO

KALRO’s impact in the way farmers 12 months or less
 n = 137
manage their farm sets in early. A
comparable proportion of newer and 13 months or more
 52%
older farmers reported improvements on n = 86
this dimension.
 Way of Farming
 75%
While impact on crop outcomes deepens 68%
 42% % “very much improved” because of KALRO
 42%
over time, challenges and satisfaction did
 27% Production
not show a clear trend. % “very much improved” because of KALRO
 23%
Average performance across metrics: 30% Money Earned
 53% 34%
 % “very much improved” because of KALRO
• Farmers under 12 months: 42%
 63%
• Farmers over 12 months: 52% Quality of Life Impact
 % “very much improved” because of KALRO
 56%
 Net Promoter Score®
 % promoters

 Challenges
 % “no” challenges with KALRO
Lean Data Insights For KALRO 25

 Who is KALRO reaching?
Key Questions
 • Income, farm and disability profile
We Set Out To Answer • Importance of KALRO offerings
 • Availability of alternatives in market
 • Exposure and resilience to climate shocks

 What impact is KALRO having?
 • Effectiveness of KARLO’s information
 • Impact on way of farming
 • Changes in crop production, productivity and revenue
 • Impact on quality of life
 • Impact on recovery from climate shocks

 Are farmers satisfied with KALRO & why / why not?
 • Net Promoter Score & drivers
 • Top challenges experienced
 • Suggestions for improvement

 Additional insights of interest to KALRO
“I sell maize and from the profits I'm able to educate my • Experience with COVID-19
children. I do not have any outstanding balance with
their school fees. I have also taken in my mother who • COVID-19 and challenges with inputs
came to live with us in my house.
 • COVID-19 – information and market access
 • COVID-19 and new crops
Lean Data Insights For KALRO Profile Impact Satisfaction Bespoke Insights 26

Farmer Satisfaction: Net KALRO has a Net Promoter Score® of 51 which is very good and
 slightly higher than 60dB benchmarks.
Promoter Score

The Net Promoter Score® is a gauge of Net Promoter Score® (NPS) NPS Benchmarks
satisfaction and loyalty. Anything above Q: On a scale of 0-10, how likely are you to recommend KALRO to TOP 40%
50 is considered very good. A negative a friend or family member, where 0 is not at all likely and 10 is
score is considered poor. The farmer hubs’ extremely likely? (n = 223)

score of 51 is good.
Asking respondents to explain their rating
 60 Decibels Global Agri Average 37
explains what they value and what creates 0
 80+ companies
dissatisfaction. These details are on the
next page. -50 50 51 Farmer as customer average 34
 52 companies

 East Africa average 43
 100
 32 companies

Insight NPS = % Promoters — % Detractors

You’re in the top 40% of our agriculture 9-10 likely to 0-6 likely to
benchmark for this indicator. Increasing recommend recommend
this score by 17 points will see you move
into the next quintile!
Lean Data Insights For KALRO Profile Impact Satisfaction Bespoke Insights 27

NPS Drivers Promoters and Passives value improved knowledge about crops,
 comprehensive and accurate information which helped them
 plan their farming activities.

57% are Promoters :) 37% are Passives :\ 6% are Detractors :(
They love: They like: They complain about*:
1. Improved knowledge about crops and seeds 1. Comprehensive and accurate information to apply 1. Lack of detail, depth and timing of information
 (30% of Promoters / 17% of all respondents) on farm (31% of Detractors / 2% of all respondents)
 (43% of Passives / 16% of all respondents)
2. Comprehensive and accurate information to apply 2. Not receiving any information/messages
 on farm 2. Improved ability to make decisions regarding faming (23% of Detractors / 1% of all respondents)
 (27% of Promoters / 15% of all respondents) activities 3. Inaccurate and unreliable information
 (13% of Passives / 5% of all respondents)
3. Ability to plan farming activities ahead of time (15% of Detractors / 1% of all respondents)
 (20% of Promoters / 11% of all respondents) But complain about:
 1. Inaccurate and unreliable information
 (12% of Passives/ 4% of all respondents)

“As per the observatory I was able to plant a week before the rains “The app was okay. Sometimes it would give forecast to expect “KARLO should make sure the information gets to the farmers on
begun, this was really helpful and accurate information.” rain, but the rain does not come.” time.”

Tip: Tip:
 Tip:
Highlight the above value drivers in marketing. Passives won’t actively refer you in the same way that
 Promoters will. Negative word of mouth is costly.
Promoters are powerful brand ambassadors —
can you reward them? What would it take to convert them? What’s fixable here?
Lean Data Insights For KALRO Profile Impact Satisfaction Bespoke Insights 28

NPS by Segment Farmers who applied all the information had the highest Net
 Promoter Score.

We wanted to understand what drove Net Promoter Score by Information applied
farmers’ satisfaction with KALRO. Upon Q: On a scale of 0 to 10, how likely are you to recommend KALRO to a friend or family? (y-axis)
analysing, we found a strong correlation Q: How much of this information did you apply? (x-axis)
between NPS and amount of information
applied on the farm.
 4% 6%
The NPS for those applying all the 11% Detractors
information is 67, compared to only 13 for 25%
those who apply some of the information. 37% Passives

 65% Promoters

 71%
 57%

 24%
Question
 Applied all of it Didn't apply all of it Total
Given the varying NPS, how could KALRO
improve the information for farmers to
find it most useful? NPS: 67 13 51
 n= 157 66 223
Lean Data Insights For KALRO Profile Impact Satisfaction Bespoke Insights 29

Farmer Challenges About a quarter of farmers report challenges with KALRO’s
 service. Farmers complained about usage limit and bugs within
 KAOP application.

Asking about farmer challenges enables Proportion of Farmers Reporting Challenges Top Challenges Reported
KALRO to identify problem areas and Q: Have you experienced any challenges while using KALRO service? (n Q: Please explain the challenge you have experienced
tackle them proactively. = 222)* (n = 61)

Unresolved challenges can encourage BOTTOM 40%
negative word-of-mouth. Farmers 1. The KAOP App limits usage and blocks
reporting challenges had a NPS of 32 information
 (25% of farmers w. challenges / 7% of all respondents)
compared to 57, for those that did not
 Yes
face any challenges. “I got a prompt that I have reached my limit of number of
 logins. I currently cannot access the predictions.”
18% of the reported challenges were
 No
around the unreliability and inaccuracy of 28%
the information, which was also one of
 2. Unreliable and inaccurate information
the top complain reported by Detractors. (18% of farmers w. challenges / 5% of all respondents)
 72% “The challenge is when the app states that it will rain, it will
 rain but the timing is not correct.”

 3. Bugs in the KAOP Application
 (13% of farmers w. challenges / 4% of all respondents)
 “The application was not working. In December 2020 to
 January 2021, when you enter location, nothing would
 appear.”
Lean Data Insights For KALRO Profile Impact Satisfaction Bespoke Insights 30

Farmer Suggestions More agronomic information and customized farmer data were
 most common suggestions for improvement.

We asked farmers an open-ended Suggested improvements
question about their suggestions to help Q: What about KALRO could be improved? (n = 222, Open ended coded by 60 Decibels, % of respondents)
KALRO improve.
About a fifth could not think of a specific “They should try and diversify the information that they provide about pests and pesticides to use on the crops.”
suggestion. Among those who did,
farmers shared a variety of suggestions
surrounding agronomic and customized “The application should be pegged to advisories, by this I mean by making it more specific to the needs of the
 farmer e.g. time to vaccinate chicken during the cold season.”
data, reliable weather information and
frequent SMS.
 “They should improve the App to show the amount of rainfall in millimeters which would
 pour in a particular day.”

 21% 13% 12% 10% 8% 7% 9% 16%

 Provide Customized data Improve accuracy Provide longer Diversify Frequent SMS Others Nothing
 agronomic data of weather periods of data mediums of
 information communication
Lean Data Insights For KALRO 31

 Who is KALRO reaching?
Key Questions
 • Income, farm and disability profile
We Set Out To Answer • Importance of KALRO offerings
 • Availability of alternatives in market
 • Exposure and resilience to climate shocks

 What impact is KALRO having?
 • Effectiveness of KALRO’s information
 • Impact on way of farming
 • Changes in crop production, productivity and revenue
 • Impact on quality of life
 • Impact on recovery from climate shocks

 Are farmers satisfied with KALRO & why / why not?
 • Net Promoter Score & drivers
 • Top challenges experienced
 • Suggestions for improvement

 Additional insights of interest to KALRO
 • Experience with COVID-19
“It is very user friendly and accessing the information is • COVID-19 and challenges with inputs
easy. It provides accurate weather prediction that is
reliable • COVID-19 – information and market access
 • COVID-19 and new crops
Lean Data Insights For KALRO Profile Impact Satisfaction Bespoke Insights 32

Concern About COVID-19 Over three quarters of farmers said said they are ‘very much’
 concerned about COVID-19.

We asked farmers questions related to Level Of Concern About COVID-19 Things That Could Improve Life
COVID-19 to assess their level of concern Q: Are you concerned about COVID-19? (n = 223) Q: Related to this pandemic, what one thing could improve your life at this
and identify potential support areas. time? (n = 223) Open-ended, coded by 60 Decibels

When asked to share how their life could
be improved during this time of the
COVID-19 pandemic, farmers asked for Medical Supplies and Check-ups 31%
 Yes, very much 85%
medical supplies and regular check-ups,
inputs for farming and cash handouts for
general spending. Agriculture Inputs 15%
 Yes, slightly 7%
Responses in other include support with
increased awareness (4%), delivery Cash handouts 9%
service to reduce contact (4%), and
 No, not really 8%
employment opportunity (3%) to name a
few. Government support 7%

 No, not at all 0%
 Nothing 27%

 I'm not really sure 0%
 Other 12%
Lean Data Insights For KALRO Profile Impact Satisfaction Bespoke Insights 33

Next Month on Farm 9 out of 10 farmers are confident they will be able to undertake
 activities for next month’s farming as they normally would.
During COVID-19

We asked farmers what phase of farming Current Agricultural Activity Confidence in Performing Activity
they will be in next month and whether Q: How confident do you feel that you will be able to undertake these
 Q: Which of these phases of farming will you be in for the next month?
they’re confident in their ability to (select multiple) (n = 223)* activities as you would have normally? (n = 213)
manage as they normally would.
Half of the farmers report that they will
be preparing their land in the next month. Land preparati on 44%
42% said they would be planting in the Very confident 51%
next month.
 Planting 42%
51% of farmers indicated they were ‘very
confident’ and 41% ‘slightly confident’
 Slightly confi dent 41%
that they will fare well in the next month. Harvesting 17%
Farmers who report land preparation in
the next month were the most confident Crop on the farm 14%
about managing the activity like they Not very confident 7%
normally would.
 Weeding 14%

 Not confident at all 1%
 Selling 8%
Lean Data Insights For KALRO Profile Impact Satisfaction Bespoke Insights 34

Challenges and Requests Environmental causes and lack of access to inputs emerged as
 primary challenges. To overcome these, farmers wanted access
 to inputs, credit and market.

When we asked farmers what they need Top Challenges Related to COVID-19 Solutions for Top Challenges
at this time to overcome challenges they Q: What do you anticipate the biggest challenges being? (n = 222) Q: What kinds of agricultural products / services / information would be
anticipate in undertaking farming most useful for you to overcome these challenges? (n = 206)
activities normally at this time.
A majority asked for support through (Subsidized) Access to inputs 34%
 Environmental challenges 40%
access to inputs, followed by credit and
 Credit 14%
access to market at this time.
 Inputs not accessible 33% Access to market
Solutions coded under ‘other’ included: 11%

1. Agronomic Information (specifically PPE 7%
 General limitation of fi nances 14%
 information on crops, fertilizers and Cash 6%
 irrigation practices),
 Limited market access 8% Better selling price 6%
2. Access to farm machinery and
 tractors. Labour 4%
 Limited hired labour 7%
 Lift mobili ty restrictions 3%

 No Chall enge 12% Food 2%

 Information related to COVID-19 1%
 Other 7%
 Other 36%
Lean Data Insights For KALRO Profile Impact Satisfaction Bespoke Insights 35

COVID-19 Support: In the next 6 months, farmers want information on climate
 forecasting, highest valued crops and buyers. No single channel
Information emerged as most trusted source of information.

We wanted to learn from farmers what Suggestions for Useful Information Sources of Trusted Information
information around farming they would Q: What kind of advice would you find useful for the next 6 months? Q: What are your trusted sources for this information? (n = 223)
find useful in the next 6 months, and what (n = 223)
sources they tend to trust.
 Climate forecasting 63% Extension worker 40%
Apart from climate forecasting and crops,
more than a third of farmers want the Agro dealer 29%
information on buyers and price. Highest value crops 44%
 SMS 28%
The next slide has a further breakdown on
the market information that farmers Buyers 39%
 Local Govt. official 26%
would like to see.
 Price 36% Whatsapp 25%

 Radio 15%
 Mobility restrictions 12%
 TV 14%
Question Social distancing 11%
 Friends or family 13%
Given the high levels of concern around
COVID, are there ways for KALRO to pro- Other 5% Facebook 10%
actively communicate this information
 Other 15%
with farmers?
Lean Data Insights For KALRO Profile Impact Satisfaction Bespoke Insights 36

COVID-19 Support: Market Close to two-thirds of farmers said market information would be
 helpful, specifically on price. Over half of the farmers have a
Access preference to sell their produce to any new buyer.

Useful Market Conditions For Crop Sale Preferred Buyers For Farmers Useful Market Information
Q: Which of these will help you sell your crop and livestock produce Q: Which of these buying engagements do you prefer? Q: What kind of market information would be useful to you? (n=
in the next 6 months? (n = 223, multiple responses allowed) (n = 219) 218, multiple responses allowed)

 Market information 62% Price 55%
 Any new buyer 51%

 Connecting with new buyers 37% Types of crops in demand 53%
 Contracts 25%

 Easing mobility restricti ons 32% Quantity buy ers can absorb 45%
 Companies 15%

 Transportation support 31% Buyers' quality expectation 42%
 Aggregators / middlemen 5%

 Other 2% Other. Please specify: 1%
 Other 4%
Lean Data Insights For KALRO Profile Impact Satisfaction Bespoke Insights 37

COVID-19 Challenges: 87% of farmers anticipate input prices being too high as a
 challenge for the next half of the year. The majority are
Inputs concerned about being able to access fertilizer and seeds.

Farmers anticipate that challenges related Perceived Challenges Buying Inputs Type of Inputs
to purchasing input will be on account of Q: When you try to purchase inputs in the next 6 months, which of these Q: Which types of inputs will you find particularly hard to purchase? (n= 223,
high input prices and limited stock with challenges do you anticipate experiencing? (n = 223, multiple responses multiple responses allowed)
agro dealers. allowed)

18% also mentioned not anticipating any
 Fertilizer 41%
challenges in accessing inputs. Price of inputs is too high 65%

Farmers perceive purchasing fertilizers, Seed 39%
seeds and leasing farm machinery as Limited stock with agro dealers 21%
difficult in the coming months. Farm machinery (to lease) 31%

 No difficulty accessing inputs 18%
 Farm equipment 26%

 Travel restrictions due to lockdown 16% Pesticide 25%

 Livestock vaccines / medicines 17%
 Agro dealer stores are closed 5%
 Livestock feed 13%

 Other 4%
 Other 4%
Lean Data Insights For KALRO Profile Impact Satisfaction Bespoke Insights 38

COVID-19 Support: Slightly more than a third of farmers were looking to plant new
 crops in the next six months. Interest in new crops was
New Crops influenced by better price and ease of selling.

We asked farmers if they are planning to Adoption of New Crops Reasons for Adoption of New Crops
plant any new crops in the next 6 months Q: Which new crops, if any, are you planning to plant in the coming 6 Q: Why are you planting the new crop? (n=77)
and why they wanted to plant those months? (n=221)
crops.
Farmers want to plant new crops that will
fetch a better market price and be easier New Crops
 Better market price 45%
to sell or can be produced with lower
 Not planning to plant
costs. 35%
 new crops
 Easier to sell 25%
Some of the crops that farmers
mentioned were – cabbage, maize,
onions, groundnuts, potatoes, avocado. Lower costs 22%

Farmers who stated ‘Other’ for reasons
for adoption, stated the following: Seeds 22%

1. Higher market demand 65%
 Family Consumption 10%
2. No one else is harvesting
3. Suitable for weather Others 49%
Lean Data Insights For KALRO 39

What Next?

…& Appendix
Lean Data Insights For KALRO 40

How To Make The Most Of Here are ideas for ways to engage your team and use these
 results to fuel discussion and inform decisions.
These Insights

Example tweets or Facebook posts to What You Could Do Next. An Idea Checklist From Us To You :-)
share publicly
• 79% of our farmers say the quality of ¨ Share staff quiz – it’s a fun way to fuel engagement & discussion
 their lives has improved since working ¨ Send deck to team & invite feedback, questions and ideas. Sometimes
 Engage Your
 with us. “I am able to purchase data the best ideas come from unexpected places!
 Team
 bundles for my son to study from
 ¨ Set up team meeting & discuss what’s most important, celebrate the
 home. I also pay my farm workers on positives & identify next steps
 time their dues.” #listenbetter with
 @60_decibels Spread The ¨ Reach a wider audience on social media & show you’re invested in your
 Word farmers – we’ve added some example posts on the left
• 57% of farmers would recommend us
 to a friend or family member – what ¨ Let us know if you’d like us to send an SMS to interviewed farmers with
 are you waiting for? a short message letting them know feedback is valued and as a result,
 you’ll be working on XYZ
• 25% of all challenges faced by our Close The
 ¨ If you can, call back the farmers with challenges and/or complaints to
 farmers are related to app limits and Loop
 find out more and show you care.
 information blocks – what
 improvements would you like to see? ¨ After reading this deck, don’t forget to let us know what you thought:
 We #listenbetter with @60_decibels link to feedback form.
 ¨ Collate ideas from team into action plan including responsibilities
 Take Action! ¨ Keep us updated, we’d love to know what changes you make based on
 these insights
Lean Data Insights For KALRO 41

Detailed Benchmarking KALRO performs particularly well on serving underserved farmers
 and NPS score. Increase in crop revenue and production are
Comparison areas for improvement.

Comparison to benchmarks can be useful Comparison of KALRO Performance to Selected 60dB Benchmarks
to identify where you are under- or over-
 60dB 60dB Farmer as
performing versus peers, and help you set Global Customer 60dB East
targets. We have aligned your results to Dimension Indicator KALRO Average Average Africa Average
the Impact Management Project Who Inclusivity Ratio 0.52 1.23 1.18 0.76
framework – see next slide.
 % female 12 30 32 33
Information on the benchmarks is found How Much % reporting quality of life very much improved 43 41 46 46
below:
 % reporting quality of life slightly improved 37 40 37 39

KALRO Data % reporting crop production very much improved 33 39 46 49
# farmers 223
 % reporting crop revenue very much improved 26 35 38 41

 What Impact % reporting in quality of life improved because of ability
60dB Global Average: 38 - - -
 to afford household expenses
# companies 84
# farmers 18,587 % reporting in quality of life improved because of change
 30 - - -
 in crops and seeds
60dB Agriculture Farmer as Customer Average Contribution % first time accessing KALRO offerings 76 71 74 76
# companies 47 % saying no good alternatives are available 80 79 86 87
# farmers 12,421
 Risk
 % experiencing challenges 28 28 25 29
60dB East African Average
# companies 39 Experience Net Promoter Score 51 33 37 39
# farmers 9,246

 *Specifically, Agriculture – Farmer As Customer Average
Lean Data Insights For KALRO 42

Calculations & Definitions For those who like to geek out, here’s a summary of some of the
 calculations we used in this deck.

 Metric Calculation
 Net Promoter Score® The Net Promoter Score is a common gauge of farmer loyalty. It is measured
 through asking farmers to rate their likelihood to recommend your service to a
 friend on a scale of 0 to 10, where 0 is least likely and 10 is most likely. The NPS is
 the % of farmers rating 9 or 10 out of 10 (‘Promoters’) minus the % of farmers
 rating 0 to 6 out of 10 (‘Detractors’). Those rating 7 or 8 are considered ‘Passives’.

 Inclusivity Ratio The Inclusivity Ratio is a metric developed by 60 Decibels to estimate the degree
 to which an enterprise is reaching less well-off farmers. It is calculated by taking
 the average of KALRO % / National %, at the $1.90, $3.20 & $5.50 lines for low-
 middle income countries, or at the $3.20, $5.50 and $11 lines for middle income
 countries. The formula is:

 ([ ] $ )
 ! /
 ( $ )
 "
Lean Data Insights For KALRO 43

Summary Of Data 223 phone interviews completed in February 2021.

Collected

 Methodology
 Accuracy*
 Survey mode Phone Interviews
 Confidence Level c. 90%
 Country Kenya
 Margin of error c. 4%
 Language Swahili

 Dates February 2021

 Selected randomly from a total of
 Sampling
 490 KALRO farmers
 Response rate 44%

 Responses Collected
 Farmers 223

 *Our confidence level cannot account for two unknowns for this population: mobile penetration and extent of completeness of KALRO’s farmer phone number list.
Lean Data Insights For KALRO 44

Thank You For Working Let’s do it again sometime.

With Us!

 About 60 Decibels
 60 Decibels makes it easy to listen to the people who matter most. 60 Decibels is an impact measurement company that
 helps organizations around the world better understand their farmers, suppliers, and beneficiaries. Its proprietary
 approach, Lean DataSM, brings farmer-centricity, speed and responsiveness to impact measurement.
 60 Decibels has a network of 500+ trained Lean DataSM researchers in 45+ countries who speak directly to farmers to
 understand their lived experience. By combining voice, SMS, and other technologies to collect data remotely with
 proprietary survey tools, 60 Decibels helps clients listen more effectively and benchmark their social performance against
 their peers.
 60 Decibels has offices in London, Nairobi, New York, and Bengaluru. To learn more, visit 60decibels.com.
 Your Feedback
 We’d love to hear your feedback on the 60dB process; take 5 minutes to fill out our feedback survey here!
 Acknowledgements
 Thank you to Morris Gatheru and Boniface Akuku from KALRO, Jack Odero and Collins Marita from Mercy Corps their
 support throughout the project.
 This work was generously funded by Mercy Corps’ AgriFin Accelerate Program and the Strengthening Impact Investing
 Markets in Agriculture (SIIMA) programme, through FCDO’s Research and Evidence Division.
I am able to know when to plant and which seeds to plant.

I am able to have healthy crops and have a good harvest.

Maize production has been on the rise.

 I can cater for the

 >household bills like
 >electricity and
 >purchase food

 so that my family never lacks.

 Venu Aggarwal
 venu@60decibels.com

 Prashant Maheshwary
 prashant@60decibels.com

 Varsha Vadlamani
 varsha@60decibels.com
You can also read