KBC Group / Bank Debt presentation May 2021 - More infomation: www.kbc.com KBC Group - Investor Relations Office - E-mail
←
→
Page content transcription
If your browser does not render page correctly, please read the page content below
KBC Group / Bank
  Debt presentation
  May 2021

More infomation: www.kbc.com
KBC Group - Investor Relations Office – E-mail: IR4U@kbc.be
                                                              1
Important information for investors
This presentation is provided for information purposes only. It does not constitute an offer to sell or the solicitation to buy any
security issued by the KBC Group.
KBC believes that this presentation is reliable, although some information is condensed and therefore incomplete. KBC cannot be
held liable for any loss or damage resulting from the use of the information.
This presentation contains non-IFRS information and forward-looking statements with respect to the strategy, earnings and capital
trends of KBC, involving numerous assumptions and uncertainties. There is a risk that these statements may not be fulfilled and
that future developments differ materially. Moreover, KBC does not undertake any obligation to update the presentation in line
with new developments.
By reading this presentation, each investor is deemed to represent that it possesses sufficient expertise to understand the risks
involved.
2
KBC Passport
Well-defined core markets
Market share
(end 2020) BE CZ SK HU BG IRL
19% 21%
12% 11% 10% 8%
*
Loans and deposits
3.7m clients 4.2m clients
456 branches 28%
212 branches 23%
18%
104bn EUR loans 29bn EUR loans 12% 13%
150bn EUR dep. Investment funds
43bn EUR dep.
IRELAND 28%
0.8m clients
174 branches Life insurance 13% 8% 3% 3%
9bn EUR loans
BELGIUM
8bn EUR dep.
9% 9% 8% 10%
CZECH REP Non-life insurance 4%
0.3m clients SLOVAKIA
12 branches
10bn EUR loans HUNGARY Real GDP
5bn EUR dep. growth BE CZ SK HU BG IRL
1.6m clients 63%
203 branches
% of Assets 20%
5bn EUR loans 3% 3% 2% 3%
9bn EUR dep.
3.4%
BULGARIA 2020
-5.6% -5.2% -5.1% -3.8%
-6.3%
1.4m clients 4.1% 4.2% 4.2% 5.0%
3.5% 3.0%
175 branches 2021e
4bn EUR loans
Internat
Belgium Czech
ional 6bn EUR dep. 4.0% 4.6% 4.2% 5.0% 4.0% 4.0%
Business Republic
Markets
Unit Business 2022e
Business
Unit
Unit
GDP growth: KBC data, March ‘21
3
* Retail segment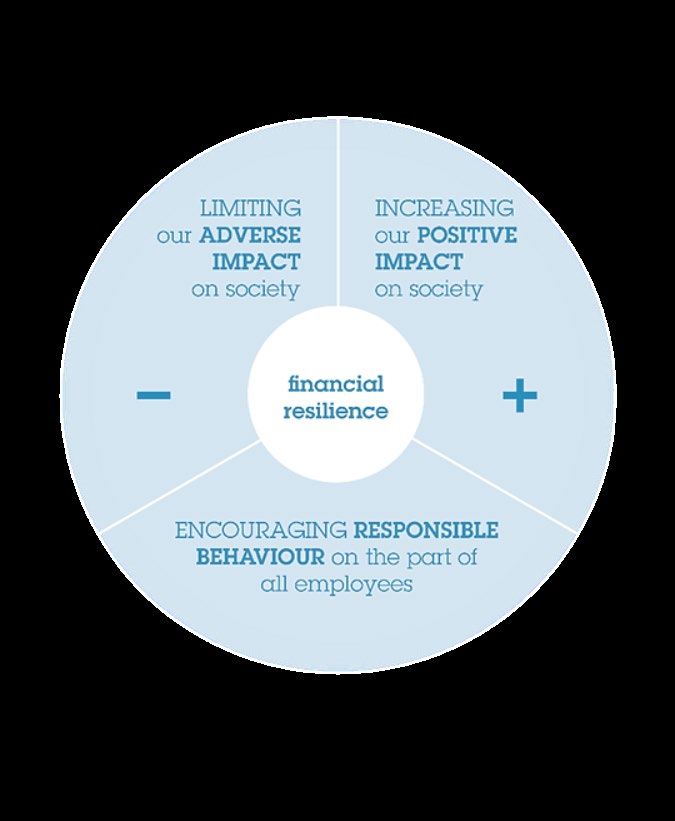
KBC Passport
Group’s legal structure and issuer of debt instruments
KBC Group NV
AT 1
Tier 2 MREL
Senior
100% 100%
KBC Bank* KBC Insurance
Covered bond No public issuance
KBC IFIMA**
Retail and Wholesale EMTN
* End of April 2019 the opportunity was taken to simplify the shareholders’ structure of KBC AM, the shares of KBC AM held by KBC Group NV (48%) shifted to KBC Bank
** All debt obligations of KBC IFIMA are unconditionally and irrevocably guaranteed by KBC Bank.
4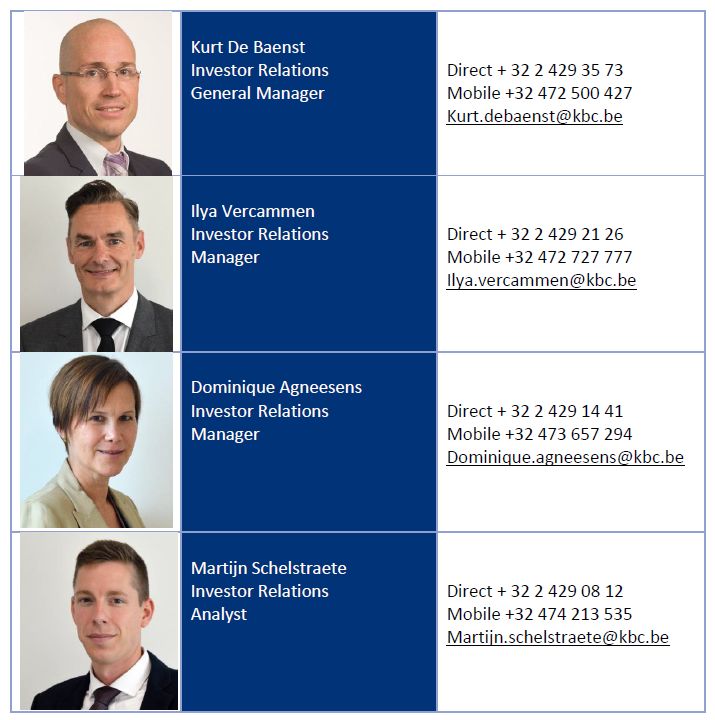
Contents
1. Strategy and business profile SHAREHOLDER STRUCTURE AT END 1Q21
Other core
MRBB
2. Financial performance 7.3%
Cera 11.5%
2.7%
3. Solvency, liquidity and funding
4. Covid-19 KBC Ancora 18.6%
5. Covered bond programme 59.9%
Free float
6. Green bond framework
7. Looking forward Roughly 40% of KBC shares are owned by a syndicate of core
shareholders, providing continuity to pursue long-term strategic
goals. Committed shareholders include the Cera/KBC Ancora
Appendices Group (co-operative investment company), the Belgian farmers’
association (MRBB) and a group of industrialist families
The free float is held mainly by a large variety of international
institutional investors
5
KBC Group in a nutshell (1)
We want to be among Europe’s best performing financial institutions! By achieving this,
KBC wants to become the reference in bank-insurance in its core markets
• We are a leading European financial group with a focus on providing bank-insurance products and services to
retail, SME and mid-cap clients, in our core countries: Belgium, Czech Republic, Slovakia, Hungary, Bulgaria and
Ireland
Diversified and strong business performance
… geographically
• Mature markets (BE, CZ, IRL) versus developing markets (SK, HU, BG)
• Economies of BE & 4 CEE-countries highly oriented towards Germany, while IRL is more oriented to the UK & US
• Robust market position in all key markets & strong trends in loan and deposit growth
… and from a business point of view KBC Group: topline diversification 2018-2020 (in %)
• An integrated bank-insurer
• Strongly developed & tailored AM business
47% 48% 47%
• Strong value creator with good operational
results through the cycle Diversification Synergy
• Unique selling proposition: in-depth
knowledge of local markets and profound 53% 52% 53%
relationships with clients
• Integrated model creates cost synergies and results Customer Centricity 2018 2019 2020
in a complementary & optimised product offering Other income Net interest income
• Broadening ‘one-stop shop’ offering to our clients 6
KBC Group in a nutshell (2)
High profitability Solid capital position...
Fully loaded Basel 3 CET1 ratio of KBC Group (Danish Compromise)
C/I ratio* Combined ratio Net result 16.6% * 16.6%* 17.6%
16.3% *
1440m
57% 85% EUR 2489m
10.35% Maximum Distributable Amount
57% 90% EUR 7.95% theoretical regulatory minimum
FY20 * Adjusted for specific items
FY19
1Q20 1H20 9M20 FY20
ROE (%)
22 * No IFRS interim profit recognition given more stringent ECB approach
18 17 16
14 14
8*
2014 2015 2016 2017 2018 2019
* 11% when adjusted for the collective covid-19 impairments
2020 … and robust liquidity positions
CET1 generation (in bps) before any deployment
NSFR LCR
296 277 279 271 251
193
141 * 146% 147%
136% 138%
2014 2015 2016 2017 2018 2019 2020
FY20
* 202bps when adjusted for the collective covid-19 impairments 7
FY19
Differently: the next level

KBC is the reference: The winning factors
                                    Trust                                  Personalised solutions
                                    Capitalising on the trust customers    Using data and AI to offer proactively
                                    place in us today                      compelling, relevant and personalised
                                                                           financial solutions

                                    Customer experience                    Broad offer
                                    Providing    zero-hassle,  no-frills   Emphasising our broad financial offer
                                    customer experience leveraging our     and ensuring these solutions are Bigtech
                                    unique strengths on data-security      proof (pro-active, convenient &
                                    and data-privacy                       personalised)

                                    Straight-through
                                                                           Beyond bank-insurance
                                    processes
                                                                           Staying focused on the financial wellness
                                    This implies re-design of processes    of our customers and offer services to
                                    and avoiding to digitise the current   become embedded in our customer’s
                                    ones. Aim is E2E digital processes     daily life

                                               8
, your digital assistant

Hyper personalised and trusted financial digital assistant
                                                                                      RELEVANT & VALUABLE OFFER
                                                                                       Kate will only propose offers where sufficient
                                                                                      added value is shown or when she can serve the
                                                                                       client in an important moment in the client's
     PERSONALISED & DATA DRIVEN                                                                             live
    The interaction between the customer and Kate
      will be triggered by data analysis (approval                                                                    AT THE RIGHT TIME
     granted by customer). Kate will be trained on                                                           Lead journeys driven by time or location are
               the basis of the customer’s                                                                        preferably taken care of by Kate, as
           profile, preferences and activities                                                                notifications linked to a specific location or
                                                                                                             specifying moment in time are perceived as
                                                                                                                             highly personal
                           DIGITAL FIRST & E2E
                          We will offer the client a frictionless
                        End2End digital process and in doing so                                                                             VOLUME
                       make bank/insurance simple and hassle free                                                          We want all our clients to meet Kate as much as
                                                                                                                            possible. Kate will allow us to reach out to a
                                                                                                                              sufficient volume of clients, in terms of
                                            SERVING: SECURE &
                                                                                                                              transactions and in terms of number of
 ‘No hassle, no                               FRICTIONLESS                                                                               targetable audience
                                    Kate will help the client saving time and/or
  friction, zero                    money, focusing more on the convenience
      delay’                      factor. Kate will also serve the client regarding
    Johan Thijs                                  security and fraud

                                                                                        9
Differently: the next level

The strong basis remains

                           +

                                             +

                                        10
Differently: the next level
Bank-insurance+
11Differently: the next level
Translating strategy into non-financial targets
Introducing 4 new operational targets (1)
Customer NPS ranking % bank-insurance (BI) clients
Top-2 Top-2 78% 85%
22% 27%
2020* target '23
2020 BI target '23 2020 stable BI target '23
Target is to remain the reference
(top-2 score on group level) ≥85% of active customers to be BI customers
Based on weighted avg of ranking in six core countries ≥27% of active customers to be stable BI customers
* Based on the latest available data. BI customers have at least 1 bank + 1 insurance product of our group.
Stable BI customers: at least 2 bank + 2 insurance products (Belgium: 3+3)
12Differently: the next level
Translating strategy into non-financial targets
Introducing 4 new operational targets (2)
% digital sales STP score*
(bank / insurance) (straight through processing)
40%
32% 80%
25% 60%
15% 25% 41%
2020 target '23 2020 target '23 2020 target '23 2020 target '23
bank insurance STP STP
potential
Digital sales ≥40% of bank sales
Digital sales ≥25% of insurance sales STP ≥60% and STP potential ≥80%
The STP-ratio measures how many of the services that can be offered digitally
Based on weighed avg of selected core products
are processed without any human intervention and this from the moment of
interaction by a client until the final approval by KBC.
STP potential measures what the STP-ratio would be if KBC would only have
the digital channel in its interaction with clients for a given process or product.
* Based on analysis of core commercial products.
13Our sustainability strategy
The cornerstones of our sustainability strategy and our commitment to the United Nations
Sustainable Development Goals
We apply strict sustainability rules to our business activities
adverse impact
Limiting our
in respect of human rights, the environment, business ethics
and sensitive or controversial social themes. In the light of
constantly changing societal expectations and concerns, we
review and update our sustainability policies at least every
two years.
We are focusing on areas in which we, as a bank-insurer, can
positive impact
create added value: financial literacy, entrepreneurship,
Increasing our
environmental awareness and longevity and/or health. In
doing so, we take into account the local context of our
different home markets. Furthermore, we also support social
projects that are closely aligned with our policy.
Responsible behaviour is especially relevant for a bank-
Responsible behaviour
insurer when it comes to appropriate advice and sales.
Therefore, we pay particular attention to training (including
testing) and awareness. For that reason, responsible
behaviour is also a theme at the KBC University, our senior
management training programme, in which the theory is
taught and practised using concrete situations. Senior
managers are then tasked with disseminating it throughout
the organisation.
14Our sustainability governance
Sustainability embedded in our organization
Top level responsibility for sustainability and climate strategy
• The Executive committee has the highest level of direct responsibility for
sustainability and climate change and reports on it to the Board of
Directors
• Direct responsibility of the Group CEO and Group CFO for sustainability
and climate as chairman in the different governance bodies
Nomination of country coordinators in all our core markets to effectively
implement centrally-decided strategies, senior representation of all core
countries in Internal Sustainability Board.
Specific Sustainable Finance Programme to integrate our policy on climate
change and climate action plan within the group
External advisory boards to advise and challenge us on our sustainable strategy
Sustainability integrated into our remuneration policy:
• The variable remuneration of Executive Committee members is linked to -
amongst others - progress made in the area of sustainability. The Board of
Directors, through its Remuneration Committee, assesses the criteria for
evaluating the members of the Executive Committee in this respect
• At least 10% of the variable remuneration received by senior management
depends on the achievement of individual targets agreed in advance as
part of the group’s sustainability strategy, including our climate policy
• The non-recurrent results-based bonus KBC pays its employees in Belgium
has been partially linked to our direct footprint target – reducing paper
consumption – but also to employee development (training days, digitality
and progress management) and to cybersecurity (phishing tests)
15Our sustainability ambitions
We substantially raise the bar for our climate-related ambitions
Renewable energy loans Direct coal-related finance
Volume of SRI Funds (In millions of EUR)
(In billions of EUR) (In % of total energy-sector loan portfolio)
252
30 61% 65%
57%
19 44%
17
12 86
9 Full
34 36
11 2 Exit
2018 2019 2020 1Q21 target’25 2018 2019 2020 target’30 2016 2017 2018 2019 2020 1Q21 2021
Almost doubling of SRI funds by ’25 (vs 2020) Target raised from 50% to 65% by ‘30 Proven track record in building down direct coal exposure
SRI funds ≥ 50% of new fund production by ’21 Firm commitment to exit coal, supporting existing clients
During 2021 KBC will re-evaluate this target and its in their transition. In order to remain eligible for any kind
definition of SRI funds in line with the new EU Sustainable of financing, the related client must commit not to engage
Finance Disclosure Regulation (SFDR). into any new coal project and must submit a coal-phase-
out plan
Green electricity Reduction own GHG emissions
(In % of own electricity consumption) (incl. commuter travel) Our ESG Latest Score
(In % compared to 2015) ratings: (End of April 2021)
100% 63%
78% 83% 87% 50% CDP A - Leadership
38% 80% Excl. commuter
56% FTSE4Good 4.7/5
32% 42% Incl. commuter
ISS ESG C Prime
2018 2019 2020 target’30 2018 2019 2020 Target’30 MSCI AAA
(incl. commuter travel)
Sustainalytics Low Risk (16.0): 4th percentile of
Target raised from 90% to 100% by ‘30 Target reduction of own emissions raised from 65%
388 diversified banks (risk view)
to 80% by ‘30
S&P Global - 85th percentile of 253 banks
KBC will achieve full climate neutrality as of the end
RobecoSAM assessed (within top 15%)
of 2021 by offsetting the balance
Vigeo Eiris Not publicly available
16Sustainable finance
Our commitment to contribute to a sustainable society
Sustainable finance (*) 2019 2020 Green products and business solutions :
(KBC Group, in millions of euros) Business solutions to promote energy efficiency in buildings, industrial processes
Green finance and mobility, e.g.: programmes to help companies prepare for energy audits and a
sustainable transition, EIB loan for SMEs to finance climate-improving investments
Renewable energy and biofuel sector 1 768 1 840
at discounted interest rate, green car loan and lease products, bicycle
Green mortgages* 8 817 leasing, mobility services through mobile apps, etc.
Social finance Regarding social finance we have specific departments that guide social profit
institutions and local authorities in areas such as payments, asset management and
Health care sector 5 783 6 085 financing solutions
Education sector 975 1 031 SRI as a key focus area of our sustainability strategy:
Belgian Towards Sustainability quality label for all our SRI funds
Socially Responsible Investments Clear targets: volume of SRI and % of new production (first offer and preferred
SRI funds under distribution 12 016 16 780 investment solution)
Strict exclusion criteria on top of general exclusion policies for conventional funds
Total 20 542 34 553 Positive impact by investing in companies and countries that score well on
sustainability
(*) from 2020 we extended the overview with the green mortgage volumes of Belgium, Czech
Republic, Slovakia and Ireland. This amount covers newly built houses and apartments of our SRI Advisory Board = external panel of independent experts
outstanding mortgage loans with energy labels A and B (based on the EU’s Energy Performance
of Buildings Directive)
For the sustainability report of 2020, we refer to the
KBC.COM website
17Our sustainability strategy
Our commitment to the climate, following the ‘double materiality’ approach
FINANCIAL MATERIALITY* ENVIRONMENTAL & SOCIAL MATERIALITY
Committed to manage the impact of climate change on our Committed to manage the direct and indirect impact of our company
company on climate
Company impact on climate
Climate change impact can be financially material Company impact on
on company climate
Impact on our business as a financial institution, in the shape of both Direct environmental impact through our own operations
transition and physical risks and opportunities arising from climate Indirect impact on the climate through financing, investing and insuring
change other parties who could have a direct impact on the climate
We are committed to manage our direct environmental impact and we have substantially raised our ambitions in relation
to our direct environmental footprint
We apply strict sustainability policies with respect to human rights, environment, climate and biodiversity, business ethics
and sensitive/ controversial societal issues. KBCs sustainability policies are regularly reviewed, i.e. at least every two years
or more frequently if necessary, and challenged by independent experts in various domains (External Sustainability Board)
Updated strategies on the most carbon-intensive industrials sectors and product-lines (5 out of 11 assessed in 2020) of our
lending book. First results and new & updated targets where relevant are presented in so-called white papers for the
energy, commercial real estate and agriculture sectors, as well as for the following product lines: mortgage loans and car
leasing
Ongoing methodological tracks to understand the potential financial impact of climate-related transition risks on our
lending and investment activities and implement new measuring instruments. Based on these methodologies, KBC will be
able to publish clear quantitative targets by the end of 2022, in line with the Paris Agreement
We report on our ongoing climate actions in accordance with the four pillars of the TCFD Framework and in line with our
commitment to the Collective Commitment to Climate Action
**
* Financial materiality is used here in the broad sense of affecting the value of the company, not
just in the sense of affecting financial measures recognised in the financial statements.
18
** S&P Trucost Limited © Trucost 2021Contents
1. Strategy and business profile
BREAKDOWN OF ALLOCATED CAPITAL
2. Financial performance BY BUSINESS UNIT AS AT
31 March 2021
3. Solvency, liquidity and funding
4. Covid-19 Czech Republic
15%
5. Covered bond programme
Belgium 62%
6. Green bond framework
22%
7. Looking forward International Markets
2%
Appendices Group Centre
191Q 2021 key takeaways
1Q21
1Q21 financial performance
ROE 16%*
Commercial bank-insurance franchises in core
Cost-income ratio excluding bank taxes
markets performed very well
46%
Customer loans and customer deposits increased Combined ratio 78%
y-o-y in most of our core countries Credit cost ratio -0.17% (-0.11% without
Higher net interest income and net interest margin collective Covid-19 impairments**)
Common equity ratio 17.6% (B3, DC, fully loaded)
Higher net fee and commission income Excellent Leverage ratio 5.8% (fully loaded)
Higher net gains from financial instruments at fair net result NSFR 148% & LCR 157%
value and higher net other income of 557m Net result
Higher sales of non-life and life insurance y-o-y EUR in 697
538 557
Strict cost management, but higher bank taxes 1Q21
210
(recognized upfront)
Net impairment releases -5
1Q20 2Q20 3Q20 4Q20 1Q21
Solid solvency and liquidity * when evenly spreading the bank tax throughout the year
Comparisons against the previous quarter unless otherwise stated ** Collective Covid-19 impairments lowered from 783m EUR at
end 2020 to 757m EUR at end 1Q21
20Net result at KBC Group
CONTRIBUTION OF BANKING ACTIVITIES
TO KBC GROUP NET RESULT*
546
437 412
NET RESULT AT KBC GROUP*
42
697
-11
538 557 1Q20 2Q20 3Q20 4Q20 1Q21
210 CONTRIBUTION OF INSURANCE ACTIVITIES
TO KBC GROUP NET RESULT*
173 157
-5
1Q20 2Q20 3Q20 4Q20 1Q21 147
133
119 134
74 101
3 85 73 70 56
36
-20 -31 -12 -11
* Difference between net result at KBC Group and the sum of the banking and insurance -13 -50
contribution is accounted for by the holding-company/group items
1Q20 2Q20 3Q20 4Q20 1Q21
Non-Life result Non-technical & taxes
Amounts in m EUR 21
Life resultHigher net interest income and net interest margin
NII Amounts in m EUR Net interest income (1,068m EUR)
1,195 • NII increased by 1% q-o-q excluding the positive one-off item at NII
1,083 1,122 1,067 1,068
111 1 17 15 insurance of 5m EUR in 4Q20
106 6 131 105 1 14 98 16
• NII banking increased by 1% q-o-q, driven primarily by:
o organic loan volume growth
1,066 971 977 947 954 o higher margin on new production mortgages than the margin on the
outstanding portfolio in Belgium and Slovakia
o intensified charging of negative interest rates on certain current accounts
-1 to corporates and SMEs
1Q20 2Q20 3Q20 4Q20 1Q21 o lower funding costs
NII - netted positive impact of ALM FX swaps* NII - Insurance
o +7m EUR NII due to the consolidation of OTP SK (as of 1Q21)
NII - Holding-company/group NII - Banking o appreciation of the CZK versus the EUR
NIM ** o slightly higher netted positive impact of ALM FX swaps
1.97% partly offset by:
1.82%
o lower reinvestment yields
1.81%
1.75% 1.78% o lower number of days (-15m EUR q-o-q)
• The 11% y-o-y NII decrease was mainly the result of the CNB rate
cuts, the depreciation of the CZK & HUF versus the EUR, the negative
impact of lower reinvestment yields and a 12m EUR positive one-off
in 1Q20
1Q20 2Q20 3Q20 4Q20 1Q21 Net interest margin (1.78%)
* From all ALM FX swap desks • Increased by 3 bps q-o-q and decreased by 19 bps y-o-y for the
** NIM is calculated excluding the dealing room and the net positive impact of ALM FX swaps & repos reasons mentioned above
ORGANIC VOLUME TREND Total loans** o/w retail mortgages Customer deposits*** AuM Life reserves
Volume 161bn 73bn 232bn 220bn 28bn
Growth q-o-q* +1% +1% +8% +4% +1%
Growth y-o-y +1% +8% +10% +14% +3%
* Non-annualised ** Loans to customers, excluding reverse repos (and bonds). Growth figures are excluding FX, consolidation adjustments, reclassifications and collective Covid-19 ECL
*** Customer deposits, including debt certificates but excluding repos. Customer deposit volumes excluding debt certificates & repos +4% q-o-q and +12% y-o-y
22Higher net fee and commission income
F&C* Amounts in m EUR Net fee and commission income (441m EUR)
• Up by 9% q-o-q and by 3% y-o-y
429 441
388 390 403 • Q-o-q increase was the result of the following:
229
o Net F&C income from Asset Management Services increased by
225
214 213 223 11% q-o-q as a result of higher management fees and entry fees
from mutual funds and unit-linked life insurance products
o Net F&C income from banking services rose by roughly 3% q-o-q
284
275 241 250 256 as higher securities-related fees and higher network income
were partly offset by lower fees from payment services (partly
-71 -68 -73 -77 -72 seasonal effect, partly due to stricter Covid-19 lockdowns) and
1Q20 2Q20 3Q20 4Q20 1Q21 lower fees from credit files & bank guarantees. Note that the
consolidation of OTP SK (as of 1Q21) contributed 2m EUR
Distribution Banking services Asset management services o Distribution costs fell by 5% q-o-q due chiefly to lower
* The building blocks of the 2020 F&C figures were restated, resulting in a shift of roughly 5m EUR per quarter commissions paid linked to banking products and decreased life
from Banking services to Asset Management services, related to F&C income from CSOB CZ Pension company insurance sales
• Y-o-y increase was mainly the result of the following:
Amounts in bn EUR
o Net F&C income from Asset Management Services rose by 3%
AuM y-o-y as a result of higher management fees, partly offset by
220
lower entry fees
212
202 204 o Net F&C income from banking services increased by 2% y-o-y
193
(+3% y-o-y excluding FX effect) driven mainly by higher
securities-related fees, higher network income and higher fees
from credit files & bank guarantees, partly offset by lower fees
from payment services
o Distribution costs rose by 3% y-o-y
1Q20 2Q20 3Q20 4Q20 1Q21 Assets under management (220bn EUR)
• Increased by 4% q-o-q due to net inflows (+1%) and a positive price
effect (+3%)
23
• Increased by 14% y-o-y due almost entirely to a positive
price effectInsurance premium income up y-o-y
and excellent combined ratio
PREMIUM INCOME (GROSS EARNED PREMIUMS) Insurance premium income (gross earned
832
premiums) at 745m EUR
740 712 715 745 • Non-life premium income (453m EUR) increased by
297 267
382
292
2% y-o-y
276
• Life premium income (292m EUR) fell by 24% q-o-q
and by 2% y-o-y
443 435 448 450 453
1Q20 2Q20 3Q20 4Q20 1Q21
Life premium income Non-Life premium income
COMBINED RATIO (NON-LIFE) The non-life combined ratio for 1Q21
amounted to an excellent 78% (90% in 1Q20).
90%
78% 83% 83% 85% This is the result of 2% y-o-y earned premium
growth combined with 17% y-o-y lower
technical charges. The latter was due mainly to
lower storm claims (6m EUR in 1Q21
compared with 51m EUR in 1Q20) and lower
normal claims (especially in ‘Motor’, due
1Q 1H 9M FY largely to Covid-19), partly offset by higher
major claims (especially in ‘General third-party
2020 2021
liability’)
Amounts in m EUR
24Non-life and life sales up y-o-y
NON-LIFE SALES (GROSS WRITTEN PREMIUM) Sales of non-life insurance products
567 590 • Up by 4% y-o-y chiefly in classes ‘Fire’, ‘General third-
party liability’ and ‘Workmen’s compensation’
415 416 405
1Q20 2Q20 3Q20 4Q20 1Q21
Sales of life insurance products
• Decreased by 19% q-o-q and increased by 10% y-o-y
• The q-o-q decrease was driven by both lower sales of
LIFE SALES guaranteed interest products in Belgium (attributable
561 582 chiefly to traditionally higher volumes in tax-incentivised
471 pension savings products in 4Q20) and unit-linked
427 420
235 326 products in Belgium and the Czech Republic
254
249 214 • The y-o-y increase was driven mainly by higher sales of
unit-linked products in Belgium (chiefly due to the strong
327
177 205 256 217 performance in Private Banking and CBC in 1Q21)
• Sales of unit-linked products accounted for 46% of total
1Q20 2Q20 3Q20 4Q20 1Q21 life insurance sales in 1Q21
Guaranteed interest products Unit-linked products
Amounts in m EUR
25Higher FIFV and higher net other income
253 FIFV The q-o-q increase in net gains from financial
126
instruments at fair value was attributable mainly
85 80
127 to:
42 75
100 19
45 25
• higher dealing room & other income
55
-3 31 -2 13 -30
23 -7 35 • a positive change in ALM derivatives
-58
• a higher net result on equity instruments (insurance)
-186 partly offset by:
• lower credit and funding value adjustments due to stable
-59 counterparty credit and KBC funding spreads in 1Q21
-82 versus decreasing counterparty credit and KBC funding
spreads in 4Q20, which more than offset the effect of
-385 lower derivative exposures (increasing yield curve) and
1Q20 2Q20 3Q20 4Q20 1Q21
higher market value adjustments
Dealing room & other income M2M ALM derivatives o FVA: 8m EUR (-10m EUR q-o-q)
MVA/CVA/FVA Net result on equity instruments (overlay insurance) o CVA: 18m EUR (-13m EUR q-o-q)
o MVA: -2m EUR (+2m EUR q-o-q)
NET OTHER INCOME
50
53 53
Net other income amounted to 53m EUR, more or
37 37 less in line with the normal run rate of around 50m
EUR per quarter
1Q20 2Q20 3Q20 4Q20 1Q21
Amounts in m EUR
26Strict cost management, higher bank taxes
The C/I ratio excluding bank taxes amounted to 46%
OPERATING EXPENSES in 1Q21
1,338 1,320
Operating expenses excluding bank taxes decreased
407
988 424 by 5% q-o-q primarily as a result of:
904 926
27 21 49 o lower staff expenses
o seasonally lower marketing costs and professional fees
partly offset by:
931 905 939
877 896 o 8m EUR costs due to the consolidation of OTP SK (as of
1Q21)
o appreciation of the CZK versus the EUR
1Q20 2Q20 3Q20 4Q20 1Q21
Operating expenses excluding bank taxes decreased
Bank tax Operating expenses by 4% y-o-y due chiefly to:
Amounts in m EUR • lower staff expenses (despite consolidation of OTP SK in
1Q21)
BANK TAX SPREAD IN 2021 (PRELIMINARY)** • cost savings triggered by Covid-19, such as lower marketing
TOTAL Upfront Spread out over the year & facilities costs and lower professional fees
• lower software depreciations
1Q21 1Q21 1Q21 2Q21e 3Q21e 4Q21e • depreciation of the CZK & HUF versus the EUR
BE BU 311 311 0 0 0 0
Cost/income ratio (group) adjusted for specific items*
CZ BU 50 50 0 0 0 0 at 53% in 1Q21 (57% in FY20). Cost/income ratio
Hungary 44 25 18 21 22 23 (group): 68% in 1Q21, distorted by bank taxes
Slovakia 6 3 3 0 0 1 Our FY21 guidance for opex excluding bank taxes
Bulgaria 9 9 0 0 0 0 remains unchanged: +2% y-o-y like-for-like
Ireland 4 3 1 1 1 20 Total bank taxes (including ESRF contribution) are
GC 0 0 0 0 0 0 expected to increase by 2% y-o-y to 512m EUR in FY21
TOTAL 424 402 22 22 23 44 27
* See glossary (slide 95) for the exact definition
Amounts in m EUR ** Still subject to changesNet impairment releases and excellent credit cost ratio
857 ASSET IMPAIRMENT
12 Net impairment releases
141 • Next to a 26m EUR reversal of collective Covid-19 ECL (lowering
746
20
122 the total collective Covid-19 impairments from 783m EUR at end
43 63 66 2020 to 757m EUR at end 1Q21), 1Q21 also benefited from
11
78 99
57 57 impairment releases in some corporate files in Belgium and the
-5 -1 -26 -1 Czech Republic
-50
-77
• 1m EUR impairment release on ‘other’
1Q20 2Q20 3Q20 4Q20 1Q21
Other impairments Impairments on financial assets at AC and FVOCI
Collective Covid-19 ECL
CREDIT COST RATIO
0.60%
The credit cost ratio in 1Q21 amounted to:
0.44% • -11 bps (16 bps in FY20) without collective Covid-19 ECL
0.23%
0.09% 0.12% • -17 bps (60 bps in FY20) with collective Covid-19 ECL
0.16%
-0.04% -0.06%
-0.06%
-0.17% -0.11%
FY15 FY16 FY17 FY18 FY19 FY20 1Q21
CCR with collective Covid-19 ECL CCR without collective Covid-19 ECL
IMPAIRED LOANS RATIO
3.4%
The impaired loans ratio amounted to 3.3%, 1.8% of which
3.3% 3.3%
3.2% 3.3%
over 90 days past due
1.9% 1.9% 1.8% 1.8% 1.8%
1Q20 2Q20 3Q20 4Q20 1Q21
28
Amounts in m EUR Impaired loans ratio of which over 90 days past dueLoan loss experience at KBC
1Q21 FY20 FY19 FY18 FY17 AVERAGE
CREDIT COST CREDIT COST CREDIT COST CREDIT COST CREDIT COST ‘99 –’20
RATIO RATIO RATIO RATIO RATIO
Belgium -0.21% 0.57% 0.22% 0.09% 0.09% n/a
Czech Republic -0.16% 0.67% 0.04% 0.03% 0.02% n/a
International
0.00% 0.78% -0.07% -0.46% -0.74% n/a
Markets
Group Centre -0.09% -0.23% -0.88% -0.83% 0.40% n/a
Total -0.17% 0.60% 0.12% -0.04% -0.06% 0.43%
Credit cost ratio: amount of losses incurred on troubled loans as a % of total average outstanding loan portfolio
29Impaired loans ratios, of which over 90 days past due
KBC GROUP BELGIUM BU
3.4% 2.4% 2.4%
3.3% 3.3% 3.3% 2.2% 2.3%
3.2% 2.2%
1.9% 1.9% 1.8% 1.8% 1.8% 1.1% 1.2% 1.2% 1.2%
1.1%
1Q20 2Q20 3Q20 4Q20 1Q21 1Q20 2Q20 3Q20 4Q20 1Q21
Impaired loans ratio
Of which over 90 days past due
CZECH REPUBLIC BU INTERNATIONAL MARKETS BU
2.3% 8.2%
2.2% 2.2% 2.2% 7.8%
2.1% 7.2% 6.9% 6.7%
1.2% 4.9% 4.8% 4.5%
1.1% 1.1% 1.0% 1.0% 4.2% 4.0%
1Q20 2Q20 3Q20 4Q20 1Q21 1Q20 2Q20 3Q20 4Q20 1Q21
30Cover ratios
KBC GROUP BELGIUM BU
62.4% 61.7% 63.5% 63.0% 65.9% 68.3% 67.4%
60.4% 65.4%
62.6%
43.4% 44.8% 45.2% 44.7% 42.9% 46.4%
44.9% 45.4% 45.6%
41.3%
1Q20 2Q20 3Q20 4Q20 1Q21 1Q20 2Q20 3Q20 4Q20 1Q21
Impaired loans cover ratio
Cover ratio for loans with over 90 days past due
CZECH REPUBLIC BU INTERNATIONAL MARKETS BU
70.1% 69.8% 47.0% 48.7% 47.4% 48.0%
66.9% 66.0% 66.1% 46.5%
49.2% 48.7% 49.3% 35.2% 34.0% 34.4% 34.7%
47.2% 47.2% 32.4%
1Q20 2Q20 3Q20 4Q20 1Q21 1Q20 2Q20 3Q20 4Q20 1Q21
31Overview of contribution of business units to 1Q21 result
Amounts in m EUR
NET PROFIT – KBC GROUP
1Q21 ROAC: 19%
2,575 2,570 2,489
1,945 2,014 1,440
2,059
1,445 557
630 556 430
-5
2017 2018 2019 2020 2021
2Q-4Q 1Q
NET PROFIT – BELGIUM NET PROFIT – CZECH REPUBLIC NET PROFIT – INTERNATIONAL MARKETS
1Q21 ROAC: 21% 1Q21 ROAC: 28% 1Q21 ROAC: 14%
1,575
1,450
1,344 789
702
1,001 654
533
1,274 444
1,207 612 379
1,168 521 483 375
1,087 396
380 330
309 199
287
301 123 164 88
243 176 181 171 177 137
88 114 70
-86 35
2017 2018 2019 2020 2021 2017 2018 2019 2020 2021 2017 2018 2019 2020 2021
2Q-4Q 1Q 2Q-4Q 1Q 2Q-4Q 1Q
32Balance sheet
KBC Group consolidated at the end of March 2021
Total assets Total liabilities and equity
(EUR 352bn) (EUR 352bn)
161
Credit quality 197 Capital adequacy &
liquidity position
68
22
14 35
4
19
6 13
105
60
Loan book (loans and advances to customers) Deposits from customers
Investment portfolio (equity and debt securties) Equity (including AT1)
Insurance investment contracts Other MREL instruments and debt certificates
Trading assets Technical provisions, before reinsurance NL and L
Other (incl. interbank loans, reverse repos, Liabilities under insurance investment contracts
property & equipment etc...) Trading liabilities
Other (incl. interbank deposits)
33Balance sheet:
Loans and deposits continue to grow in most countries
BE 14% 14%
8% 9% 6%
Y-O-Y ORGANIC* VOLUME GROWTH -1% Loans** Retail Deposits***
Loans** Retail Deposits*** mortgages
mortgages 24%
13%
10% 10% 11%
8% 6%
CR
0%
1% 4% Loans** Retail Deposits*** Loans**** Retail Deposits***
mortgages mortgages
Loans** Retail Deposits*** 19%
mortgages
14% 14%
4% 4%
-1%
Loans** Retail Deposits*** Loans** Retail Deposits***
* Volume growth excluding FX effects, divestments/acquisitions and collective Covid-19 ECL mortgages
** Loans to customers, excluding reverse repos (and bonds) mortgages
*** Customer deposits, including debt certificates but excluding repos 34
**** Total customer loans in Bulgaria: new bank portfolio +12% y-o-y, while legacy -17% y-o-ySectorial breakdown of outstanding loan portfolio (1)
(180bn EUR*) of KBC Bank Consolidated
Services
11%
Distribution Oil, gas & other fuels
Electricity
7% Hotels, bars & restaurants
Shipping 0.8% 1.5%
0.6% 0.5%
Machinery & heavy equipment Food producers
Private Persons 44%
0.9% 1.8%
13% Rest
Chemicals 1.4%
6% 1.4%
Real estate Metals 4.4%
7% Other sectors
3% 3%
3% 4% Finance & insurance
Automotive Building & construction
Agriculture, farming, fishing Authorities
* It includes all payment credit, guarantee credit (except for confirmations of letters of credit and similar export/import related commercial credit), standby credit and credit
derivatives, granted by KBC to private persons, companies, governments and banks. Bonds held in the investment portfolio are included if they are corporate or bank issued,
hence government bonds and trading book exposure are not included
* Outstanding amount includes all on-balance sheet commitments and off-balance sheet guarantees
35Geographical breakdown of the outstanding loan portfolio (2)
(180bn EUR*) of KBC Bank Consolidated
Asia
North America
Rest
Other CEE
Other W-Eur 1.6%
0.2%
Bulgaria 7.4% 1.4%
1.4%
Hungary 2.2%
3.3%
Slovakia
5.7%
Ireland 5.9% 54.2%
16.8% Belgium
Czech Rep.
* It includes all payment credit, guarantee credit (except for confirmations of letters of credit and similar export/import related commercial credit), standby credit and credit
derivatives, granted by KBC to private persons, companies, governments and banks. Bonds held in the investment portfolio are included if they are corporate or bank issued,
hence government bonds and trading book exposure are not included
* Outstanding amount includes all on-balance sheet commitments and off-balance sheet guarantees
36Contents
1. Strategy and business profile
2. Financial performance
3. Solvency, liquidity and funding
4. Covid-19
5. Covered bond programme
6. Green bond framework
7. Looking forward
Appendices
37Strong capital position (1)
Fully loaded Basel 3 CET1 ratio at KBC Group (Danish Compromise)
The fully loaded common equity ratio
stabilised q-o-q at 17.6% at the end of 1Q21
*
* *
17.6% 17.6% based on the Danish Compromise
16.3%
*
* 16.6% 16.6%
KBC’s CET1 ratio of 17.6% at the end of 1Q21
represents a solid capital buffer:
• 9.7% capital buffer compared with the current
theoretical minimum capital requirement of
10.45% OCR 7.95% (as a result of the announced ECB and
10.34% MDA
National Bank measures which provided
significant temporary relief on the minimum
7.95% theoretical regulatory minimum capital requirements)
• 7.3% capital buffer compared with the
Maximum Distributable Amount (MDA) of
10.34% (given small shortfall in AT1 bucket)
• 7.2% capital buffer compared with the Overall
Capital Requirement (OCR) of 10.45% (which still
includes the 2.50% capital conservation buffer on
top of the 7.95%)
1Q20 1H20 9M20 FY20 1Q21
At the end of 1Q21, the impact of the
* No IFRS interim profit recognition given the more stringent ECB approach
application of the transitional measures
resulted in a positive impact on CET1 ratio of
51 bps compared to fully loaded (transitional
Total distributable items (under Belgian GAAP) KBC Group 10.4bn EUR at 1Q21, of
which:
CET1 ratio amounted to 18.1% at the end of
• available reserves: 949m 1Q21)
• accumulated profits: 9 260m
38Strong capital position (2)
Fully loaded Basel 3 total capital ratio (Danish Compromise)
21.2% 21.2% *
*
19.7%
* * 19.8%
* 19.8% * 2.1% T2
2.1% T2
1.9% T2 1.8% T2 1.8% T2
1.5% AT1 1.5% AT1
1.5% AT1 1.5% AT1 1.5% AT1
The fully loaded total capital ratio
stabilised q-o-q at 21.2% at the end of
16.6% CET1 16.6% CET1
17.6% CET1 17.6% CET1 1Q21
16.3% CET1
1Q20 1H20 9M20 FY20 1Q21
* No IFRS interim profit recognition given more stringent ECB approach
39Fully loaded Basel 3 leverage ratio and Solvency II ratio
Fully loaded Basel 3 leverage ratio at KBC Group Fully loaded Basel 3 leverage ratio at KBC Bank
6.5% * 6.4%
6.0% * 5.9% * 5.8% * * *
5.2% 5.2% *
4.8% * 4.8% * 4.7%
1Q20 1H20 9M20 FY20 1Q21 1Q20 1H20 9M20 FY20 1Q21
* No IFRS interim profit recognition given more stringent ECB approach * No IFRS interim profit recognition given more stringent ECB approach
The decrease of the leverage ratio was mainly the result of increased short-term money market and repo
opportunities
Solvency II ratio
FY20 1Q21 The q-o-q delta in the Solvency II ratio was mainly
driven by an increase of the interest rates combined
Solvency II ratio 222% 235% with a steepening of the yield curve
40Strong and growing customer funding base with liquidity
ratios remaining very strong
KBC Bank continues to have a strong retail/mid-cap deposit base in its core markets – resulting in a stable funding mix with a significant portion of the funding
attracted from core customer segments and markets
Drop in % customer funding as growth in interbank/CD/secured funding was even outpacing growth in customer funding – monetising several short-term money
market and repo opportunities
KBC Bank participated to the TLTRO III.7 transaction for an amount of 2.2bn EUR in March 2021 (bringing the total TLTRO exposure to 24.2bn EUR), which is reflected
in the ‘Interbank Funding’ item below
9% 10% 11% 10% 8% Funding from customers (m EUR) of KBC Banking Group
1% 13% 13%
1%
8% 4% 2% 6% 7%
6% 6% 1% 4%
8% 8% 6%
8% 8% 192.970 199.162
8% 8% 8% 155.774 163.824 176.045
3% 7% 4% 7% 139.560 143.690
7% 9% 2% 5%
FY15 FY16 FY17 FY18 FY19 FY20 1Q21
5%
71% 69% 72% 70% Retail and SME
63% 63% 65%
12% Mid-cap
65% Government and PSE
customer
driven
83%
FY15 FY16 FY17 FY18 FY19 FY20 1Q21
Interbank Funding Debt issues placed at institutional relations Certificates of deposit
Secured Funding Total Equity Funding from Customers
Ratios FY20 1Q21 Regulatory requirement
NSFR is at 148% and LCR is at 157% by the end of 1Q21
• Both ratios were well above the regulatory requirement of 100% due
NSFR* 146% 148% ≥100%
to a strong growth in customer funding and the participation to
LCR** 147% 157% ≥100% TLTRO III
* Net Stable Funding Ratio (NSFR) is based on KBC Bank’s interpretation of the proposal of CRR amendment.
** Liquidity Coverage ratio (LCR) is based on the Delegated Act requirements. From EOY2017 onwards, KBC
Bank discloses 12 months average LCR in accordance to EBA guidelines on LCR disclosure. 41Upcoming mid-term funding maturities
Breakdown Funding Maturity Buckets In May 2020, KBC Bank issued a covered bond for an amount of
(Including % of KBC Group’s balance sheet) 1bn EUR with a 5.5-year maturity
7000 In June 2020, KBC Group issued its second Green senior
benchmark for an amount of 500m EUR with a 7-year maturity
6000
with call date after 6 years
1.5%
5000 In September 2020, KBC Group issued a senior benchmark for an
amount of 750m EUR with a 6-year maturity with call date after 5
m EUR
4000
years
0.8%
3000 0.7% In January 2021, KBC Group issued a senior benchmark for an
0.6 % 0.6% amount of 750m EUR with an 8-year maturity with call date after
0.5%
2000 0.4% 7 years
0.3%
1000
0 KBC Bank has 6 solid sources of long-term funding:
2021 2022 2023 2024 2025 2026 2027 >= 2028
• Retail term deposits
Senior Unsecured - Holdco Senior Unsecured - Opco Subordinated T1 Subordinated T2 Covered Bond
• Retail EMTN
• Public benchmark transactions
• Covered bonds
• Structured notes and covered bonds using the private
36%
Total placement format
42%
outstanding • Senior unsecured, T1 and T2 capital instruments issued at KBC
= 18.9bn EUR Group level and down-streamed to KBC Bank
12%
8% 2%
42KBC has strong buffers cushioning Sr. debt at all levels (1Q21)
KBC Group
Senior
6 514
Tier 2
2 180
KBC Bank Additional Tier 1 KBC Insurance
1 500
Subordinated on loan by KBC Group Tier 2
6 014 CET1 (transitional) 500
18 589
Tier 2 Parent shareholders equity
118 1 681 Buffer for Sr. level 22.3 bn EUR 3 884
Additional Tier 1
1 500
CET1 (transitional)
14 663
Buffer for Sr. level 23.9bn EUR
Legacy T2 issued by KBC Bank will disappear over time
43
nominal amounts in million EURKBC complies with resolution requirements
New MREL targets applicable as from 01-01-2024, with intermediate targets as from 01-01-2022
The resolution plan for KBC is based on a Single Point of Entry (SPE) approach at KBC Group level, with bail-in as the preferred resolution tool
The SRB communicated to KBC new draft MREL targets (under BRRD2), expressed as a percentage of Risk Weighted Assets (RWA) and Leverage
Ratio Exposure Amount (LRE), which will replace the current MREL target of 9.67% of TLOF (which needed to be achieved by 31-12-2021)
The new binding MREL targets are:
22.13% of RWA as from 01-01-2024 with an intermediate target of 21.63% as from 01-01-2022 (the CBR needs to be met on top)
7.34% of LRE as from 01-01-2022
Targets In % of RWA In % of LRE Actuals In % of RWA In % of LRE
MREL + CBR 26.33% 28.1bn 27.4% 8.3%
CBR 4.20% CBR
MREL target 22.13% 6.0bn 5.9% 1.8% HoldCo senior
7.34%
MCC 4.27% - 0.9375% 2.0bn 1.9% 0.6% T2
@ 94,6% RWA & LRE
Add-on up to 8% TLOF
1.75% P2R 1.5bn 1.5% 0.4% AT1
RCA 3% P1
8% P1
6.6 6.6 6.6
18.6bn
% 18.1%
% 5.5%
% CET1
1.75% P2R
@ 100% RWA & LRE
LAA 3% P1
8% P1
1Q21 1Q21 1Q21
TLOF Total Liabilities and Own Funds LAA Loss Absorbing Amount RCA ReCapitalisation Amount
44
MCC Market Confidence Charge = CBR (4.27% as at 2Q 2020) minus 93.75 bps; the discount will decrease in the next years to reach the BRRD2 reference level of CBR minus the Countercyclical Buffer
CBR Combined Buffer Requirement = Conservation Buffer (2.5%) + O-SII buffer (1.5%) + Countercyclical Buffer (0.20%), comes on top of the MREL targetAvailable MREL as a % of RWA and LRE (BRRD2)
Available MREL as a % of RWA Available MREL as a % of LRE
27.9% 27.4% 9.5% 9.3% 9.3%
26.2% 25.6% 25.6% 26.3% 8.6% 8.7% 8.3%
FY19 1Q20* 1H20** 9M20** FY20** 1Q21** FY19 1Q20* 1H20** 9M20** FY20** 1Q21**
The MREL ratio decreased both in % of RWA and in % of LRE as 1.25bn EUR available MREL instruments became
ineligible (as their maturity date is now < 1 year), only partly offset by a 750m EUR Senior Holdco issuance in 1Q21
Furthermore, increased short-term money market and repo opportunities also impacted available MREL as a % of LRE
* Taking into account the withdrawal of the final gross dividend over 2019 profit of 2.5 EUR per share
** As of 1H20, MREL ratio includes the impact of IFRS9 transitional measures
45Latest credit ratings
Moody’s S&P Fitch
Senior Unsecured Baa1 A- A
Tier II - BBB BBB+
Group
Additional Tier I Ba1 BB+ BBB-
Short-term P-2 A-2 F1
Outlook Stable Negative Negative
Covered Bonds Aaa - AAA
Senior Unsecured A1 A+ A+
- BBB -
Bank
Tier II
Short-term P-1 A-1 F1
Outlook Stable Stable Negative
-
Insurance
Financial Strength Rating - A
Issuer Credit Rating - A -
Outlook - Negative -
Latest updates triggered by the COVID-19 pandemic:
• 23 Apr 2020: S&P revised KBC Group and KBC Insurance outlook to negative. The outlook for KBC Bank remains Stable because of the
substantial buffers of already existing bail-in-able debt.
• 30 Mar 2020: Fitch revised KBC Group and KBC Bank outlook to negative. Next to that, driven by methodology changes, Fitch
downgraded Tier 2 debt by one notch to ‘BBB+ and upgraded AT1 debt by one notch to ‘BBB-’.
46Contents
1. Strategy and business profile
2. Financial performance
3. Solvency, liquidity and funding
4. Covid-19
5. Covered bond programme
6. Green bond framework
7. Looking forward
Appendices
47KBC Group
Section 2
Covid-19
48COVID-19 (1/9)
The government & sector measures in each of our core countries are unchanged q-o-q
Belgium Czech Republic Hungary
Opt-in: 3 months for consumer finance , 6-9 Opt-in: 3 or 6 months Opt-out: a blanket moratorium originally until 31
months for mortgages and non-retail loans Application period finished on 30 Sep 2020, however end Dec 2020
Deferral of payments
(originally until 31 Oct 2020) of Oct 2020 all deferrals expired Extension of the deferral period until 30 Jun 2021
Application period extended for a second time (to 31 • Applicable for retail and non-retail clients • Applicable for retail and non-retail clients
Mar 2021). All deferrals to expire at the end of June • For private persons and entrepreneurs: deferral • Extension conditions are the same as the
(max. total deferral period of 9 months) of principal and interest payments, while only original moratorium
• For private persons: deferral of principal and deferral of principal payments for non-retail • Deferral of principal and interest payments
interest payments, while only deferral of clients • Interest is accrued over the deferral period, but
principal payments for non-retail clients • Interest is accrued over the deferral period, but unpaid interest cannot be capitalised and must
• Interest is accrued over the deferral period, must be paid in the final instalment, resulting in a be collected on a linear basis during the
apart from families with net income of less modification loss for the bank (-5m EUR, booked in remaining (extended) lifetime. This resulted in
than 1,700 EUR. For the latter group, this 2Q20) a modification loss for the bank (-18m EUR
results in a modification loss for the bank • For consumer loans, the interest during the booked in 1Q20; revised to -11m EUR in 2Q20 and
(-11m EUR booked in 2Q20) deferral period may not exceed the 2-week repo increased to -12m EUR in 4Q20 due to the extension)
rate + 8%
• A state guarantee scheme of up to 40bn EUR • The Czech-Moravian Guarantee and Development • A guarantee scheme is provided by
to cover losses incurred on future non-retail Bank (CZMRB) launched several guarantee Garantiqa and the Hungarian Development
loans granted before 31 Dec 2020 to viable programs (COVID II, COVID II Praha, COVID III) for Bank. These state guarantees can cover up
Guarantee Scheme &
companies, with a tenor of max. 12 months working capital loans provided by commercial banks
liquidity assistance
to 90% of the loans with a maximum term of
and a maximum interest rate of 1.25%. to non-retail clients. The loan amount is 6 years
Guarantee covers 50% of losses above 3% of guaranteed up to 80% or 90% of the loan amount. • Funding for growth scheme (launched by
total credit losses and 80% above 5% of losses Interest on these loans is subsidised up to 25% MNB): a framework amount of 4.2bn EUR
• As of 3Q, a revised state guarantee scheme of (COVID II). COVID III extended until year-end 2021 for SMEs that can receive loans with a 20-
up to 10bn EUR has been in place to cover • The Export Guarantee and Insurance Corporation year tenor and at a maximum interest rate
losses on future SME loans granted before 31 (EGAP) under its COVID Plus program offers of 2.5%
Dec 2020 (extended until Jun 2021), with a guarantees on loans provided by commercial banks. • Annual interest rate on personal loans
tenor between 1 and 3 years (extended to 5 EGAP guarantees up to 90% of the loan amount, granted by commercial banks may not
years) and with a maximum interest rate of 2% depending on the rating of the debtor. The program exceed the central bank base rate by more
(or 2.5% if tenor > 3 years). Guarantee covers is aimed at companies in which exports accounted than 5pp (until 31 Dec 2020)
for more than 20% of turnover in 2019
80% of all losses 49COVID-19 (2/9)
The government & sector measures in each of our core countries are unchanged q-o-q
Slovakia Bulgaria Ireland
Opt-in: 9 months or 6 months (for leases) Opt-in: 9 months (deferral until 31 Dec 2021 at Opt-in: 3 to 6 months
Deferral of payments
Application period is still running (but most the latest) Application period expired on 30 Sep 2020
payment holidays ended in 1Q 2021) Application period expired on 31 Mar 2021 • Applicable for mortgage loans, consumer
• Applicable for retail customers, SMEs and • Applicable for retail and non-retail customers finance loans and business banking loans
entrepreneurs • Deferral of principal with or without deferral with a repayment schedule
• Deferral of principal and interest payments of interest payments • Deferral of principal and interest payments
• Interest is accrued over the deferral period, but • For both, full and partial deferrals, the tenor is for up to 6 months (with review after 3
the customer has the option of paying all extended by 9 months (or 6+3) months) for mortgages & consumer finance
interest at once after the moratorium or paying • Interest is accrued over the deferral period and 3 months for business banking loans
it on a linear basis. The latter option would and repaid in 12 months for consumers; in 18 • Option for customers to extend their loan
result in an immaterial modification loss for the months (or 12+6) for non-retail or 60 months term by up to 6 months to match the
bank for mortgages in equal instalments payment holiday
• Interest is accrued over the deferral period
• Anti-Corona Guarantee program offered by the • 0.4bn EUR of state guarantees provided • The Irish authorities put substantial relief
Slovak Investment Holding (SIH) and aimed at by the Bulgarian Development Bank to measures in place, amongst other
Guarantee Scheme &
liquidity assistance
SMEs, consists of two components: (i) an 80% commercial banks. Of this amount, measures, via the SBCI. KBC Bank Ireland is
state guarantee with a 50% portfolio cap and (ii) 0.1bn EUR is used to guarantee 100% of mainly focused on individual customers,
an interest rate subsidy of up to 4% p.a. consumer loans, while 0.3bn EUR is therefore the relief programs for business
• In addition, financial aid in the form of state planned to be used to guarantee 80% of customers are less relevant
guarantee schemes, with guaranteed fee subsidy non-retail loans
can be provided by (i) the Export-Import Bank of
Slovakia (guarantee of up to 80% for loans < 2m
EUR) and the (ii) the Slovak Investment Holding
(guarantee of up to 90% for loans of 2-20m EUR).
No portfolio cap
50COVID-19 (3/9)
Overview of EBA-compliant payment holidays and public Covid-19 guarantee schemes
Payment holidays – by country: Payment holidays – by segment:
Status: 31 Mar 2021 Loan deferrals Expired loan Status: 31 Mar 2021 Loan deferrals Expired loan
granted deferrals granted deferrals
% of total % of total
Total loan
% of deferrals Total % of deferrals
(bn EUR) granted loan
portfolio (bn EUR) granted
portfolio
KBC Group 13.1 8% 91%* KBC Group 13.1 8% 91%*
of which: of which:
Belgium 7.3 7% 89% Mortgages 4.7 6% 98%
Czech Republic 2.1 7% 100% SME 4.0 12% 89%
No longer Corporate 3.7 8% 87%
Hungary (opt-out) 1.6 31% EBA-compliant
Slovakia 0.8 9% 83%
Bulgaria 0.2 6% 70%
Ireland 1.2 12% 100%
By the end of March 2021:
• The volume of loans granted payment holidays, according to the EBA definitions,
amounted to 13.1bn EUR or 8% of the total loan book**
Loans and advances under public Covid-19 • Approx. 91%* of EBA-compliant moratoria already expired, of which 98% have resumed
guarantee schemes: payments, whilst only 1% are new defaults
Status: 31 Mar 2021 Loans granted # obligors • Government-guaranteed loans (under the Covid-19 scheme) amounted to 929m EUR
(m EUR) k
KBC Group 929 12
of which:
SME 513
Corporate 399
* Excluding Hungary (opt-out)
** Loans to customers, excluding reverse repos (and bonds)
51COVID-19 (4/9)
IFRS 9 scenarios
One year into the pandemic, the vaccination
OPTIMISTIC BASE-CASE PESSIMISTIC campaigns are paving the way for (future)
SCENARIO SCENARIO SCENARIO gradual re-openings of the economy. However,
Virus spread and impact more Start of vaccination process and wider testing The virus reappears and vaccination is progressing more slowly than
quickly under control thanks to and tracing will allow only a very moderate continues to weigh on society expected in the EU and new surges in the
earlier than expected large-scale easing of precautionary measures in H1 and the economy, because of pandemic have hit several EU countries during
availability of vaccines, allowing 2021. From mid-2021 on, the normalisation setbacks in the vaccination
social distancing measures and of socio-economic interactions will be helped process (e.g., logistical
the first quarter.
other precautionary measures to by the mass rollout of effective vaccines. problems, disappointing Because of this uncertainty, we continue
be lifted sooner However, as the vaccination process will take immunity results, etc.) working with three alternative scenarios: a
time, socio-economic interactions will not base-case scenario, a more optimistic scenario
return to normal before 2022 and a more pessimistic scenario
Steep and steady recovery from The recovery will be gradual. It will take until Another (series of) shock(s) • The definition of each scenario reflects the
the first half of 2021 onwards, the second half of 2021 for the mass rollout takes place, leading to an latest virus-related and economic
with a fast return to pre-Covid- of vaccines to reinforce the recovery to pre- interrupted and unsteady path developments, with the following probabilities:
19 levels of activity Covid-19 levels of activity by mid-2022 to recovery
60% for the base-case, 30% for the pessimistic
and 10% for the optimistic scenario (versus
Macroeconomic scenarios* 55%-35%-10% at the end of FY20)
March 2021
Real GDP growth 2021 2022
Optimistic Base Pessimistic Optimistic Base Pessimistic The economic outlook for the home markets remains aligned to that
Euro area 7.3% 3.8% -0.5% 4.1% 4.1% 1.8% of the euro area and confirms the better-than-expected level of
Belgium 7.5% 4.1% 0.2% 3.6% 4.0% 1.6% resilience. However, the high rate of Covid-19 infections in the first
Czech Republic 4.4% 3.5% 0.7% 5.1% 4.6% 2.1%
quarter of 2021 has led to extended lockdown measures and
Hungary 5.5% 4.2% 2.5% 5.5% 5.0% 3.5%
Slovakia 5.6% 4.2% 2.2% 4.8% 4.2% 3.5%
continues to weigh on the recovery in the short run
Bulgaria 4.0% 3.0% -1.0% 3.0% 4.0% 2.0%
Ireland 8.0% 5.0% 1.0% 7.0% 4.0% 1.0%
• The macroeconomic information does not yet reflect the official macroeconomic figures for 1Q 2021
as reported by different authorities 52COVID-19 (5/9)
IFRS 9 scenarios
Macroeconomic scenarios
March 2021
Unemployment
2021 2022
rate
Optimistic Base Pessimistic Optimistic Base Pessimistic
Belgium 6.2% 7.2% 8.2% 5.9% 6.9% 8.0%
Czech Republic 3.5% 3.7% 4.5% 2.8% 3.0% 4.8%
Hungary 3.9% 4.2% 5.8% 3.7% 4.0% 5.5%
Slovakia 8.5% 9.5% 10.0% 7.8% 8.0% 9.5%
Bulgaria 5.0% 5.0% 8.0% 4.3% 4.8% 7.0%
Ireland (*)
(*) 5.5% 7.0% 14.0% 4.0% 6.0% 10.0%
(*) Note: includes temporary layoffs rather than permanent job losses, and as such, may improve rapidly once
vaccine rollout becomes better established in Ireland
House-price
2021 2022
index
Optimistic Base Pessimistic Optimistic Base Pessimistic
Belgium 3.0% -1.0% -3.0% 2.5% 1.5% -1.0%
Czech Republic 5.0% 3.7% -1.0% 4.1% 2.4% -0.9%
Hungary 5.5% 2.0% -2.0% 6.0% 3.0% -1.0%
Slovakia 5.0% 2.0% -2.0% 4.0% 2.5% -1.0%
Bulgaria 3.0% 2.5% 2.0% 3.5% 3.2% 3.0%
Ireland 3.0% 1.0% -2.0% 4.0% 1.0% -2.0%
53You can also read