Rosenbauer Group Person Date - Company Roadshow, New York, Toronto, Montreal Sebastian Wolf I CFO

Page created by Vanessa Paul
 
CONTINUE READING
Rosenbauer Group Person Date - Company Roadshow, New York, Toronto, Montreal Sebastian Wolf I CFO
Rosenbauer
Rosenbauer Group
           Group
 Company Roadshow, New York, Toronto, Montreal
 Sebastian Wolf I CFO
Person
Date
 April 16-18, 2019
Rosenbauer Group Person Date - Company Roadshow, New York, Toronto, Montreal Sebastian Wolf I CFO
Disclaimer

This presentation was produced by Rosenbauer International AG
(Rosenbauer for short) for informational purposes only. Despite the
greatest care taken by Rosenbauer, no guarantee is given for the
correctness and completeness of the content.
This presentation may not be reproduced, transmitted, or distributed
(neither in its entirety nor in part). Unless otherwise stated, all information
(including financial statements and forecasts) is the property of
Rosenbauer and may therefore be changed without prior notification by
Rosenbauer.
All decisions based on information included in the Rosenbauer
presentation are the sole responsibility of the user. Rosenbauer accepts
no liability for the actions and consequences resulting from the use of the
presentation.
None of the information provided in the presentation constitutes, or is
intended to be, an invitation to buy or trade in Rosenbauer shares.

                                                                                  Investor Presentation I 2
Rosenbauer Group Person Date - Company Roadshow, New York, Toronto, Montreal Sebastian Wolf I CFO
Agenda

1. Rosenbauer Group at a glance

2. FY 2018 financial figures

3. Outlook
Rosenbauer Group Person Date - Company Roadshow, New York, Toronto, Montreal Sebastian Wolf I CFO
Rosenbauer Group at a glance
Rosenbauer Group Person Date - Company Roadshow, New York, Toronto, Montreal Sebastian Wolf I CFO
Rosenbauer Group equity story

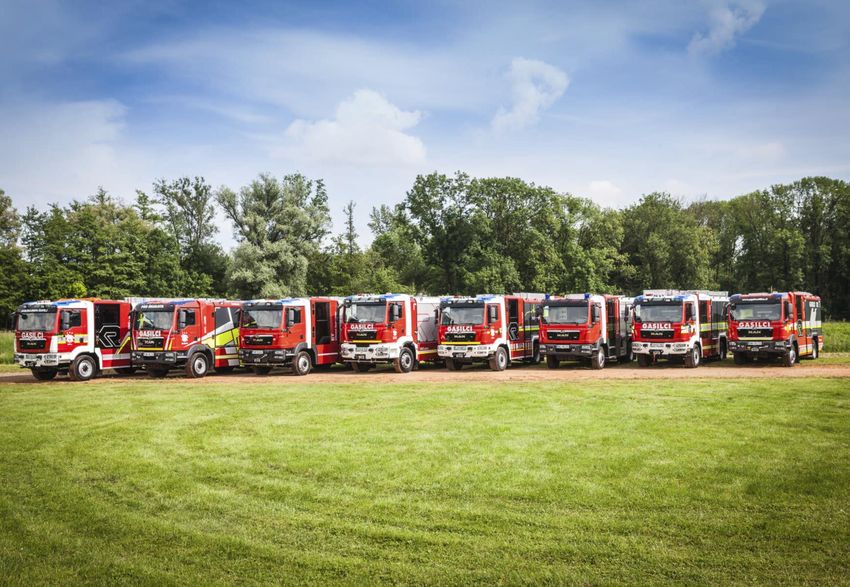
                         Global market leader
                                                         ■ Full-range supplier of fire fighting
                                                           equipment and preventive fire protection
                                                         ■ World´s largest producer of fire fighting
                                                           vehicles
                                                         ■ Global market volume: ~ 21,100 vehicles
                                                           (2017), ~ 10% RB market share

   Innovation leader     ■ High R&D expenditures,              ■ Present in around 130                 Unrivalled worldwide network
                           holding > 180 patents                 countries
                         ■ First mover pioneering              ■ 9 Production sites in Europe,
                           sustainability technologies           3 in the US and 4 in Asia
                         ■ Lighthouse project “Concept         ■ Around 280 sales partners
                           Fire Truck”                           worldwide

                       Resilient business model          ■ Above-the-market growth over the last 10
                                                           years
                                                         ■ Sustainable dividend policy, safe dividend
                                                           payments
                                                         ■ Broad diversification by geographies and
                                                           products

                                                                                                                 Investor Presentation I 5
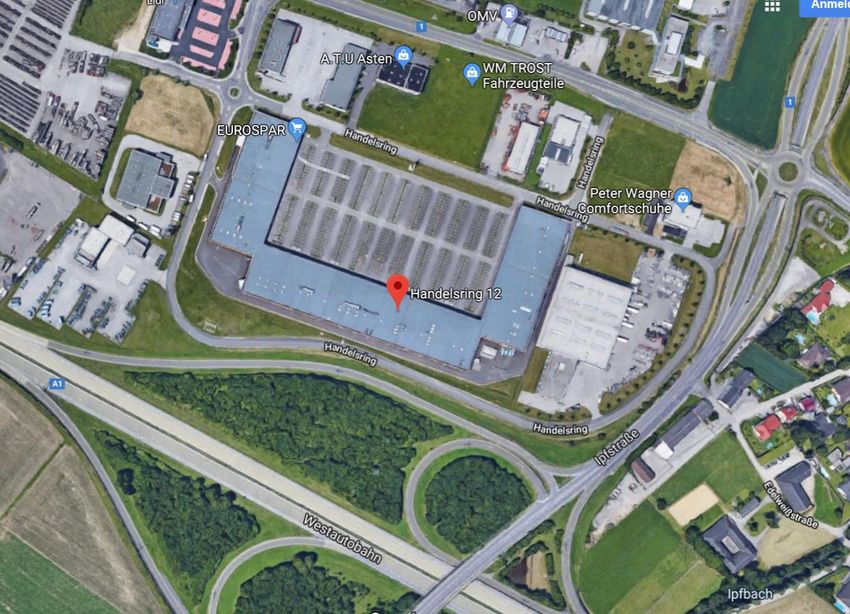
Rosenbauer Group Person Date - Company Roadshow, New York, Toronto, Montreal Sebastian Wolf I CFO
Strategic focus

                                                                                Our customers´ first choice

                                                           Faster and more profitable by repetition effects
                                                           from products and processes

                                               Increase of strategic flexibility by utilizing on all potentials
                                               from cost and working capital optimization

                                     Organic growth and an healthy balance of investments in /
                                     returns from our strategic market positions

                           Increase of perceived customer value by means,
                           which in addition generate economies of scale

                 Sustainable profits and reinforcement of global market leadership
                 by scaling up technological leadership and fascinating products

        Focus on core business

One Rosenbauer team

                                                                                                              Investor Presentation I 6
Rosenbauer Group Person Date - Company Roadshow, New York, Toronto, Montreal Sebastian Wolf I CFO
Global network of production facilities,
 sales and service offices

                                       EUROPE
                                       AUSTRIA         ITALY      SLOVENIA   SWITZERLAND
                                       Leonding        Rovereto   Radgona    Oberglatt
      AMERICA                          Neidling
                                       Graz            POLAND     SPAIN      UK
      Lyons / South-Dakota
      Fremont / Nebraska               Telfs           Warsaw     Linares    Holmfirth        ASIA/
                                                                  Madrid
      Wyoming / Minnesota
      Rosenbauer America
                                       FRANCE          RUSSIA                                 AUSTRALIA
                                       Chambéry        Moscow
                                                                                              CHINA
                                       GERMANY                                                Kunming
                                       Karlsruhe
                                       Luckenwalde                                            SINGAPORE
                                       Mogendorf &                                            Singapore
                                       Gladbeck
                                       Viersen
                                                                                              PHILIPPINES
                                                                                              Mandaluyong City

                                                                                              BRUNEI
                                       MIDDLE EAST/
                                                                                              AUSTRALIA
                                       AFRICA                                                 Brisbane
                                       SAUDI-ARABIA
                                       Dschidda
                                       KAEC
                                       Riad

                                       SOUTH-AFRICA
                                       Halfway House

Production
Sales / Service

Around 280 sales partners worldwide.                                                       Investor Presentation I 7
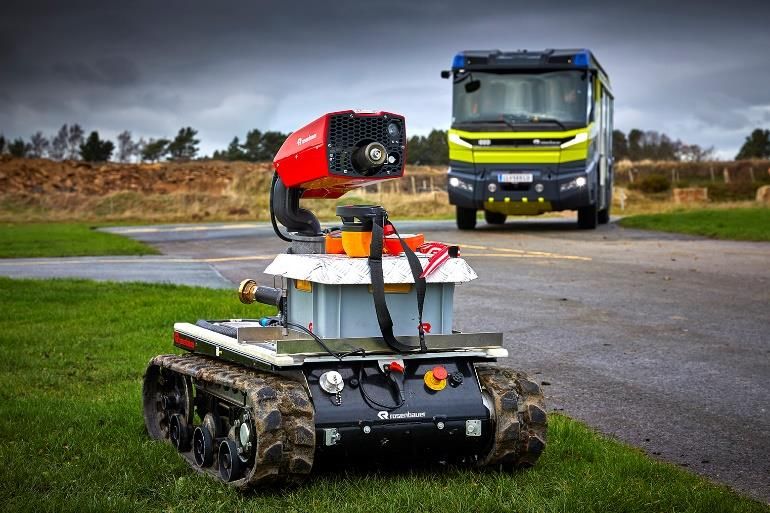
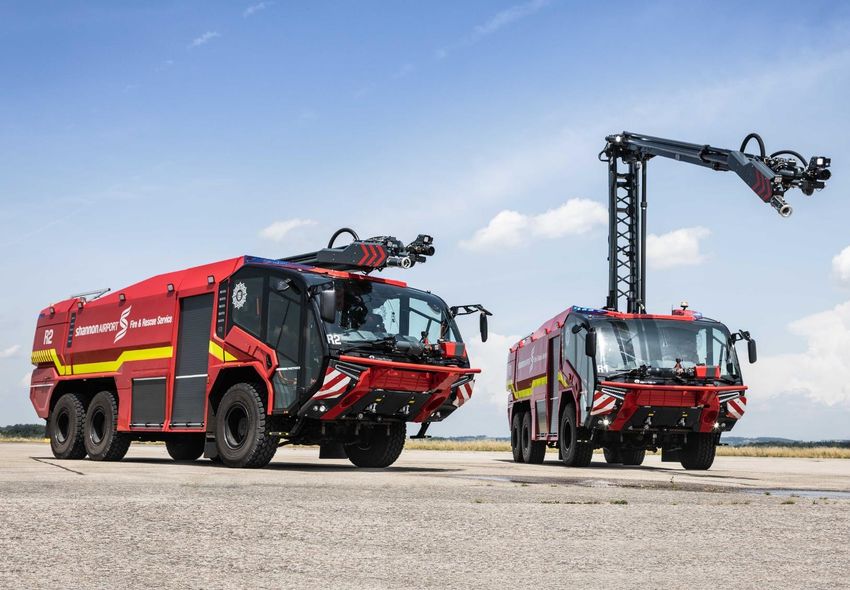
Rosenbauer Group Person Date - Company Roadshow, New York, Toronto, Montreal Sebastian Wolf I CFO
Full-range supplier
(Product segments and % of group revenues; as of Dec 31, 2018)

                                  Municipal Vehicles              Fire & Safety
                                  33%                               Equipment
                                                                            8%

      Industrial Vehicles                                                          Firefighting
                    12%                                                            Components
                                                                                   3%

                                  ARFF Vehicles                  Stationary Fire
                                  11%                                 Protection
                                                                             3%

                      Aerials                                                      Customer Service
                        20%                                                        7%

                                                                                   Others 3%

                                                                                               Investor Presentation I 8
Rosenbauer Group Person Date - Company Roadshow, New York, Toronto, Montreal Sebastian Wolf I CFO
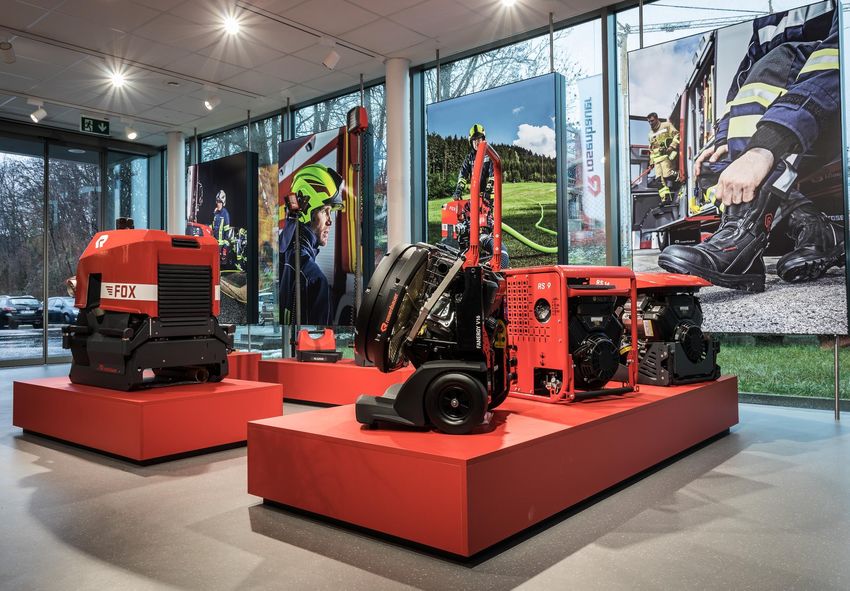
Developing future e-technology

■   Concept Fire Truck (CFT) on its way to series production readiness
    ■ Low emissions based on alternative driving concept
    ■ Multi-functionality allows for universal application
    ■ Ergonomically optimized expansion through new kind of fire truck architecture
■   Volvo Penta to adapt proven electronic driveline to the performance requirements of a
    fire service application
■   “Innovation partnership” with Berlin Fire Department
■   Global market for innovative CFT technology to reach around 3,200 vehicles in 2030,
    with 700 to 800 units running in Europe already by 2025
■   CFT technology to be transferred also to other types
    of vehicle
■   Particular interest from members of the “C40 Cities
    Climate Leadership Goals”
■   2019 planned roadshows to Canada, France,
    Germany, Slovenia, Switzerland and the US
■   Market launch planned for 2021

                                                                                      Investor Presentation I 9
Rosenbauer Group Person Date - Company Roadshow, New York, Toronto, Montreal Sebastian Wolf I CFO
Sustainable goals

                                                                       Ecology &
Compliance           Employees               Products & Society        Resources
 No breaches of      Reduction of           Market launch of a       Raise share of       Rosenbauer is
  group compliance     accidents at work       firefighting vehicle      green electricity    contributing to the UN
  guidelines and       to 30 per 1 million     with an alternative       in the total power   Sustainable
  code of ethics       working hours until     driveline in 2021,        consumption of the   Development Goals,
                                                                                              especially to the ones
                       2023                    which complies with       group to 75% until
                                                                                              mentioned below:
                      Promotion of            the requirements of a     2021
                       diversity and           modern fire service      Produce own
                       increase of the        Increase sales of         green electricity
                       number of female        training simulators,      amounting to 5%
                       employees by            expand model range        of total power
                       25% until 2023         Save 100,000 m2           consumption until
                       compared to 2018        plastic foil per year     2021
                                               from 2019 on by          From 2018 on all
                                               deploying reusable        coatings are
                                               packaging in the          100% free of
                                               production of             heavy metals 
                                               firefighter helmets       goal achieved

                                                                                                   Investor Presentation I 10
Status sustainability goals

Share of clean electricity                            Produced electricity
                                                           from PV
                                     75%
                  59%                                                        5%
                                                                                                   10%

                                           100%

                                                                    0,6%

                 As of 2018   Goal until 2021                              As of 2018   Goal until 2021

Headcounts women                                      Occupational accidents
                        432                               per 1 million
                                                         working hours                           54,6
                                                                            30

                                                540
                                                                                                            60

                 As of 2018   Goal until 2023                           Reduction until 2023   As of 2018

                                                                                                   Investor Presentation I 11
FY 2018 financial figures
Industry development 2018

■   In 2018, the world fire fighting market benefitted from a strong global GDP growth
    showing a robust development
    ■ Strongest sales regions were Europe, North America and Asia
    ■ Countries highly dependent on the price of oil partially recovered, but procurement volumes
      are still below historical highs
■   Demand in North America goes up another 5% and peaks at more than 4,500 vehicles
    ■ Higher replacement purchases by the governmental sector
■   European fire fighting market keeps growing, Germany and Austria more dynamic
    ■ Size of Eastern European markets reach historic levels thanks to EU subsidies for
      infrastructure investments, need to catch up compared to Western Europe persisting
■   China and India, the largest growth markets in Asia, lower

                                                                                 Investor Presentation I 13
World firefighting vehicle market 2008-2017

  Fire-fighting vehicle                               Fire-fighting vehicle                                   Rosenbauer Group
  market worldwide                                    market worldwide                                        Revenues
  Approximate number                                  Global annual volume                                    in EUR million
  of vehicles in thousands                            in EUR billion
                                                                                                                           +6.0%
                        +3.4%                                                                                               p.a.      870.8 909.4
                                                                                                     4.3                           865.4
                                                                                             4.2 4.3
                         p.a.     21.5 22                                   +4.9%                                                        847.6
                                                 21                                                                             784.9
                                                                             p.a.
                   15                       19                                         3.7                                  737.9
                                                                                 3.4
         16   16             17                                                                                    595.7 645.1
                        16                                  3   3          3.1
 15-16             15                                 2.8            2.8                                        541.8 541.6
                                                                                                            500.3

  2008 09     10   11   12   13   14   15   16 2017   2008 09   10   11    12    13    14    15   16 2017   2008 09 10 11 12 13 14 15 16 17 2018

■ Over the last ten years the global firefighting vehicle market has constantly outperformed world GDP, which
  grew at an annual average rate of 2.8%
■ In 2017 market volume was about € 4,250 million (2016: € 4,259 million) / 21,100 units (2016: 19,500 units)
■ Rosenbauer holds market shares of 15% (value) and 10% (units) respectively, being the global market
  leader

                                                                                                                           Investor Presentation I 14
Highlights

■   In 2018 Rosenbauer Group has resumed its growth path, revenues increased to
    € 909.4 million
    ■ In particular, Western Europe the Near and Middle East saw significantly higher volumes, Stationary Fire
      Protection as well as Germany and Austria increased
    ■ Photo finish: With revenues totaling to € 357.4 million, the last three months of the year proved to be the
      strongest single quarter in the company´s history
■   With € 48.8 million EBIT has more than doubled compared to the previous year
    ■ High production output and favorable product mix
    ■ As expected effects from new accounting standard IFRS 15 have flattened out towards year-end
■   Record incoming orders of € 1.1 billion allows for excellent utilization capacity forecast
    in the current year
■   Distribution policy geared towards sustainability
    ■ Dividend proposal of € 1.25 per share reflects the positive 2018 business development

                                                                                               Investor Presentation I 15
Revenues and EBIT
€ million

            1000                                                                                                                  100
                           Revenues                                                                                   909.4
            900                                                                      865.4      870.8                             90
                           EBIT                                                                            847.6
                                                                          813.8
            800                                                                                                                   80
                                                               737.9

            700                                                                                                                   70
                                                    645.1
                              595.7
            600                                                                                                                   60
                   541.8                 541.6

            500                   49.7                                                   50.6                                     50
                                                                              48.4                                        48.8
                                                                                                    47.0
                                             41.6                  42.3
            400                                         38.6                                                                      40

            300        29.4                                                                                                       30

            200                                                                                                21.1               20

            100                                                                                                                   10

              0                                                                                                                   0
                   2009       2010       2011       2012       2013       2014       2015       2016       2017       2018

     EBIT margin 5.4%         8,3%       7.7%       6.0%       5.7%       5.9%       5.8%       5.4%       2.5%       5.4%

                                                                                                                                 Investor Presentation I 16
Revenue development
€ million

                                            +7.3%

                                         32.8             6.7    1.0    909.4   ■   Rosenbauer
                                 29.0                                               Group 2018 with
                                                 -16.2                              above-the-market
                 847.6    8.5
                                                                                    growth
                                                                                ■   5 out of 6
                                                                                    business
                                                                                    segments achieve
                                                                                    higher volumes
                                                                                ■   Area NISA and
                                                                                    Area MENA
                                                                                    account for the
                                                                                    biggest increases
                 2017    CEEU
                         CEEU    MENA
                                 MENA    NISA
                                         NISA    APAC
                                                 APAC    NOMA
                                                         NOMA    SFP    2018
                                                                                ■   Area APAC
  Area Revenue
                         276.2   105.2   119.0   165.4   219.5   24.2               influenced by
          2018
                                                                                    local risks, China
Group Revenues                                                                      and India lower
                         30%     12%     13%     18%     24%     3%
          2018
Group Revenues           32%      9%     10%     21%     25%     3%
          2017

                                                                                     Investor Presentation I 17
EBIT development
€ million

                                          +131.3%
                                                                           ■   Earnings
                                                4.7
                                                                    48.8       improvement
                                         2.6
                                  8.8                 -2.2   -0.6              thanks to higher
                                                                               output and
                          14.4                                                 favorable product
                                                                               mix
                                                                           ■   2017 EBIT affected
                   21.1
                                                                               by one-offs
                                                                           ■   Stationary Fire
                                                                               Protection shows
                                                                               negative EBIT as it
                                                                               has not yet
                   2017   CEEU
                          CEEU   MENA
                                 MENA   NISA
                                        NISA   APAC
                                               APAC   NOMA
                                                      NOMA   SFP    2018
                                                                               reached critical
       Area EBIT                                                               size
                          13.6   8.9    3.5    13.0   11.0   -1.2
            2018
     Group EBIT
                          28%    18%    7%     27%    22%    -2%
           2018
     Group EBIT           -4%    1%     4%     39%    63%    -3%
           2017

                                                                                Investor Presentation I 18
Revenues and EBIT quarterly
in € million

400                                                                                                                              40
                                                                                                                     357.4
350                                                                                                                  318.4       35

300                                                                                                                  31.8        30
                                     268.0
                                                                            243.1                                     23.4
250                                                                                              219.4                           25
                   211.3    219.5                      211.7                                              204.7
                                                                210.9
                                                                                        183.6
200                                           181.9                                                                              20
         172.0                                                                                            199.3
                                     19.6                                                        190.3
150                                                                                     162.4                                    15
                   15.5                                                                          12.8
                                                                                                           8,1
100                                                             12.1                                                             10
                             8.5                                                         4.6      8.9
 50                                                                             6.3                        7.0                   5
                                                        5.8
                                                                                         1.1
          3.4                                  -3.1
  0                                                                                                                              0
                                                        Q2/17
           Q1/16

                    Q2/16

                             Q3/16

                                      Q4/16

                                               Q1/17

                                                                 Q3/17

                                                                                Q4/17

                                                                                         Q1/18

                                                                                                  Q2/18

                                                                                                           Q3/18

                                                                                                                       Q4/18
                                                Umsatz                   EBIT
                                                                                                            Investor Presentation I 19
Investments

CAPEX, depreciation and                                                         R&D expenses, ratio of R&D expenses
amortization                                                                    to sales
€ million                                                                       € million

     51.2
                                                                                              19.4
                                                                                                       18.6
                                                                                      15.9             3.5%                   15.2
                                                                                              3.4%              14.5

                                  24.3
                   22.1                         21.5
                                                              18.7
                                                       16.5          16.7
                          13.9           14.8
            12.6
                                                                                                                2.7%         2.7%
                                                                                      2.6%

       2014          2015            2016         2017           2018                 2014    2015     2016     2017         2018

            Investments          Depreciation and amortization                               R&D expenses      R&D ratio

 ■      CAPEX 2018: 63% growth, 21% replacement,                            ■   Capitalization rate 8.6% (2017: 14.5%)
        16% rationalization                                                 ■   Series production readiness CFT, 3rd generation
 ■      Paint shop Leonding, aerials production                                 of XS aerials from Karlsruhe
        Karlsruhe, production hall Radgona
                                                                                                                Investor Presentation I 20
Financial figures

€ million                   2016      2017      2018       2017/2018

Revenues                      870.8     847.6     909.4              +7.3%

EBIT                           47.0      21.1      48.8         +131.3%

EBIT margin                   5.4%      2.5%      5.4%                         -

EBT                            44.0      21.1      43.8         +107.6%

Net profit for the period      34.6      18.5      34.7            +87,6%

Cash flow from
                               83.4      28.4     -13.7          -148,2%
operating activities

                                                          Investor Presentation I 21
Accounting ratios

 € million / %                                 Dec. 31, 2016 Dec. 31, 2017 Dec. 31, 2018  2017/2018
                                                                                        1
 Total assets                                             650.6    625.4        782.3                 +25.1%
                                                                                        2
 Equity ratio                                             37.2%   38.2%         30.3%                              -

 Capital employed (ø)                                     470.2    472.6        498.6                    +5.5%

 ROCE                                                     10.0%    4.5%          9.8%                              -

 ROE                                                      18.8%    8.8%         18.4%                              -

 Net debt                                                 171.3    184.1        231.5                 +24.7%

 Gearing ratio                                            70.8%   77.0%         97.6%                              -
1)   Total assets w/o IFRS 15: 734.9 € million (+17.5%)
2)   Equity ratio w/o IFRS 15: 34.7%

                                                                                            Investor Presentation I 22
Balance sheet structure (in € million)

                  734.9       782.3   625.4   650.6   650.6   625.4   782.3     734.9

                                                                       61.3                  Provisions
 Assets                                                                          61.3
                              179.8
                   179.8
                                                       59.4           226.3
                                                               53.7              160.7
                                              185.9
 Receivables                          181.9           147.1                                  Liabilities
                                                              127.6
 and other
                              234.4                                                          and other
                   228.9                                                                     debts
 assets                                                                          255.3
                                              197.9                   237.1
                                      176.7
                                                      242.0   239.2                          Equity
 Construction      92.4
 contracts                            75.6     67.7
                              368.1
                   233.8                                              257.6      257.6       Interest-
 Inventories                          191.2   199.1   202.1   204.9
                                                                                             bearing
                                                                                             liabilities
                   2018       2018    2017    2016    2016    2017    2018       2018
                w/o IFRS 15                                                   w/o IFRS 15

                                                                                     Investor Presentation I 23
Trade working capital and financing

Trade Working Capital
          TRADE WORKING CAPITAL                                          Financing          FINANCING
€ million         € million                                              € million             € million

                                                                  225%
                                                          909.4
            870.8                  847.6                          200%                                              237.1
                                                                                 242.0             239.2
                                                                                                            231.5
                                                                  175%
                                                                  150%                     184.1
                                                                         171.3
                                                                  125%
                                                  397.4           100%
    340.7                  343.8                                                                               97.6%
                                                                  75%                        77.0%
                                                                           70.8%
                                                                  50%
        39,1%                   40.6%                    43.7%    25%
                                                                  0%
       2016                    2017                     2018                2016              2017              2018
               Trade Working Capital                                       Net Debt
               Annual Revenue                                              Equity
               Trade Working Capital / Annual Revenue                      Gearing Ratio

■   Long throughput times of 8 to 12 months
■   Prepayments > 15%
■   Average payment term of 71 days

                                                                                                           Investor Presentation I 24
New logistics center Asten

■   Location: Handelsring 12, 4481 Asten
    o Warehouse with 4,500 m2 total usable area
    o Traffic-favorable position next to motorway A1
    o Being put into operation successively from March
      2019 on
■   Handling of SKD / CKD shipments
■   Move of small- and high-volume packaging
■   Temporary storage of chassis and finished
    firefighting vehicles

 Relief of Leonding plant 1, which has only a limited storage area, and insourcing of
  logistics services
 Cost-neutral rezoning of Leonding plant 1 unfreezing additional manufacturing
  capacity of around 200 SKD assembly kits

                                                                           Investor Presentation I 25
Outlook
Order intake / backlog

Order intake/backlog                                                                             Order intake 2018
€ million                                                        1,107.7                         by Area (2017)
                                                                           1,052.3
                                                 970.0
                 905.9                                                                               SFP
                                                         882.6                                      3% (3%)
 845.9
                         797.5   816.8                                                   APAC
                                         739.7                                         18% (21%)
                                                                                                                              CEEU
         693.0
                                                                                                                            30% (32%)

                                                                                                   € 1,107.7 m

                                                                                       NOMA
                                                                                     24% (25%)                            NISA
                                                                                                                        13% (10%)

                                                                                                        MENA
                                                                                                       12% (9%)

   2014            2015            2016              2017           2018

                 Order intake        Order backlog

                                                                                                              Investor Presentation I 27
Outlook

■   Global economic growth will slow down in 2019, according to the IMF
    ■ Especially the US-China trade dispute, a weakening financial market sentiment and lower economic
      activity in Germany are a burden
    ■ The world fire service market follows with a delay of several months, full order books should make the
      industry resilient
■   Procurement volumes in the North American fire service market could again well
    exceed 4,000 vehicles this year
■   European fire service market continues to grow, strong demand especially in Austria,
    Germany, France and the United Kingdom
■   Near and Middle East with significant recovery
■   A massive order book supports the high utilisation of capacity of the production sites
    and gives Rosenbauer Group a strong visibility in the markets
■   Strategy for organic growth will continue to be implemented consistently, focus on
    local market shares and increase in efficiency

                                                                                             Investor Presentation I 28
Dividend proposal and guidance 2019

Rosenbauer Group follows a growth-oriented
and sustainable dividend policy, which reflects   GUIDANCE 2019
its commercial success. Based on net profit
and free cash flow the group aims at safe
dividend payments. In general the payout ratio
should make up 30 to 40% of the net profit
attributable to the shareholders of the parent
company, unless it is not opposed by other
                                                  > 950 Mio €
                                                    Group Revenues
important reasons. Moreover shareholders
may participate in an extraordinary positive
development of Rosenbauer Group.
                                                     ~ 5,5%
With regards to the fiscal year 2018 the             EBIT Margin
Managing Board and the Supervisory Board
are going to propose a dividend of

               € 1.25 per share

to the Annual General Meeting.

                                                                     Investor Presentation I 29
Thank you for your attention!
Appendix
Executive board

        CEO                        CFO                  CSO                    CTO
    Dieter Siegel              Sebastian Wolf       Andreas Zeller      Daniel Tomaschko
Corporate Development,    Audit, Controlling,    Area CEEU              Supply Chain Mgmt.,
Human Resources,          Accounting/Tax,        Area NISA              Central Technics,
Strategy, Innovation &    Treasury,              Area APAC              Center of Competence
Marketing,                Legal & Compliance &   Area NOMA              Operations,
Group Communication,      Insurance, Export      Area MENA              Stationary Fire
Fire & Safety Equipment   Finance, Investor      Customer Service       Protection
Product Management        Relations/CSR,         Sales Administration
                          IT

                                                                             Investor Presentation I 32
Using IFRS 15 for the first time - later
revenue recognition

                                   (To 31/12/2017)                                   Income
                                   “Percentage of Completion”                        statement
                                   Method
                                   Period-of-time related revenue
                                   recognition in the income statement
                                   according to production status
                                   - Aliquot revenues and partial profits in
                                     the income statement
                                   - Construction contracts in the balance sheet

 Status of construction contract   (From 1/1/2018)
                                   “Completed Contract” Method                       Income
                                   Date-related, later sales recognition in the      statement
                                   income statement with delivery
                                   - Income statement: Revenues
 t                                                      Inventory, WiP
                                                        Result*
                                   - Balance sheet:     Construction contracts = 0
                                                        Inventories
                                   *) through lack of partial profits

                                                                                     Investor Presentation I 33
PoC effects flattening out in line with 12M
business cycle

                                                             ■ IFRS 15 was first applied in the
                    PoC effects                                reporting period under the modified
in € mio                                                       retrospective approach
 60
                                         55.6                ■ According to this approach PoC effects
 50                         50.3
                                                               need to be presented only in the first
 40
                                                               year of introduction
 30
 20           20
                                                             ■ With regards to Rosenbauer Group, the
                                                      16.7
 10
                                                               new accounting standard is primarily
                            7.3          8.5
   0
              3
                                                       0.1
                                                               relevant for the production of
           Q1
       1-3/2018        Q1-2
                     1-6/2018        Q1-3
                                   1-9/2018        FY
                                               1-12/2018       firefighting vehicles
                  on EBIT          on Revenues               ■ 12M business cycle: First half-year
                                                               characterised by stockpiling, second
                                                               half-year by stock reduction

                                                                                         Investor Presentation I 34
Segment reporting by Areas

CEEU:   Central & Eastern Europe
NISA:   Northern Europe, Iberia, South America, Africa
MENA:   Middle East & North Africa
APAC:   Asia, Pacific, Australia, China
NOMA:   North & Middle America
                                                         Investor Presentation I 35
Number of employees (reporting date)

Dec 31, 2018          1,442                      841                         906               432       3,621

Dec 31, 2017         1,350                     830                       853             372             3,405

Dec 31, 2016          1,401                    793                       842             339             3,375

Dec 31, 2015          1,403                  716                   675             292                   3,086

Dec 31, 2014         1,308                708                    650           275                       2,941

Dec 31, 2013        1,209              668                 578         196                               2,651

                     Austria   USA   Germany         Rest of the world

  In addition, Rosenbauer employs approximately 355 temporary employees.

                                                                                                 Investor Presentation I 36
Rosenbauer share

                                                                                                        Investor
                                                                                                        FR
                                                  2017    2018                                          5%

   Highest price                         €         52.6    33.3
                                                                                                                               BVG *
                                                                               Free float                                      51%
                                         €                                     44%
   Lowest price                                    51.1    31.8

   Closing price                         €         52.6    33.3

                                                                                            * Rosenbauer Beteiligungsverwaltung GmbH
   Market capitalization              € million   357.7   226.4

                                                                        60,0
   Dividend                              €          1.0   1.251)
                                                                        50,0

                                                                        40,0
   Earnings per share                    €          1.1     3.7
                                                                        30,0
                                                                               Jan Feb Mar Apr May Jun Jul Aug Sep Oct Nov Dec

                                                                                        Rosenbauer EURO                 ATXPrime index.

1) Proposal   to the Annual Meeting
 Indizes: ATPX, AFA, AIGS, AP8, AXGP, NAP8, NTFA, TAP8, TFA, VOX, WBI
                                                                                                                   Investor Presentation I 37
Financial calendar 2019

April 5, 2019           Publication of the results 2018
April 16, 2019          Roadshow, New York
April 17, 2019          Roadshow, Toronto
April 18, 2019          Roadshow, Montreal
May 13, 2019            Publication of the Interim Statement 1/2019
May 15, 2019            Roadshow, London
May 23, 2019            Annual General Meeting
August 9, 2019          Publication of the Half-year Financial Report 2019
September 23-26, 2019   Baader Investment Conference, Munich
October 17, 2019        Family Office Day, Vienna
November 12, 2019       Publication of the Interim Statement 3/2019

                                                                      Investor Presentation I 38
You can also read