Key trends in the agrifood sector - Egypt, Jordan, Morocco and Tunisia - Food and Agriculture ...
←
→
Page content transcription
If your browser does not render page correctly, please read the page content below
Egypt, Morocco, Tunisia and Jordan - Key trends in the agrifood sector
                                                                                                                                                          Egypt, Jordan, Morocco and Tunisia
                                                                                                                                                          Key trends in the
                                                                                                                                                          agrifood sector

Please address comments and inquiries to:
Investment Centre Division
Food and Agriculture Organization of the United Nations (FAO)
Viale delle Terme di Caracalla – 00153 Rome, Italy
                                                                I4897E/2/11.15

investment-centre@fao.org
                                                                                       Report No. 22

www.fao.org/investment/en

Report No. 22 - September 2015
Egypt, Jordan,
Morocco and Tunisia
Key trends in the
agrifood sector

Nuno Santos
Economist, Investment Centre Division, FAO
Iride Ceccacci
Food Security Economist, EBRD

COUNTRY HIGHLIGHTS
prepared under the FAO/EBRD Cooperation

FOOD AND AGRICULTURE ORGANIZATION OF THE UNITED NATIONS
Rome, 2015
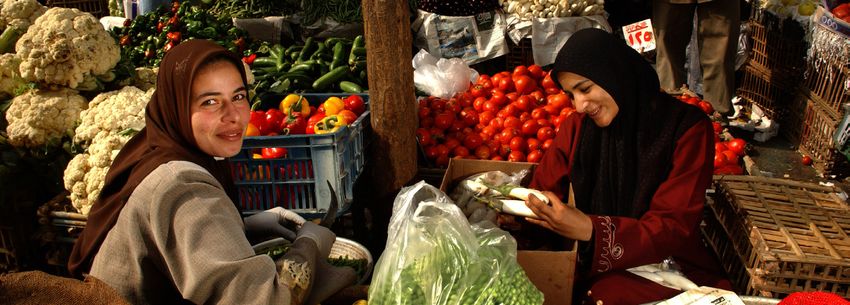
The designations employed and the presentation of material in this information
product do not imply the expression of any opinion whatsoever on the part of the Food
and Agriculture Organization of the United Nations (FAO) or the European Bank for
Reconstruction and Development (EBRD) concerning the legal or development status
of any country, territory, city or area or of its authorities, or concerning the delimitation
of its frontiers or boundaries. The mention of specific companies or products of
manufacturers, whether or not these have been patented, does not imply that these
have been endorsed or recommended by FAO or the EBRD in preference to others
of a similar nature that are not mentioned. The views expressed in this information
product are those of the author(s) and do not necessarily reflect the views or policies
of FAO or the EBRD.

© FAO 2015

FAO encourages the use, reproduction and dissemination of material in this
information product. Except where otherwise indicated, material may be copied,
downloaded and printed for private study, research and teaching purposes, or for use
in non-commercial products or services, provided that appropriate acknowledgement
of FAO as the source and copyright holder is given and that FAO’s endorsement of
users’ views, products or services is not implied in any way.

All requests for translation and adaptation rights, and for resale and other commercial
use rights should be made via www.fao.org/contact-us/licencerequest or addressed to
copyright@fao.org.

FAO information products are available on the FAO website (www.fao.org/publications)
and can be purchased through publications-sales@fao.org

For more information on this publication, please contact:
Director
Investment Centre Division
Food and Agriculture Organization of the United Nations (FAO)
Viale delle Terme di Caracalla, 00153 Rome, Italy

Cover photo: ©FAO/Ami Vitale / FAO
TABLE OF CONTENTS

Foreword		                                  v
Acknowledgements                          vii
Acronyms and abbreviations                viii

1   Rising food demand and
    the nutrition challenge                 2
2   Agriculture as part of the solution   15
3   Focusing on comparative advantage     43
4   Producing more with less              63
FOREWORD
Countries in the Southern and Eastern Mediterranean (SEMED)
region are facing major food security challenges in the aftermath
of the 2008 economic crisis and the wave of social and political
transformations that started in late 2010. The region needs to
produce more with less and be “smarter” in terms of how it
participates in world trade and, in particular, regional food trade. It
will have to become a more efficient importer and simultaneously
add value to its agrifood production to make the best use of its
limited natural resources.
Food security in the region is a serious challenge because the
population is growing quickly, as is per capita income. Not only
will countries in the region need to produce more food to feed
a larger population, but they will also need to accommodate the
growing demand for more varied types and qualities of food
items. While progress has already been achieved, the current
structure of the agrifood sector still largely reflects self-sufficiency
concerns and a particular focus on cereals, which – given the
region’s agro-climatic conditions – has resulted in widening food
trade deficits for most countries.
Moreover, SEMED countries are facing increasingly tough conditions
for the development of the agrifood sector. This is particularly true for
primary agriculture and the production of key raw materials because
of climate change (with rising temperatures and increased frequency
of extreme climatic events) and growing water scarcity. The agrifood
sector is also under pressure to limit its greenhouse gas (GHG)
emissions and this means that more emphasis will have to be placed
on efficiency of energy and natural resource use and issues such as
water productivity.
In the short- to medium-term, it is likely that many governments in
the region will continue to face social pressure given fragile domestic
political situations, especially in the post-Arab spring context.
Promoting economic growth requires sound, market-driven policies
alongside measures that ensure political transition and maintain
stability. This will require public investments in critical infrastructure to
sustain growth in the agrifood sector as well as an adequate level of
social safety nets to protect the poor and vulnerable.
vOn the bright side, there are many opportunities that can be
exploited to build on key assets of the agrifood sectors in the
SEMED countries and maximize their potential contribution to the
region’s sustainable development. At present, this is high on the
agendas of the region’s policymakers.
The following collection of notes was initially disseminated at
the “Private Sector Forum on Food Security in the Southern and
Eastern Mediterranean Region” jointly organized by the Food and
Agriculture Organization of the United Nations (FAO), the European
Bank for Reconstruction and Development (EBRD) and the Union
for the Mediterranean (UfM) in May 2015. The notes aim to inform
EBRD agribusiness investments in the SEMED and disseminate
knowledge on current trends in agribusiness and food security.
The EBRD called upon FAO’s technical assistance to carry out an
analysis of key trends in the agribusiness sector of four specific
countries: Egypt, Morocco, Tunisia and Jordan. This process
resulted in four country notes with analyses of food consumption
patterns, production and trade, as well as agricultural policies.
While the individual notes were mostly descriptive, it was felt that
a document providing a comparative analysis across countries
would add value to the target audience, namely public officials,
development experts, the private sector and members of the civil
society. This publication thus sought to reframe the analysis of
sector trends in the region into a readily-accessible format in order
to contribute to more effective and efficient policies for improved
food security and nutrition. While the focus of the publication is
on four SEMED countries – Egypt, Morocco, Tunisia and Jordan -
many of its key findings and conclusions will also be of interest in
other regional and country situations, where FAO and the UfM are
active.
Laurent Thomas Philippe Le Houérou Claudio Cortese
Assistant Director- Vice President Senior Deputy Secretary
General Policy and Partnerships General
Technical Cooperation European Bank for Union for the
Department Reconstruction and Mediterranean
Food and Agriculture Development
Organization of the
United Nations
viACKNOWLEDGEMENTS
This publication is a joint product of FAO, the EBRD and the UfM.
It was financed by FAO and EBRD’s Special Shareholders’ Fund.
The publication was initiated and led by Nuno Santos, Economist,
Investment Centre, FAO and Iride Ceccacci, Food Security
Economist, EBRD who identified the major themes and
conducted the first edit of the different sections.
Boris Sterk, Economist, Investment Centre, FAO and Fabrizio
Moscatelli, Economist, Investment Centre, FAO co-authored the
report, making substantial contributions in terms of research and
writing of all sections. In addition, Arianna Carita, Economist,
Investment Centre, FAO conducted research and supported
drafting and reviewing of section four. The document was based
on agrifood notes drafted by different authors during 2014: Lisa
Paglietti, Investment Centre, FAO for Tunisia, Boris Sterk for
Egypt, Stefania Manzo, Investment Centre, FAO for Jordan and
Luciano Sobral, Investment Centre, FAO for Morocco.
The EBRD Operational Leaders for joint FAO/EBRD projects in
Egypt, Morocco, Tunisia and Jordan have provided significant
contributions to the report. Important guidance has also been
provided by the UfM, specifically Claudio Cortese, Senior
Deputy Secretary General and Kevin Bortz, Managing Director of
Financial Operations.
In addition to the lead authors (who in certain instances also
reviewed other sections), important guidance, major comments
and direct editing was provided by Lisa Paglietti, Alessandro
Flammini, GHG Emissions and Energy Specialist, Climate
Energy and Tenure Division, FAO, Francesco Tubiello, Senior
Environmental Statistics Officer, Statistics Division, FAO, Elisa
Lorenzon, Water Resources Expert, FAO, Peter Talks, Economist,
Investment Centre, FAO and, in particular, Genevieve Joy,
Consultant, Investment Centre, FAO.
viiFrom FAO, valuable support at the final stages of publication was
provided by Sarah Mercadante, Project and Communications
Officer, Investment Centre, FAO and Nada Zvekic,
Communications Officer, Investment Centre, FAO. Lastly, the
authors would like to thank Mohamed Manssouri, Chief, Europe
and Central Asia, Near East and North Africa, Latin America and
the Caribbean, Investment Centre Service, FAO, for his overall
guidance.
viiiACRONYMS AND ABBREVIATIONS
AAA Agriculture Analytic Agency
CIS Commonwealth of Independent States
CMU Cabinet of Ministers of Ukraine
EBITDA Earnings Before Interest, Taxes, Depreciation and
Amortization
EBRD European Bank for Reconstruction and Development
EU European Union
FAO Food and Agriculture Organization of the United
Nations
FSU Former Soviet Union
GDP Gross domestic product
GDR Global depository receipt
IPO Initial public offering
NPC Nominal protection coefficient
OECD Organisation for Economic Co-operation and
Development
PP Private placement
SCT Specific commodity transfers
TRQ Tariff-rate quota
UAH Ukrainian hryvnia
VAT Value added tax
VHP Very high polarization
WHO World Health Organization
WSE Warsaw Stock Exchange
WTO World Trade Organization
ixChapter 1 - Rising food demand and
the nutrition challenge
At a glance
Highlights
Food consumption in the southern and eastern Mediterranean (SEMED) region
is expected to increase due to growth in population and gross domestic product
(GDP) per capita;
Consumption patterns are changing: consumers are becoming more
demanding about food quality and safety - and as incomes rise, there is higher
consumption of meat and dairy products, oilseeds and sugar;
Domestic food supply is not expected to match growing domestic demand,
especially for cereals (mainly wheat). The share of cereals in daily caloric intake
is 40 percent higher in the region than in the rest of the world;
The region faces an important and complex nutrition challenge stemming from
high levels of child malnutrition and growing obesity problems.
Policy Relevance
Policies and institutional attitudes regarding quality assurance and promotion of
agricultural products will become increasingly important as consumers become
more informed and demanding;
Supportive policies and an enabling environment for private businesses,
including streamlined bureaucratic procedures, are key to leveraging domestic
market opportunities in agrifood processing that may arise from evolving
consumption patterns;
Creating job opportunities for the youth and designing and successfully
implementing social protection policies will be necessary for social stability and
food security;
Incorporating a nutrition lens in agrifood sector-related policies is essential
given current and growing challenges related to malnutrition and obesity; this
will require a cross-sectoral approach that includes education, health systems
and social protection.
2Egypt, Morocco, Tunisia and Jordan: Key trends in the agrifood sector
Large expected increase in food consumption by 2030
There are two underlying trends that will define the evolution of food
consumption in the SEMED region1 in the medium- to long-term: first,
population growth is forecast to continue at a relatively fast pace;
and second, GDP per capita is expected to increase. The current
population of the SEMED countries is just above 130 million people,
more than 80 million of whom live in Egypt, the largest country in
the entire Middle East and North Africa (MENA)2 region and the Arab
world. The total population of the SEMED countries is expected to
grow by about 7 percent in the next five years, reaching 146 million
people in 2020; and by almost 20 percent in the next 15 years
reaching 162 million people by 2030. By then, Egypt’s population
alone will number more than 100 million people (Figure 1).
Figure 1: Population and population estimates for SEMED countries, 1960-2030
120 14
100 12
10
80
8
millions
millions
million
million
60
6
40
4
20 2
- -
1960
1963
1966
1969
1972
1975
1978
1981
1984
1987
1990
1993
1996
1999
2002
2005
2008
2011
2014
2017
2020
2023
2026
2029
Morocco(left
Morocco (leftaxis)
axis) Egypt (left
Egypt (leftaxis)
axis) Jordan(right
Jordan (rightaxis)
axis) Tunisia (right axis)
Source: World Bank, Health Nutrition and Population Statistics
1 The four SEMED countries addressed in this report are Egypt, Morocco, Jordan
and Tunisia.
2 The 21 MENA countries are Algeria, Bahrain, Djibouti, Egypt, Iran, Israel, Jordan,
Kuwait, Lebanon, Libya, Malta, Morocco, Oman, Palestine, Qatar, Saudi Arabia,
Syria, Tunisia, United Arab Emirates and Yemen.
3This trend is confirmed by the total population growth of the entire
MENA region as illustrated in Figure 2. It is also possible to note the
opposite trend in European Union (EU) countries, which are predicted
to see their population growth flatten until 2030 and then decline.
In parallel, the significant economic growth in SEMED countries
that started in the early 2000s is forecast to continue, with average
per capita GDP levels increasing by more than one-quarter by
2019. More importantly, GDP per capita in Egypt – the region’s
demographical “giant” – is expected to rise by 50 percent during
that time period, and in Morocco – a country with a population of
34 million people – by 30 percent (Figure 3).
Figure 2: Population and population estimates EU and MENA countries,
1960-2030
600
500
400
300
million
200
100
0
1960
1962
1964
1966
1968
1970
1972
1974
1976
1978
1980
1982
1984
1986
1988
1990
1992
1994
1996
1998
2000
2002
2004
2006
2008
2010
2012
2014
2016
2018
2020
2022
2024
2026
2028
2030
Middle East & North Africa European Union
Source: World Bank, Health Nutrition and Population Statistics.
Changing consumption patterns
A growing population and higher GDP per capita mean that it
will be necessary to feed more people while accommodating
changing consumption patterns. Demand for meat and dairy
products, oilseeds, and sugar and is expected to increase. Higher
incomes and a more educated urban population will also translate
into more demand for quality food products. Such changes in
demand patterns towards more diversified and premium products
can be an opportunity for producers to differentiate their goods
4Egypt, Morocco, Tunisia and Jordan: Key trends in the agrifood sector
Figure 3: GDP per capita in SEMED countries, 1980-2017
5 000
4 500
4 000
3 500
constant 2005 USD
3 000
2 500
2 000
1 500
1 000
500
-
Egypt Jordan Morocco Tunisia
Source: Author’s calculations using data from International Monetary Fund (IMF) and World Bank.
Note: Data after 2010 are IMF forecasts.
on the market and can potentially lead to further development
of processing activities. Moreover, such trends should stimulate
new public policies, namely improved food safety and quality
standards linked to efficient regulatory institutions and governance
mechanisms.
A more detailed look at current consumption levels (Table 1)
shows some striking commonalities across the SEMED countries,
the most noticeable of which is the extremely high consumption
of cereals, primarily wheat. Cereals on average provide more than
one-half of the region’s daily per capita energy intake, which is
almost double the EU level of around 28 percent. This proportion
is greater in Egypt and Morocco, which display lower GDP per
capita levels, when compared to Jordan and Tunisia, which exhibit
higher per capita income and where the share of animal products
and vegetable oils is higher. As shown in Table 1, the contrast with
the EU is striking but expected given that consumers in poorer
countries tend to eat more staples: at similar total daily caloric
intake levels, the share of daily animal product consumption in the
5EU (29.1 percent) is almost three times higher than in the SEMED
countries (where it varies between 9.2 and 12.4 percent).
High consumption levels of cereals in general, and of wheat in
particular, in the SEMED region result from a number of factors
including GDP per capita, cultural norms and related consumption
habits. It is thus expected that cereals will continue to play an
important role in consumption despite the expected significant
growth in per capita GDP. The OECD-FAO Agricultural Outlook
estimates an increase in consumption levels for all product groups,
including a slight increase in per capita cereals consumption by
2023 for the North Africa region (Table 2). The most significant
increase in per capita consumption is expected for sugars
(+12 percent) followed by vegetable oils, meats, dairy products
and fish (all expected to increase by about 7 percent).
Table 1: Consumption of main food products in the SEMED countries
Morocco Jordan Tunisia Egypt EU
Product FS Share, FS Share, FS Share, FS Share, FS Share,
% % % % %
Cereals
1 933 58.0 1 432 45.5 1 702 50.6 2 217 62.3 950 27.8
(excl. beer)
Animal
307 9.2 391 12.4 344 10.2 336 9.4 993 29.1
products
Sugar and
381 11.4 407 12.9 347 10.3 304 8.5 363 10.6
sweeteners
Vegetable
262 7.9 523 16.6 433 12.9 147 4.1 485 14.2
oils
Vegetables 104 3.1 81 2.6 131 3.9 104 2.9 81 2.4
Total 3 334 100.0 3 149 100.0 3 362 100 3 557 100 3 416 100
Source: FAOSTAT, 2011.
Note: “FS” stands for food supply in daily per capita kilocalories (kcal/cap/day), while % stands
for share of total daily caloric intake. The table shows the five main categories of consumed food
products in the region and excludes other categories which are otherwise included in the total.
In3absolute terms, this means a considerable increase in consumption
levels for all product groups in North Africa, taking into consideration
population growth (Figure 4). Cereals consumption is expected
to increase by 13 percent, or 10 million tonnes, by 2023 – this will
represent the most significant absolute value rise of all product
groups. Fish and fish products consumption is expected to increase
3 Region includes Algeria, Egypt, Libya, Morocco and Tunisia.
6Egypt, Morocco, Tunisia and Jordan: Key trends in the agrifood sector
Table 2: Consumption forecast for selected product
groups for North Africa,3 kg/capita/year
Group 2015 2023 Change (%)
Cereals 262.9 264.9 0.7
Vegetable oils 20.6 22.1 6.9
Meats 23.6 25.3 7.2
Dairy 70.6 75.3 6.7
Sugars 40.7 45.6 12.1
Fish 16.5 17.6 6.9
Source: OECD-FAO Agricultural Outlook.
by 16 percent; meats, dairy products and oilseeds consumption
by 20 percent; and sugars by 23 percent. Increasing food demand
poses a notable challenge for SEMED countries, all of which are
important food importing countries. In aggregate terms, agricultural
trade deficits are expected to rise since domestic supply is not
anticipated to meet growing domestic demand for agricultural goods.
For instance, in North Africa the trade deficit for dairy is expected to
grow by 40 percent by 2023; for sugars by 30 percent; for oilseeds by
23 percent; for meats by 15.5 percent; and for cereals by 15 percent
(Figure 4). Naturally, aggregate figures hide many country specificities.
Figure 4: North Africa, total consumption outlook by product group, 2015-2023
18 88
16 86
14 84
12 82
million tonnes
10 80
million tonnes
8 78
6 76
4 74
2 72
0 70
2015 2016 2017 2018 2019 2020 2021 2022 2023
Oilseeds Meats Dairy Sugar Fisheries Cereals (right axis)
Source: OECD-FAO Agricultural Outlook.
7A closer look at Egypt – the only country in the SEMED region for
which individual FAO-OECD Agricultural Outlook data is available
– supports the above analysis. It shows that consumption of
wheat, the main staple food, will continue to grow at a relatively
stable rate (Figure 6) with a corresponding growth in wheat
imports (Figure 7). Meat consumption will increase faster than
wheat and will also be one of the factors responsible for the
rising consumption levels of both wheat and coarse grains
(including maize), since these are partially used as animal feed.
Over the span of one decade (between 2012 and 2022), Egypt
is therefore expected to experience a widening trade deficit in
Figure 5: North Africa, trade balance by product group, 2015-2023
- (34)
(35)
(2)
(36)
(4) (37)
million tonnes
(38)
million tonnes
(6)
(39)
(8)
(40)
(10) (41)
(42)
(12)
(43)
(14) (44)
2015 2016 2017 2018 2019 2020 2021 2022 2023
Oilseeds Meats Dairy Sugar Cereals (right axis)
Source: OECD-FAO Agricultural Outlook.
volume terms for key agricultural commodities: from 10.5 to
almost 11 million tonnes for wheat; from 5.8 to 6.3 million tonnes
for coarse grains; and from 567 thousand to 666 thousand tonnes
for meat.4 This expected increase in the trade deficit in wheat
alone is equivalent to Tunisia’s total wheat imports in 2013, while
the increase in the trade deficit in meat and coarse grains is higher
than the total amount of yearly consumption of these commodities
4 Data refers to the period 2013-2023 (source: OECD –FAO Agricultural Outlook data
for trade balance in selected agricultural commodities).
8Egypt, Morocco, Tunisia and Jordan: Key trends in the agrifood sector
in Jordan in 2011. In addition, the growing need for protein meal
(oilseeds) for animal feed and other uses is expected to result in an
increase in the commodity’s trade deficit from 1.9 to
2.3 million tonnes between 2013 and 2023.
The importance of cereals and nutritional outcomes
The high regional consumption of cereals, and especially wheat,
results from several factors beyond relatively lower income levels
as previously mentioned. In fact, SEMED countries have high
cereals consumption even when compared with countries of
similar GDP per capita in other regions of the world. Out of the
Figure 6: Egypt consumption forecast, Figure 7: Egypt import forecast,
2013-2023 2013-2023
25 000 2 750 12 000 680
2 700
660
20 000 2 650 10 000
2 600 640
million tonnes
million tonnes
8 000
2 550 620
15 000
2 500
6 000 600
2 450
10 000
2 400 580
4 000
2 350
560
5 000 2 300
2 000
540
2 250
- 2 200 - 520
2013 2014 2015 2016 2017 2018 2019 2020 2021 2022 2023 2013 2014 2015 2016 2017 2018 2019 2020 2021 2022 2023
Wheat Coarse grains Meat (right axis) Coarse grains Wheat Meat (right axis)
Source: FAO-OECD Agricultural Outlook.
21 world subregions defined in the United Nations geoscheme,
North Africa by far has the highest daily per capita intake from
cereals (Table 3). The arithmetic average for daily per capita
caloric intake from cereals in the four SEMED countries is
extremely high at about 40 percent more than average world
consumption.
Another important characteristic of SEMED countries is that
wheat consumption constitutes the majority of overall cereals
consumption: it is the highest in Tunisia, where it accounts for 96
percent of total cereal consumption, and lowest in Egypt, where it
nevertheless accounts for more than one-half of all daily per capita
calories from cereals (Table 4).
9Table 3: Daily per capita caloric intake from cereals
Region kcal
World 1 296
North Africa 1 787
South-East Asia 1 536
Southern Africa 1 508
Western Asia 1 448
Source: FAOSTAT, 2011.
As can be observed from Figure 8, the four SEMED countries
are amongst the top 10 consumers of wheat worldwide in terms
of the share of wheat in total daily caloric intake. Tunisia has the
highest level in the world (almost 50 percent), compared with a
world average of 18.5 percent.
Table 4: Consumption of main cereals in SEMED countries
Egypt Jordan Morocco Tunisia
Product kcal/ % share of kcal/ % share of kcal/ % share of kcal/ % share
cap/ cereal cap/ cereal cap/ cereal cap/ of cereal
day consumption day consumption day consumption day consumption
Wheat
and 1 161 52.4 1 200 83.8 1 373 71 1 632 95.9
products
Maize
and 604 27.2 24 1.7 273 14.1 n/a n/a
products
Rice 414 18.7 204 14.2 6 0.3 14 0.8
Source: FAOSTAT, 2011.
Poverty in SEMED countries
Significant poverty levels, combined with higher food prices since
2008, pose an important challenge to the food security and nutrition
of the most vulnerable groups with possible repercussions on
social and political stability. Since poverty is expected to persist in
both absolute and relative terms, especially in Egypt, creating job
opportunities for the youth and designing and implementing social
policies for food security will thus be crucial in the coming years --
and the agrifood sector can play an important role.
10Egypt, Morocco, Tunisia and Jordan: Key trends in the agrifood sector
Figure 8: Consumption of wheat as a share of total caloric intake
Japan
Tunisia 50% United States of America
Algeria Austria
45%
Morocco Canada
40%
Jordan 35% China
30%
Libya 25% World
20%
Turkey 15% Spain
18.5%
10%
Albania 5% Germany
0%
Egypt 33.2% Finland
Russian Federation United Kingdom
Bulgaria France
Italy Belgium
Serbia Saudi Arabia
Romania Poland
Lithuania United Arab Emirates
Ukraine
Source: FAOSTAT, 2011.
Egypt and Morocco are not only the SEMED’s largest countries,
but they have also the largest rural populations and the highest
prevalence of both overall poverty and rural poverty in particular. In
parallel, according to the World Bank poverty forecast,5 the MENA
region is the only one in the world where overall extreme poverty
levels (at the USD 1.25 per day line) are expected to increase,
reaching 2.4 percent of the population in 2030 from the current
2 percent (Figure 9). Such a projection seems to result mainly
from poverty growth in Egypt and the relative weight of this large
country within the region. Poverty levels measured at national
poverty lines have decreased in Jordan, Morocco and Tunisia in
the last decade, while the latest data for Egypt indicates that its
poverty has risen from 16.7 percent in 2000 to 25 percent in 2011,
with extreme poverty levels decreasing only marginally, from
1.81 percent in 2000 to 1.68 percent in 2008.
5 World Bank Group. 2015. Global Monitoring Report 2014/2015: Ending Poverty and
Sharing Prosperity.
11Improving nutritional outcomes in SEMED countries
Given these consumption trends and poverty levels, the SEMED
countries face an important nutrition challenge both from high
levels of child malnutrition and growing obesity problems.
Figure 10 depicts the prevalence of stunted6 children in a number
of Mediterranean countries (including the four SEMED countries).
It shows that the percentage of stunted children under five years
of age, an accepted measure of childhood malnutrition, is above
5 percent for all countries measured. Egypt has the highest
prevalence (31 percent), while Jordan, Tunisia and Morocco have
rates of 8, 10 and 15 percent, respectively. Figure 10 also suggests
that GDP per capita is not the only important factor for cross-country
differences in prevalence of stunting because of the lack of clear
correlation between the two variables. As previously discussed, one
of the possible explanations is the relationship between low GDP
per capita and poor dietary diversity,7 which in the MENA region
Figure 9: Poverty forecasts, 1990-2030
70
Percent of population below US1.25$ a day, 2005 PPP
60
50
40
30
20
10
0
1990 2005 2008 2010 2011 2015 2020 2030
East Asia and Pacific South Asia
Sub-Saharan Africa Eastern Europe and Central Asia (right axis)
Latin America and the Caribbean (right axis) Middle East and North Africa (right axis)
Source: World Bank, 2014.
Note: Poverty defined as under USD 1.25 per day in 2005 purchasing power parity (PPP).
6 The indicator for stunting is low height-for-age, a measurement that is calculated
by comparing the height of a child against the WHO international growth reference
for a child of the same age (WFP glossary).
7 Defined as the number of unique foods consumed by household members over a
given period.
12Egypt, Morocco, Tunisia and Jordan: Key trends in the agrifood sector
is expressed in high consumption of certain high-calorie foods like
cereals, and wheat above all. In addition to economic growth and
job creation, factors such as nutritional education, efficient health
systems and social security programmes have a role to play in
addressing this critical problem in the coming years.
Figure 10: Prevalence of stunting in children under five years of age, 2010-2014
35
30 Egypt
25
Albania
Libya
20
percent
Algeria
15 Morocco
Tunisia Bosnia and
10 Turkey
Herzegovina
Jordan
Serbia
5
0
0 5 000 10 000 15 000 20 000 25 000
GDP PPP per capita (constant 2011 international USD)
Source: Author’s calculations based on World Bank data.
Obesity, including childhood obesity, is a worldwide public health
problem with significant cross-country differences generally
linked to per capita income disparities, economic transition, and
changes in food consumption habits towards diets higher in
fats (namely saturated fat) and sugar. There are also significant
within-country differences according to socioeconomic population
groups.8 A systematic review by Musaiger (2011) of published
articles between 1990 and 2011 concluded that obesity is reaching
alarming levels across all age groups in the Eastern Mediterranean
8 Wang, Y. 2001. Cross-national comparison of childhood obesity: the epidemic and
the relationship between obesity and socioeconomic status. International Journal
of Epidemiology.
13countries.9 The article found that the proportion of overweight or
obese children in the Eastern Mediterranean region nearly doubled
from 23.5 million in 2001 to 41.7 million in 2010. These numbers
put the region second only to the United States in terms of child
overweight and obesity levels. There are many reasons for this, but
generally it is found that obesity is linked to socioeconomic status.
Obesity, however, does not exclusively affect population groups
with a higher socioeconomic status but it actually tends to shift
towards groups with lower socioeconomic status. Among SEMED
countries, the prevalence of obesity is already similar to that of
high-income countries: in Jordan and Egypt, 27.3 and 22.5 percent
of the adult population is obese.10
Besides socioeconomic status, other inter-related factors such
as culture, physical inactivity and eating habits also contribute
to obesity. In addition, agricultural policies that impact relative
food prices play a role in nutritional outcomes. For example in
Egypt, Asfaw (2006) suggests that the food subsidy programme
implemented during the Second World War resulted in price
reductions for energy-dense, nutrient-poor food items such as
bread, sugar and oil in real and in relative terms as compared
to healthier items such as fruits and vegetables.11 In turn, such
high differential in energy costs leads households to choose high
energy but poor diet quality foods.
Other policy interventions in the region aimed at maintaining social
cohesion through low prices of poor diet quality food products may
have similar effects. This is the case of trade policies, subsidies
and other distortionary interventions. Tackling nutritional issues in
food security in the region will therefore require a more nutrition-
sensitive set of policies, i.e. policies that take into consideration
possible negative consequences of the distortions introduced in
the final household food consumption mix.
9 Musaiger. 2011. Overweight and Obesity in Eastern Mediterranean Region:
Prevalence and Possible Causes. Journal of Obesity, vol. 2011, Article ID 407237.
Note: Eastern Mediterranean countries in this case refers to the WHO definition
which includes all Arab countries, excluding Algeria, in addition to Afghanistan, Iran
and Pakistan.
10 WHO. 2008. Prevalence of adults of both sexes 20 years and above with a body
mass index of 30kg/m2 or higher.
11 Asfaw, A. 2007. Do government food price policies affect the prevalence of
obesity? Empirical evidence from Egypt. World Development, 35:687-701
14Egypt, Jordan, Morocco and Tunisia: Key trends in the agrifood sector
Chapter 2 - Agriculture as part of the solution
At a glance
Highlights
The agrifood sector plays a different role across countries in the region in terms
of weight in the economy, employment and poverty. In global terms, Southern
and Eastern Mediterranean countries (SEMCs)* can be classified mostly as
urbanized or transforming countries;
Agriculture can play an important role in the SEMCs, namely in reducing
unemployment (in particular youth unemployment);
Cereals are the main source of nutrition but none of the SEMCs are self-
sufficient (for example Jordan imports 98 percent and Morocco 40 percent of
its cereal needs);
Land productivity has improved dramatically, but yields are still low and yield
gaps suggest significant potential for improvement;
Private investment is by far the main source of investment in the agrifood
sector above public investment and international aid. The private sector is
therefore a key part of solving the region’s food security equation;
The State is an important investor in agriculture, albeit one of declining
importance and with limited room for fiscal expansion. Simultaneously,
food subsidies as part of social protection measures have important fiscal
implications (for example reaching 2.5 percent of Egypt’s GDP in 2011).
Policy Relevance
Strategic planning of policy options is fundamental, especially for some of
the SEMCs, which need to take into account social issues in often delicate
domestic political situations;
Policies focusing on building skills and sector linkages (for example between
primary agriculture and agro-processing), among others, can be important if the
agrifood sector is expected to play a bigger role in employment (in particular
for young people);
Policies focusing on reducing the gap between potential and real yields by
addressing its key binding constraints will continue to be very relevant in
the near future;
Government policies can help support the private sector through appropriate
regulations, the supply of essential public goods and the creation of a good
business environment favouring responsible private investment in agriculture;
A weaker fiscal situation is creating pressure on the region’s governments
to adopt innovative policies that are able to simultaneously promote agrifood
sector growth and maintain critical social protection levels. Improving efficiency
of public spending and in particular targeting of food subsidies will continue to
be high on the region’s policy agenda.
* The analysis in this note refers to a selection of Southern and Eastern Mediterranean countries,
which are part of the group that constitutes the Euromed partnership countries of the EU and the
four EBRD SEMED region countries, namely: Algeria, Morocco, Egypt, Israel, Lebanon, Tunisia,
Jordan and Turkey.
15The strategic role of agriculture
Two rural worlds
Economically, the agricultural sector plays a role of varying
importance across the SEMCs: it is significant in Egypt and
Morocco, of relative importance in Algeria, Tunisia and Turkey,
and much less so in Israel, Jordan and Lebanon, which are highly
urbanized countries.12 However, it is important to underline that
in all SEMCs, agriculture maintains a prominent role in terms of
social stability at a delicate moment in the region’s transition.
Two types of SEMCs can be identified, with differences between
them underlined not only by differences in their respective
strategic plans, but also through a selection of socio-economic
indicators. Differences can first be noticed at the demographic
level. While more than one-half of the population in Egypt and
about 40 percent of the population in Morocco are rural, in Tunisia
and Jordan a vast majority of the population (more than two-
thirds and four-fifths, respectively) lives in urban areas (Figure 11).
The share of rural population in Jordan is in fact even lower than
the Organisation for Economic Co-operation and Development
(OECD) average of about 25 percent. In parallel, important
differences can also be observed concerning the extent to which
poverty affects the rural populations in different countries. More
than two-thirds of Egypt and Morocco’s poor13 are rural, while
this is the case for less than one-third of Tunisia’s poor and for
about one-fifth of Jordan’s poor (Figure 11). The case of Turkey
is quite striking in that of all SEMCs for which data is available,
it has the highest share of rural poverty out of total poverty
(74 percent) – a number comparable to Egypt – while at the same
time it remains a largely urbanized country with less than one-third
of its population living in rural areas.
12 More than 80 percent of people in these countries live in urban areas; as a
matter of comparison, the 2013 EU average was 74 percent.
13 At national poverty lines as per World Bank data.
16Egypt, Jordan, Morocco and Tunisia: Key trends in the agrifood sector
Figure 11: Rural population and rural poverty in selected SEMCs14
80 73 74
68
70
60 57
50
percent
40
40 33
30 29
30
20
20 17
10
0
Egypt Morocco Tunisia Turkey Jordan
Rural population Rural poverty
Source: World Bank and author’s calculations.
The World Bank 2008 World Development Report14(WDR)15
drew a distinction between three types of countries based on
agriculture’s social and economic role: “the way agriculture
works for development varies across countries depending
on how they rely on agriculture as a source of growth and
an instrument for poverty reduction”.16 In this study, we use
an adaptation of the report’s original typology by looking at
agricultural GDP’s share in total GDP instead of agriculture’s
contribution to growth, as a proxy for agriculture’s significance
in the economy. While the way we measure this significance is
slightly different, the divide between countries is still apparent.
14 he share of rural poor out of total poor referred to in figures 2.1 and 2.2 has
T
been calculated based on latest available data for the following three indicators
from the World Bank: (1) Rural poverty headcount ratio at national poverty lines
(% of rural population), (2) Rural population (% of total population), (3) Poverty
headcount ratio at national poverty lines (% of population). Only countries for
which data has been available after 2001 have been taken into consideration. For
SEMCs, data for each country and each indicator is as follows: Egypt – (1) 2011,
(2) 2013, (3) 2011; Morocco – (1) 2007, (2) 2013, (3) 2010; Tunisia – (1) 2009, (2)
2013, (3) 2010; Turkey – (1) 2012, (2) 2013, (3) 2012; Jordan – (1) 2010, (2) 2013,
(3) 2010. Data on rural poverty for Tunisia is based on an IFAD country fact sheet
from 2011, available at: http://www.ifad.org/events/gc/34/nen/factsheet/tunisia.
pdf (last accessed: 23 April 2015).
15 Data are author’s adaptation of the World Bank. 2007. World Development
Report 2008. Washington D.C.
16 Ibid. p. 4.
17Accordingly, SEMCs seem to be split in two different groups
(Figure 12): Jordan and Tunisia, countries where the share of
agriculture in GDP and agriculture’s contribution to GDP growth are
relatively low and where poverty is mostly urban, can be classified
as urbanized countries. Egypt, Morocco and Turkey, in contrast,
while also displaying a relatively low importance of agriculture for
the economy, are countries where poverty is still predominantly
rural and thus fall in the category of transforming countries.17 In
fact, as the WDR observes, 92 percent of the population of the
MENA live in such countries.1819
Figure 12: Agriculture’s share of GDP and rural share of poverty19
60
Central African
Republic
50
Ethiopia
Agriculture-based countries
Mali
40 Liberia
percent
30 Mozambique
Malawi
Transforming countries Afghanistan
20 Nigeria
Syria Mauritania India
Urbanized countries
Morocco
Tunisia Egypt Angola
10 Uruguay Malaysia Turkey
Swaziland
Chile
Jordan
0
0.00 0.20 0.40 0.60 0.80 1.00
Rural poor/total poor
Source: World Bank data and author’s calculations.
17 Data for the other three SEMCs was not available.
18 Ibid.
19 Please, refer to footnote no. 2. Please, also note that the graph shows the
agricultural value added as percentage of total GDP in a single year, and not the
growth of the agricultural value added as percentage of total GDP.
18Egypt, Jordan, Morocco and Tunisia: Key trends in the agrifood sector
A closer look at the evolution of agriculture’s contribution to
overall GDP shows that it has generally been falling in all countries
(Figure 3). Jordan clearly stands out as a country which has
completed the “transformation process” towards an urbanized
country: after a sustained decrease in agriculture’s value added
to GDP until the early 2000s, it stabilized at a level of about
3 percent. Lebanon is in a similar situation with a contribution
of agriculture to GDP of about 5 percent. The decrease has also
been quite dramatic in Algeria, Tunisia and Turkey. In the latter
two, agriculture’s contribution to GDP was the same as in Egypt
and Morocco (17-19 percent) in the early 1990s but has currently
fallen to levels of around 9 percent. Turkey is a peculiar case in
that, while agriculture’s importance in the economy has decreased,
reaching levels more typical of urbanized countries, poverty
remains overwhelmingly rural (74 percent of total). In Egypt
and Morocco, the decrease started in the early 2000s and has
been more modest, with current levels of around 14-15 percent.
As a matter of comparison, the OECD average of agriculture’s
contribution to total GDP was 1.4 percent as of 2012 and the EU
average was 1.6 percent.
In all SEMCs, GDP per capita levels have risen dramatically in
the last 35 years. Nevertheless, inequalities can be observed in
this regard too. The divide between Jordan and Tunisia on the
one hand, with GDP per capita levels20 in the range of
USD 4 500-5 000, and Egypt and Morocco on the other, with
levels in the range of USD 3 000, persists. Overall, however,
income levels remain considerably lower than the average levels
in the OECD (USD 38 000) or in the EU (USD 35 000).
Agriculture and unemployment
An important indicator of agriculture’s socio-economic impact is its
share in employment. As expected, it is the highest in Morocco
and Egypt, where respectively 40 percent and 30 percent of all
employed people work in the agricultural sector, which are then
followed by Tunisia (about 15 percent) and Jordan (about 2 percent).
In the last ten years, employment in agriculture as a share of total
employment has been decreasing very slightly (between 2 and
4 percent), mostly to the benefit of the services sector, which
20 Data is from 2014, in current USD.
19Figure 13: Agriculture value added to GDP (five year moving average),
1993-2013
22
20
18
16
14
percent
12
10
8
6
4
2
0
1993
1994
1995
1996
1997
1998
1999
2000
2001
2002
2003
2004
2005
2006
2007
2008
2009
2010
2011
2012
2013
Algeria Egypt Jordan
Tunisia Turkey Morocco
Lebanon European Union
Source: World Bank.
has generally been gaining importance except in Egypt where it
has remained relatively stable. Nevertheless, even in Egypt and
Morocco, the services sector currently provides most jobs.
The agricultural sector is also perceived as playing a key role in
fighting youth unemployment, which is a major problem in the
SEMCs and one that can decisively impact their current delicate
political transition. Many organizations and policy-makers argue
that agriculture can be the “missing link” for youth employment.
For example, the International Labour Organization (ILO) argues
that ”the agricultural sector has a huge potential to create jobs but
needs to polish its image in order to attract more young people.
To do this, governments should provide relevant education and
training”.21
21 Cognac, Matthieu. 2 June 2014. Agriculture and Youth Employment: The Missing
Link. Huffington Post (available at http://www.ilo.org/global/about-the-ilo/
newsroom/features/WCMS_235524/lang--en/index.htm).
20Egypt, Jordan, Morocco and Tunisia: Key trends in the agrifood sector
Recent data shows youth unemployment increasing for almost all
the MENA countries, with the exception of Tunisia, which had a
peak in 2011 (42 percent youth unemployment rate), the highest
for SEMED countries, but then registered a decline in subsequent
years. Egypt is the country where the youth unemployment rate
has the most worrying trend, having reached 39 percent of the
total labour force ages 15 to 24. Jordan too has a very high rate
of youth unemployment with a recent trend of growth reaching a
level of 34 percent, while Morocco has a slightly lower rate ranging
between 15 and 20 percent.
This, however, is neither surprising nor a phenomenon unique to
the SEMED region: youth unemployment has also risen in many
EU Mediterranean countries to extremely high levels: 55.5 percent
in Spain, 58.3 percent in Greece, 40 percent in Italy and 37.7
percent in Portugal, for example.22
Figure 14: Youth unemployment, 1991-2013
45
40
35
30
percent
25
20
15
10
5
-
Egypt European Union
Jordan Morocco
Middle East & North Africa (all income levels) Tunisia
Source: World Bank (modeled ILO estimate).
Note: Youth unemployment is measured as unemployed percentage of labour force, ages 15-24.
22 UROSTAT reported youth unemployment rate for 2013. Youth unemployment
E
rates have to be taken with caution as the denominator is the labour force (i.e.
only those young people working or looking for a job). An additional indicator
is the unemployment ration, which calculates share of youth unemployed as
percentage of all young population. Naturally this is much lower: 16.6 percent
in Greece, 20.8 percent in Spain, 10.9 percent in Italy and 13.5 percent Portugal.
21While youth unemployment has risen in all countries following
the 2008 economic crisis, agriculture seems to have played a
part in downplaying its effects: the African Economic Outlook
2012 has found that “informal sector activities and farming
have absorbed the impact of the [2008] crisis”. 23 Data for a
set of African countries (which includes Algeria, Egypt and Tunisia
among others) shows that while agriculture employed 34 percent
of youth in 2008, its share had risen to 38 percent in 2010. From
the countries of interest to us, this evolution has been most
striking in Egypt, as Figure 15 below suggests: agriculture’s share
in youth employment increased from 6 percent before the crisis
to 23 percent in 2010.
Figure 15: Egypt youth employment by occupation, 2008 and 2010
35 32
30 27
25 23
20
18 18
percent
20
15
15 12
10 7 7
5 6
5
0 1
0
2008 2010
Source: African Economic Outlook, OECD 2012.
While this is an indication of the agriculture sector’s capacity as
a “buffer” for employment in times of economic stress, for it to
become part of a long-term solution to the youth unemployment
problem, important changes have to take place. For example,
23 OECD Development Centre. 2012. African Economic Outlook 2012: Promoting
Youth Employment.
22Egypt, Jordan, Morocco and Tunisia: Key trends in the agrifood sector
improvements have to be made in order to attract the young
and to make agriculture profitable, competitive, and dynamic.
For rural young women and men, who typically cannot afford to
be unemployed or inactive, working in agriculture largely means
having to engage in low-productivity, low-income jobs and unpaid
family work in areas that generally provide fewer social services,
and where they are trapped for lack of alternatives and adequate
skills. This pushes many of them to move to urban areas or abroad,
where they often end up in informal employment, unemployment or
poverty, leading to exploitation, marginalization, social unrest, and in
some cases political instability.24
According to the WDR 2008,25 there are good prospects for
promoting rural incomes in transforming countries (see also Figure
12 above). The rapid expansion of domestic markets for high
value added products such as horticulture, poultry, fish or dairy
offers an opportunity to “diversify farming systems and develop a
competitive and labour-intensive smallholder sector”.26 In parallel,
export markets present another opportunity as transforming
countries normally have a comparative advantage in labour- and
management-intensive activities. This point is also highlighted in
the OECD’s African Economic Outlook for 2012, which considers
the rural sector as having the potential to be “an engine of
inclusive growth and youth employment”.
Finally, while agriculture is certainly part of the solution, rural
unemployment should also be addressed through a broader
approach that focuses on other sectors. For example, the WDR
2008 dedicated to agriculture underlined the importance of
confronting rural unemployment by promoting “a dynamic rural
nonfarm sector in secondary towns, linked both to agriculture
and the urban economy”. The concept is to focus on agriculture-
related activities that may be more attractive to young people.
For example, in Morocco, a recent World Bank report on youth
employment observes that the food processing and marketing
subsectors seem to be much more attractive for young people
24 romoting decent and productive employment of young people in rural areas
P
(ILO-IFAD, 2012).
25 World Bank. 2007. World Development Report 2008. Washington D.C.
26 Ibid.
23than primary agriculture.27 As the report further states, these
subsectors are more attractive in that they offer higher pay and
better career development opportunities. As the role of the
agricultural sector naturally diminishes as a share of the economy
of transforming countries, facilitating labour mobility to the
dynamic sectors of the economy (such as agri-processing) can
be accelerated through appropriate policies, for example through
investments in skills for the young. 28
Trends in productivity
A quick analysis of production statistics for the SEMCs reveals
marked differences in land use. On one hand, Jordan, Lebanon,
Israel and Tunisia dedicate only between one-fifth and one-third of
their total harvested area to growing cereals (Figure 16) despite
the fact that such crops are the main source of nutrition (by a large
margin – see section 1 for details). These countries use most of
their land resources for growing fruit, vegetables and oil crops
(especially olives), which are competitive export commodities (for
more detail see section 3), and rely on imports to meet domestic
demand for cereals (Figure 17). On the other hand, Algeria, Egypt,
Morocco and Turkey use most of their land resources (between
60 and 70 percent) for growing cereals – overwhelmingly wheat
Figure 16: Harvested area share by crop groups
100
80
percent
60
40
20
0
Jordan Lebanon Israel Tunisia Algeria Egypt Morocco Turkey
Cereals Oil crops Fruit Vegetables Other
Source: FAOSTAT, 2011.28
27 Kingdom of Morocco: Promoting Youth Opportunities and Participation, World
Bank Report No. 68731 – MOR, June 2012, Middle East and North Africa Region,
Sustainable Development Department.
28 Vegetables also include melons. The “Other” category includes roots and tubers,
treenuts, pulses and fiber crops.
24Egypt, Jordan, Morocco and Tunisia: Key trends in the agrifood sector
Figure 17: Domestic production versus imports of cereals29
100
90
80
70
60
percent
50
40
30
20
10
0
Jordan Lebanon Israel Tunisia Algeria Egypt Morocco Turkey
Production Imports
Source: FAOSTAT for domestic supply; For imports: AMIS for Egypt (2012/2013 imports), USDA PSD
for Morocco (2012/2013 imports) and GTIS for all other countries.
– which is mainly intended to meet domestic demand (Figure 6).
These countries are, as a consequence, more self-sufficient in
meeting domestic demand for cereals (Figure 17).
An interesting historical perspective can be obtained by comparing29
the cereal harvesting areas and production quantities of the four
SEMED countries with those of southern Europe.30 As shown
in Figure 18, the SEMED region has increased both cereal areas
harvested and production from 1980 to date. In the same period,
southern European countries on aggregate have witnessed a major
reduction in cereal hectares harvested (from about 20 million
to below 15 million), while maintaining approximately the same
production level (albeit with some volatility as can be seen in
Figure 8).
Yields for cereals have increased at high rates for all four SEMED
countries between 1980 and 2013 (by around 80 percent on
29 Imports and production as percentage of total imports plus production.
30 Southern Europe includes: Albania, Andorra, Bosnia and Herzegovina, Croatia,
Gibraltar, Greece, Holy See, Italy, the Former Yugoslav Republic of Macedonia,
Malta, Montenegro, Portugal, San Marino, Serbia, Slovenia, Spain; SEMED
countries include: Egypt, Jordan, Morocco and Tunisia.
25Figure 18: Cereals, area harvested and production quantity, 1980-2013
25 80
70
20
60
million tonnes
million hectares
15 50
40
10 30
20
5
10
0 -
1980 1983 1986 1989 1992 1995 1998 2001 2004 2007 2010 2013
Area harvested, Southern Europe (left axis)
Area harvested, SEMED (left axis)
Production quantity, Southern Europe (right axis)
Production quantity, SEMED (right axis)
Source: FAOSTAT and author’s calculations.
average) (Figure 19). Still, as highlighted in Figure 19, cereal
yields in the SEMED countries have remained relatively low at
around 3 400 kg/ha compared to southern European countries
(3 850 kg/ha); and 40 percent lower than the European Union
aggregate (around 5 300 kg/ha). Interestingly, according to
FAOSTAT data the only exception is Egypt where, at a level of
Figure 19: Cereals, average yield per hectare, 1980-2013
6 000
5 000
4 000
kilograms
3 000
2 000
1 000
-
1980 1983 1986 1989 1992 1995 1998 2001 2004 2007 2010 2013
Southern Europe SEMED countries European Union
Source: FAOSTAT and author’s calculations.
26Egypt, Jordan, Morocco and Tunisia: Key trends in the agrifood sector
7 200 kg per hectare, cereal yields even surpass the EU average.
Part of the explanation could be the higher share of irrigated
cereal area in Egypt compared to other countries.
As a result of the yield and area evolution, SEMED countries
have achieved noticeable increases in total cereal production
between 1980 and today. In aggregate terms, SEMED countries
increased cereal production by 138 percent in the last three
decades, passing from 14 million tonnes in 1980 to 34 million
tonnes by 2013; in contrast, during the same period, production
in southern Europe has remained fairly stable at around
60 million tonnes.
Regarding the dynamics by country, the only exception to the
SEMED trend is Jordan, where the increase in yields was
lower than the reduction in harvested cereals area resulting in a
40 percent decrease in total cereal production. The total quantity of
cereals produced in Egypt has almost tripled in 30 years, reaching
23 million tonnes; and it has doubled in Morocco to a value of
10 million tonnes in 2013. The increase in production in Tunisia was
slightly above 10 percent. In addition, Jordan and Morocco display
high variability of annual cereal production levels (it is much less
pronounced in Egypt and Tunisia).
As already suggested above by looking at the evolution in cereal
yields, analysis of labour and land productivity, as well as total
factor productivity (TFP) seems to indicate the region has made
great progress over the past 30 years.
Looking at agricultural value added per worker (Figure 20)
below shows that in all four SEMED countries, there is a
positive trend consistent with the general positive trend
observable in the larger MENA region. In absolute terms,
Egypt is interestingly the country displaying the lowest values:
in 2013, agricultural value added per worker was USD 2 470,
almost one-half the average value in the other three countries
considered (USD 4 500).
Unsurprisingly, the entire region still displays values far below
the ones registered in Euro-Mediterranean countries (which exhibit
figures that are on average ten times higher). The only SEMED
country that reaches values comparable to EU countries is Turkey,
27You can also read