Kim, H., Shiokawa, K., Park, J., Miyoshi, Y., Stolle, C., Buchert, S. (2021): Statistical Analysis of Pc1 Wave Ducting Deduced From Swarm ...
←
→
Page content transcription
If your browser does not render page correctly, please read the page content below
Kim, H., Shiokawa, K., Park, J., Miyoshi, Y., Stolle, C.,
Buchert, S. (2021): Statistical Analysis of Pc1 Wave
Ducting Deduced From Swarm Satellites. - Journal of
Geophysical Research: Space Physics, 126, 3,
e2020JA029016.

https://doi.org/10.1029/2020JA029016

Institional Repository GFZpublic: https://gfzpublic.gfz-potsdam.de/
RESEARCH ARTICLE Statistical Analysis of Pc1 Wave Ducting Deduced From
10.1029/2020JA029016
Swarm Satellites
Key Points:
Hyangpyo Kim1 , Kazuo Shiokawa1 , Jaeheung Park2,3 , Yoshizumi Miyoshi1 ,
• P c1 wave ducting is mainly observed
Claudia Stolle4 , and Stephan Buchert5
over the SAA longitudes, possibly
due to high Hall conductivity and 1
Institute for Space-Earth Environmental Research, Nagoya University, Nagoya, Japan, 2Korea Astronomy and Space
plasma density there
• The seasonal distribution shows a Science Institute, Daejeon, South Korea, 3Korea University of Science and Technology, Daejeon, South Korea, 4GFZ
higher occurrence during equinox German Research Centre for Geosciences, Potsdam, Germany, 5Swedish Institute of Space Physics, Uppsala, Sweden
and local summer than during local
winter
• Both ionospheric plasma density Abstract Transverse Pc1 waves propagating from magnetospheric source regions undergo mode
and geomagnetic activity (or
wave injection) contribute to the conversion to the compressional mode in the ionosphere due to the induced Hall current. Mode converted
occurrence of ducting Pc1 waves propagate across the magnetic field through the ionospheric waveguide. This process is called
Pc1 wave ducting (PWD). PWDs have been observed by magnetometers on both ground and low Earth
Supporting Information: orbit satellites over a wide latitudinal and longitudinal range. In this work, we present the statistical
• Supporting Information S1 analysis results of PWD exploiting Swarm satellites from 2015 to 2019. Spatial distributions show that the
PWDs are mainly observed over the South Atlantic Anomaly longitudes, possibly due to the high Hall
Correspondence to: conductivity and F-region density, and at subauroral/auroral latitudes (50 70 MLAT). The occurrence
H. Kim, rate of PWD increases with increasing AE and |SYM-H| indices. Seasonal dependence shows that PWD
kim.hyangpyo@isee.nagoya-u.ac.jp exhibits a high occurrence rate during equinox and local summer while local winter hosts only a low
occurrence. The asymmetry between summer and winter can be explained by the ionospheric plasma
Citation: density. The high occurrence rate in equinox may result from intense geomagnetic activity during the
Kim, H., Shiokawa, K., Park, J., equinox, probably due to the Russell-McPherron effect. From our statistical analysis, we conclude that the
Miyoshi, Y., Stolle, C., & Buchert, S.
(2021). Statistical analysis of Pc1 wave
occurrence of PWD is controlled by both ionospheric plasma conditions and geomagnetic activity, and
ducting deduced from Swarm satellites. that the mode conversion and PWD occur more efficiently as plasma density increases.
Journal of Geophysical Research: Space
Physics, 126, e2020JA029016. https://
doi.org/10.1029/2020JA029016
1. Introduction
Received 9 DEC 2020 Pc1 waves are known as continuous geomagnetic pulsations observed in the ultralow frequency range
Accepted 8 FEB 2021
(0.2–5 Hz). These waves are mainly generated in the inner magnetosphere by anisotropic distributions of
energetic ions and often subsequent nonlinear processes, and are generally accepted as representing elec-
tromagnetic ion cyclotron (EMIC) wave (Anderson et al., 1996; Cornwall, 1965; Kennel & Petschek, 1966;
Shoji et al., 2017). Pc1 waves initially propagate along the magnetic field as Alfvén mode with left-handed
polarization. Then, they undergo mode conversion to right-handed or linear polarization during the prop-
agation toward the Earth (e.g., Sakaguchi et al., 2013). Recently, Miyoshi et al. (2019) showed that EMIC
waves are generated through the mode conversion from the equatorial noise at lower-L-shells. Once Pc1
waves reach the highly conductive ionosphere, the Alfvén mode Pc1 waves are converted to the compres-
sional mode (or fast mode) by induced Hall currents. Afterward, they propagate across the magnetic field
along the ionospheric waveguide within the F2 layer. This process is called Pc1 wave ducting (PWD) (e.g.,
Fraser, 1975a, 1975b; Fujita & Tamao, 1988; Yoshikawa & Itonaga, 2000). Mode converted Pc1 wave can
propagate over thousands of kilometers, even across the equator, and they are observed by magnetome-
ters on both ground and low Earth orbit satellites (Kawamura et al., 1981; Kim, Hwang, Park, Miyashita,
et al. (2018); Kim et al., 2010, 2011, 2020; Pisa et al., 2015).
Ducting Pc1 waves can be attenuated by absorption, scattering, and leakage, and the sustainability of PWD
depends on the ionospheric conditions such as conductivity and plasma density, as well as the amplitude
of the originally incident wave. From the observation by 13 induction magnetometers over the Canadian
region, Hayashi et al. (1981) showed that Pc1 waves are attenuated with a rate of 10 dB/100 km (dB = deci-
bel) in the injection center and of 2.5 dB/100 km beyond 500 km from the center. Kim et al. (2010), using an
© 2021. American Geophysical Union. Antarctic magnetometer array, reported that the attenuation rate is between 8 and 20 dB/1,000 km. A fol-
All Rights Reserved. low-up statistical study conducted by Kim et al. (2011) showed that waveguide's cutoff frequency depends
KIM ET AL. 1 of 14
Journal of Geophysical Research: Space Physics 10.1029/2020JA029016
on the ionospheric conductivity, that PWD on the ground is most efficient in the meridional direction, and
that the wave attenuation increases with increasing frequency.
Using Swarm constellation and multiple ground-magnetometer chains, Kim, Hwang, Park, Miyashita,
et al. (2018) reported the large-scale ducting of Pc1 waves both in the ionosphere and on the ground during
a huge geomagnetic storm's recovery phase. They concluded that ionospheric waveguide could transmit
Pc1 waves to a wide latitudinal and longitudinal range and that wave intensity abruptly decreases across
sharp gradients in the ionospheric plasma density. A recent study by Kim et al. (2020) presented the relation
between PWD and ionospheric plasma density inhomogeneities by exploiting the two adjoined Swarm sat-
ellites. They showed the changes of Pc1 wave intensity along the Swarm tracks generally follow the electron
density variation and that the waves are stronger at higher-density regions. They also demonstrated that Pc1
waves are modulated and reflected when they cross plasma density irregularities such as equatorial plasma
bubbles.
The studies mentioned above have shown ducting characteristics of Pc1 waves both on the ground and in
the ionosphere. Still, the statistical characteristics of PWD within the ionosphere have not been reported.
In this paper, we present the first-ever statistical analysis of the PWD within the ionosphere exploiting
Swarm-A and Swarm-B data from 2015 to 2019. The morphology of ducted Pc1 waves is expected to be af-
fected by ionospheric plasma density as well as the wave source regions in the magnetosphere. Hence, we
investigated the spatial distribution of PWD, their dependence on geomagnetic activity (by comparing with
the AE and SYM-H indices), the seasonal variation, and the relationship to plasma density.
2. Data and Analysis Procedure
2.1. Instruments
spheric F layer. Swarm-A and Swarm-C fly side by side at an altitude of ∼450 km, and Swarm-B moves
The Swarm constellation consists of three satellites placed in two different polar orbits within the iono-
alone at a higher altitude of ∼510 km. Swarm is mainly designed to survey the geomagnetic field, and
Vector Field Magnetometer onboard Swarm measures geomagnetic field vectors with a high sampling rate
of 50 Hz, which can detect the electromagnetic waves in a frequency range up to 25 Hz. In order to analyze
dependence on the plasma density, we used 2-Hz electron density data measured by the onboard Langmuir
Probes. In this study, we used Swarm-A and Swarm-B because Swarm-C is very close to Swarm-A. The Alti-
tude Adjusted Corrected Geomagnetic (AACGM) system (Shepherd, 2014) is used for transformation from
geographic to geomagnetic coordinate.
2.2. Data Processing and Wave Detection Algorithm
We used a second-order Savitzky-Golay smoothing filter (Savitzky & Golay, 1964) to define the ambient
magnetic field with a moving window of 15 50 data points (30 s). The fluctuating components can be ob-
tained by subtracting the filtered from the measured magnetic field. We used local field-aligned coordinates
to extract transverse (Bx: toward outer L-shells, By: toward magnetic east) and compressional (Bz: parallel
to the ambient magnetic field) electromagnetic pulsations. A Fast Fourier Transform was performed with
a window size of 2,048 data points (40.96 s), and then we obtained a complex Fourier signal (F(x,y,z)) whose
2
power is log( F x , y , z nT ) with 8,640 data blocks per day with 10-s time resolution.
In order to define PWD, we designed an automatic wave detection algorithm applied to the “compressional”
magnetic pulsations (δBz) as follows: Step 1. We subtracted the daily median values of wave power from
the original wave power for each frequency. Step 2. Since diamagnetic effects caused by plasma irregulari-
ties can generate broadband pulsations of compressional magnetic field affecting the Pc1 frequency range
(Ivarsen et al., 2019; Kim et al., 2020; Laundal et al., 2019; Lühr et al., 2014), we removed all signals at a
specific time when the number of signals whose wave power exceeds 0.7 nT2 at 0–0.46 Hz (20 frequency
bins) is larger than 10. The frequencies at 0–0.46 Hz are inside typical frequency ranges plasma irregular-
ities mainly affect. Step 3. Signals whose powers are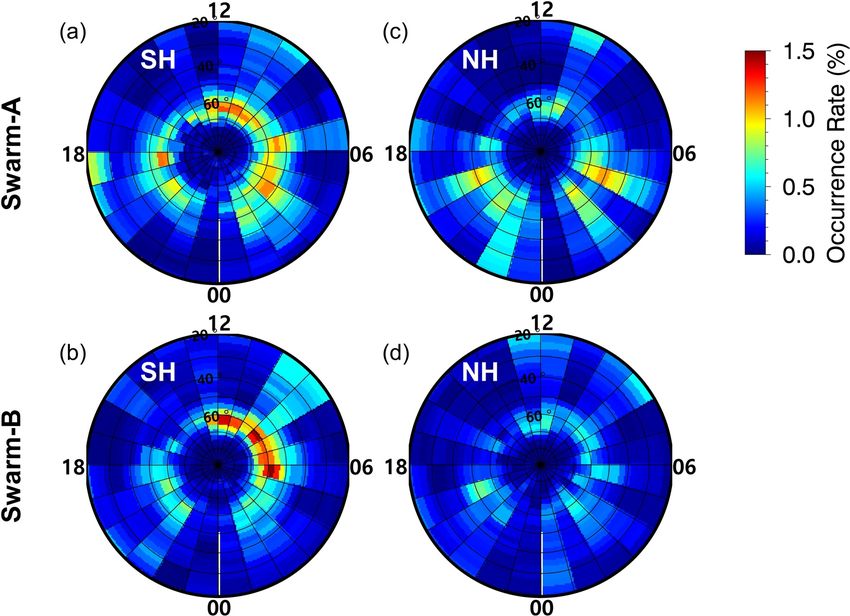
Journal of Geophysical Research: Space Physics                                               10.1029/2020JA029016

                     Figure 1. An example of wave detection process for the event on November 9, 2016 observed by Swarm-A. Dynamic
                     spectrum of (a) original compressional wave, (b) compressional wave after taking Steps 1–2, and (c) compressional
                     wave after taking Step 3. (d) Selected PWD event after taking Step 4 and visual inspection. PWD, Pc1 wave ducting.

                     and 5 Hz were removed. Step 4. A two-dimensional median filter (5 frequency steps × 5-time steps) was ap-
                     plied to eliminate the sharp stand-alone peaks. A compressional Pc1 wave packet, i.e., PWD, can be flagged
                     when the signals satisfy both minimum bandwidth of 0.22 Hz (10 frequency bins) and minimum duration
                     of 1 min. The events, however, for which wave power of a bottom frequency is not weaker than a factor of
                     1.5 of maximum wave power, are excluded because they may represent other types of pulsation or ambient
                     noises (Erlandson & Anderson, 1996). Finally, we selected events through visual inspection by checking the
                     well-structured narrowband spectral shape. Note that we only use the compressional components (δBz) for
                     the event detection, which distinguishes this study from previous ones. By only using the δBz, we can focus
                     on the PWD better than previous studies using either two perpendicular components (Park et al., 2013) or
                     all the three components (Kim, Hwang, Park, Bortnik, et al., 2018). The latter approaches detect both ducted
                     and nonducted (or directly injected) Pc1 waves, and are more vulnerable to magnetic disturbances by strong
                     field-aligned currents at high latitudes.

                     Figure 1 shows an example of the wave detection process for an event on November 9, 2016 observed by
                     Swarm-A. Figure 1a shows the dynamic spectrum of the original compressional wave, and Figures 1b and
                     1c present the spectrogram after taking Steps 1–2 and Step 3, respectively. In Figure 1d, we show a finally
                     selected PWD event after taking Step 4 and visual inspection. This ducting event between 0.4 and 0.9 Hz
                     starts from 07:54 UT and ends near 08:01 UT as marked by red dashed lines.

                     3. Statistical Results
                     Based on our wave detection algorithm, a total of 1,214 (1,128) PWD events are detected from Swarm-A
                     (Swarm-B). In this section, we present the statistical dependence of detected PWDs on the location, geo-
                     magnetic indices, and seasons. Also, the relationship between PWD and ionospheric plasma density will
                     be investigated. Note that we deduce statistical results by assigning each spectral data point to bins of 3°

KIM ET AL.                                                                                                                        3 of 14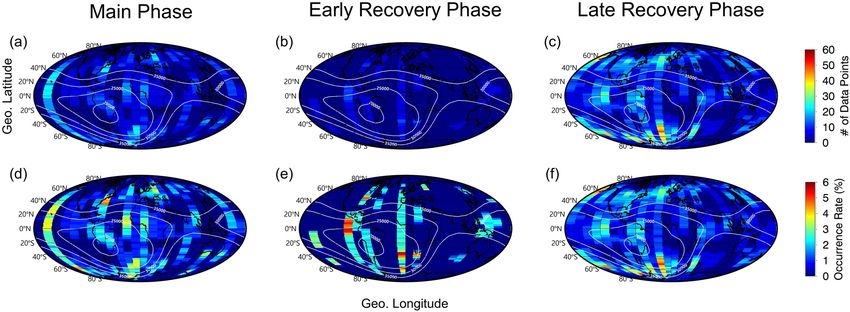
Journal of Geophysical Research: Space Physics 10.1029/2020JA029016
Figure 2. Geographic distribution of PWD observed by Swarm-A and Swarm-B with binning of 3° (latitude) and 15°
(longitude). (a), (c) PWD occurrence rate. White lines indicate contours of averaged magnetic field strength measured
by Swarm satellites. (b), (d) Averaged occurrence rate for five different magnetic latitude ranges (low: -30°-+30°, mid:
±30°-50°, and high: ±50°-80°S) of both hemispheres. The South Alantic Anomaly longitudes (90°W–45°E) are denoted
by red dashed lines. PWD, Pc1 wave ducting.
(latitude) × 15° (longitude). The occurrence rate within each bin is estimated by dividing the number of
data points for PWD events by those for total Swarm passes:
Data points of PWD events
Occurrence rate %
100
Data points of Swarm passes
3.1. Spatial Distribution
Figure 2 shows the geographic distribution of the PWD occurrence rate observed by Swarm-A and Swarm-B.
In the top two panels (Figures 2a and 2c), the colors indicate PWD occurrence rate, and white lines indicate
the contours of averaged magnetic field strength measured by Swarm, indicating the South Atlantic Anom-
aly (SAA). The SAA is delimited from the East Pacific to South Africa with a magnetic field strength below
30,000 nT. Note that, in the present study, longitudes between 90°W and 45°E in the southern hemisphere
are defined as “SAA longitudes,” regardless of latitudes. The bottom panels (Figures 2b and 2d) represent
the averaged occurrence rates for three different magnetic latitude (MLAT) ranges of both hemispheres
(low: -30°-+30°, mid: ±30°-50°, and high: ±50°-80°) as a function of geographic longitude. Both satellite
observations show that PWD can emerge at any ionospheric regions, and the overall occurrence is high at
latitudes above 50° in both hemispheres. The interhemispheric asymmetry at subauroral and auroral lati-
tudes clearly shows that the occurrence rate in the southern hemisphere (SH) is higher than in the northern
hemisphere (NH). Elevated occurrence rates are shown around SAA longitudes at high latitudes as denoted
by red dashed lines in Figures 2b and 2d. Also, considerable occurrence rates are manifest over low-latitude
South America (or near the center of the SAA) for Swarm-A and over Western Africa for both satellites. The
occurrence rate at Swarm-A is slightly higher than that of Swarm-B, but the overall distributions are similar
between the two satellites. The Swarm tracks corresponding to PWD observation are plotted in Figure S1.
Figure 3 shows the occurrence distribution of PWD deduced from Swarm-A and Swarm-B as a function of
magnetic local time (MLT) and MLAT on the SH and NH. We plot MLAT distribution between 20 90
since the AACGM do not provide accurate values below 20 MLAT. PWDs are distributed over the whole
MLTs in both hemispheres except around midnight, where occurrence rates are significantly low. Peak oc-
currences are clearly shown at 05–13 MLTs on SH from Swarm-B (Figure 3b). MLT dependence in the SH
is clearer than in the NH at both satellite altitudes. For the MLAT dependence, the highest occurrence rate
emerges around subauroral/auroral latitudes ( 50 70 MLAT), which corresponds to the putative wave
KIM ET AL. 4 of 14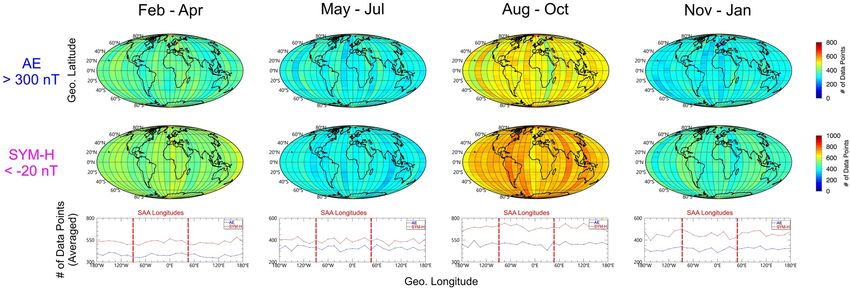
Journal of Geophysical Research: Space Physics 10.1029/2020JA029016
Figure 3. Geomagnetic distribution of PWD as a function of MLT and MLAT observed by (a), (c) Swarm-A in the
SH and NH, respectively and (b), (d) Swarm-B. PWD, Pc1 wave ducting; MLT, magnetic local time; MLAT, magnetic
latitude; SH, southern hemisphere; NH, northern hemisphere.
injection region L-shells (e.g., Wang et al., 2017, Table 1). Polar cap and cusp regions above 70 MLAT show
low occurrence rates.
3.2. Dependence on Geomagnetic Indices
Now we investigate the relation between PWD occurrence and geomagnetic activity. Pc1 wave occurrence
in the ionosphere is not highly dependent on the Kp index (see Section 4.4 in Park et al., 2013 and Section
3.2 in Kim, Hwang, Park, Bortnik, et al., 2018), which is partly attributable to the low temporal resolution
(3 h), logarithmic scales, and/or its representativeness for midlatitude geomagnetic observations (i.e., ob-
servations not directly under auroral or storm currents). Hence, we analyzed the geomagnetic dependence
by comparing PWD activity with 1-min AE and SYM-H indices.
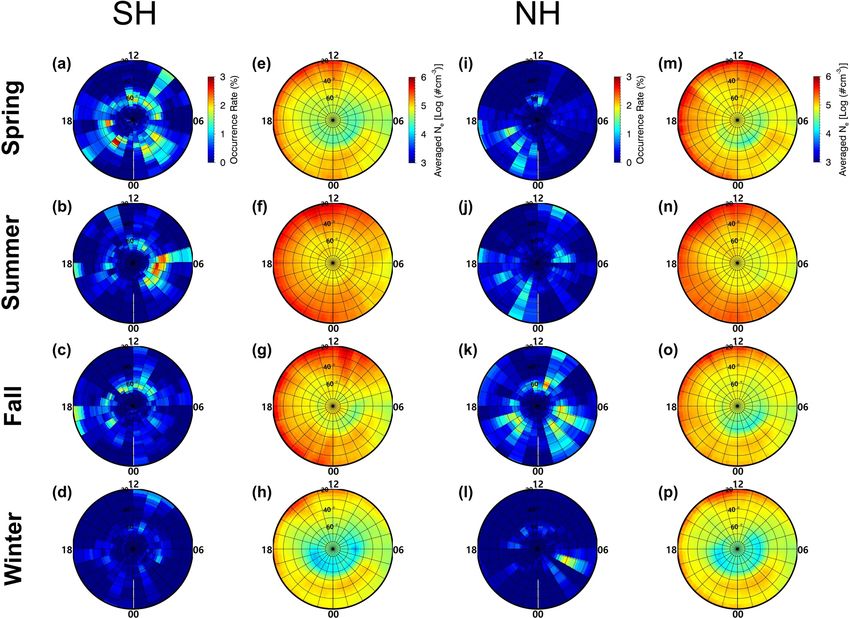
AE index is generally considered as a proxy for substorm activity. Note that we use AE dependence until
February 28, 2018 since the index is unavailable after this time. Figure 4 shows the geographic distribu-
tion of PWD for three different ranges of AE index (AE 100 nT, 100 AE 300 nT, and AE 300 nT)
deduced from Swarm-A. The top three panels indicate the number of data points for PWD events, and the
middle panels present the occurrence rate. The bottomside panels show averaged occurrence rate for three
different MLAT ranges of both hemispheres. The PWD occurrence at both high-latitude and low-latitude
increases with increasing AE index, which implies that the Pc1 wave propagates well to low-latitude regions
during the intense AE period. The occurrence rate deduced from Swarm-B also shows similar distributions,
but slightly lower than that of Swarm-A (see Figure S2).
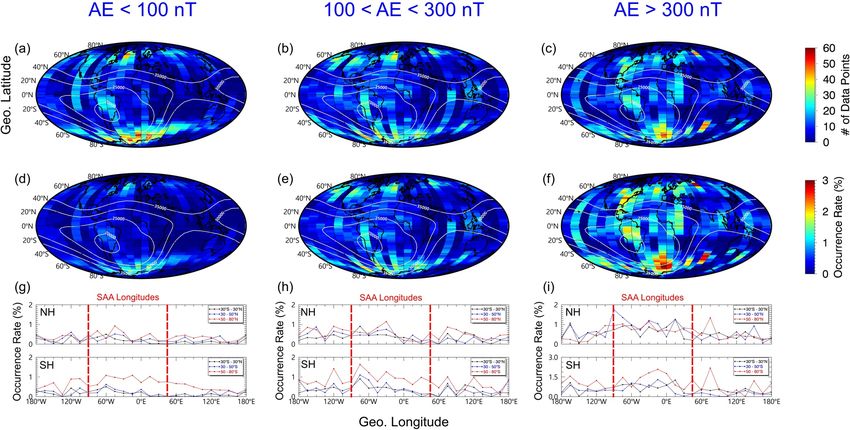
Next, we analyze the PWD occurrence dependence on the SYM-H index, which is often used as a measure
of magnetic storm activity. Figure 5 shows the geographic distribution of PWD for three different ranges of
SYM-H index (SYM-H 10 nT, 20 SYM-H 10 nT, and SYM-H 20 nT) deduced from Swarm-A.
KIM ET AL. 5 of 14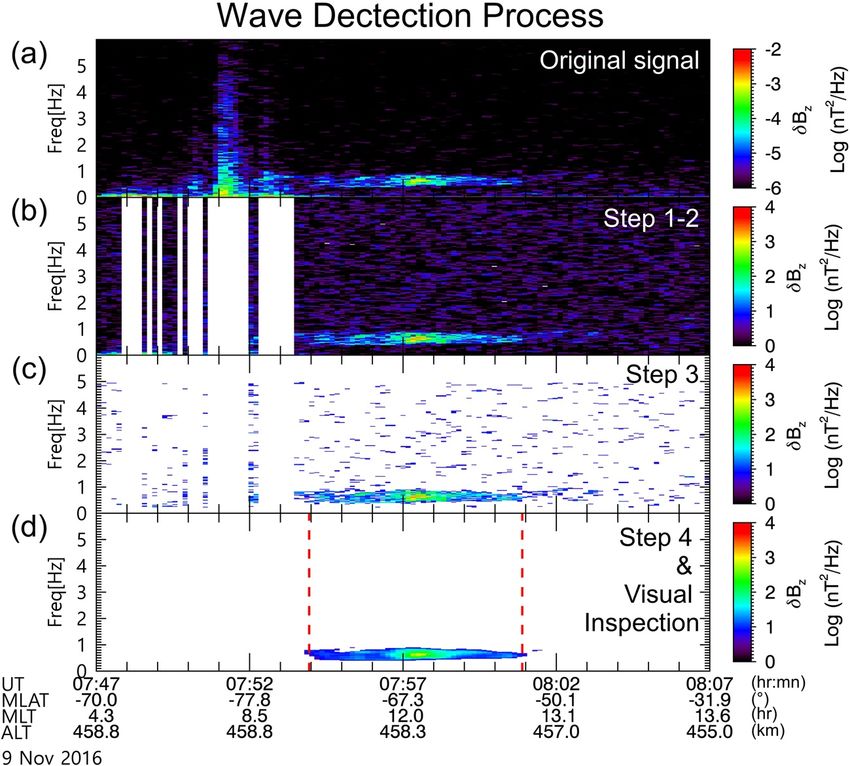
Journal of Geophysical Research: Space Physics                                                     10.1029/2020JA029016

Figure 4. Geographic distribution of PWD occurrence for different ranges of AE index deduced from Swarm-A. (a–c) The number of data points for PWD
events, (d–f) the occurrence rate of PWD, and (g–i) averaged occurrence rate for three different latitude ranges. PWD, Pc1 wave ducting.

                                      Similarly to the AE dependence, it is also shown that the occurrence rate at both high-latitude and low-lat-
                                      itude increases with increasing |SYM-H| index. The occurrence rate deduced from Swarm-B shows similar
                                      distributions, but slightly lower than that of Swarm-A (see Figure S3).

Figure 5. Geographic distribution of PWD occurrence for different ranges of SYM-H index deduced from Swarm-A. (a–c) The number of data points for PWD
events, (d–f) the occurrence rate of PWD, and (g–i) averaged occurrence rate for three different latitude ranges. PWD, Pc1 wave ducting.

KIM ET AL.                                                                                                                                      6 of 14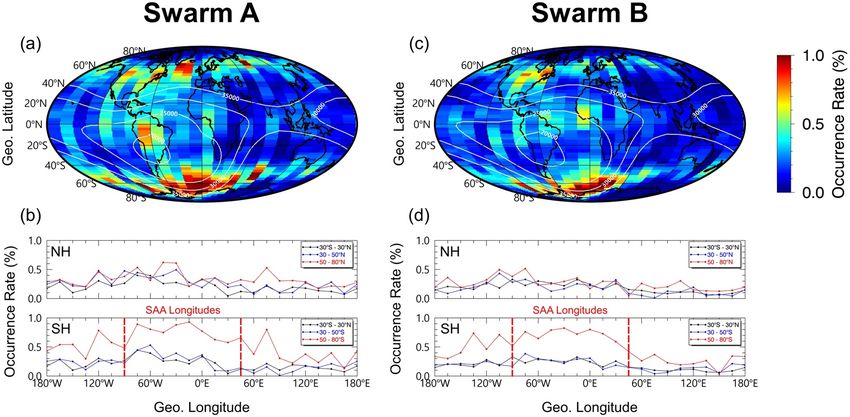
Journal of Geophysical Research: Space Physics 10.1029/2020JA029016
Figure 6. Seasonal distribution of (a–d and i–l) PWD occurrence rate and (e–h and m–p) averaged electron density (Ne) in the SH and NH as a function of
MLT and MLAT observed by Swarm-A. PWD, Pc1 wave ducting. MLT, magnetic local time; MLAT, magnetic latitude; SH, southern hemisphere; NH, northern
hemisphere.
3.3. Seasonal Dependence and Relationship With Plasma Density
In this section, we investigate seasonal variations of the PWD occurrence. Four seasons are defined, with
the months hosting the equinox and solstice days as the center month. The seasons of the SH are classified
as spring (August, September, and October), summer (November, December, and January), fall (Febru-
ary, March, and April), and winter (May, June, and July). The seasons of the NH are classified as spring
(February, March, and April), summer (May, June, and July), fall (August, September, and October), and
winter (November, December, and January). Since PWD is related to the ionospheric plasma density (Kim
et al., 2020), which is controlled by the seasonal variation, we also compared PWD occurrence with electron
density for each season.
Figure 6 shows the distribution of PWD occurrence and averaged electron density (Ne) for each season as a
function of MLT and MLAT in both the SH and NH. The most remarkable feature is the lowest occurrence
rate during the local winter in both hemispheres (Figures 6d and 6l). The Ne is also lowest during winter,
especially around the putative wave injection region above 50 MLAT (Figures 6h and 6p). For the other
seasons, occurrence rates are high during spring and summer in the SH and during fall in the NH, but the
difference among spring, summer, and fall seems mild. The Ne at midlatitude and high-latitude is highest
during the local summer (Figures 6f and 6n), followed by equinox (Figures 6e, 6g, 6m, and 6o). The dis-
tribution of PWD occurrence and Ne deduced from Swarm-B also show the same features (see Figure S4).
KIM ET AL. 7 of 14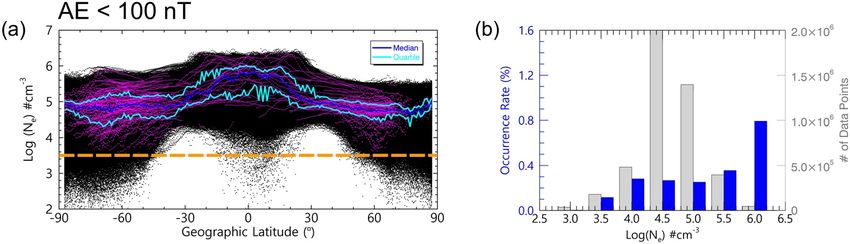
Journal of Geophysical Research: Space Physics                                               10.1029/2020JA029016

                     Figure 7. (a) Scatter plots of Ne deduced from Swarm-A for all Swarm passes. The black dots indicate Ne for each
                     period, and the magenta dots indicate Ne when PWD is observed. Blue and cyan lines indicate the median and quartiles
                     of Ne for magenta dots. (b) Occurrence rate of PWD for each Ne bin. The blue bar indicates occurrence rate, and the
                     gray bar shows the number of data points for PWD events. PWD, Pc1 wave ducting.

                     Next, we plot Ne along Swarm orbits containing PWD events as a function of geographic latitude in Figure 7
                     (see Figure S5 for Swarm-B). We compare them with Ne of all the Swarm passes (i.e., those with and without
                     PWD). In Figure 7a, the black dots indicate plasma density for all Swarm passes, and magenta dots repre-

                     plasma density when Swarm encounters PWD. Pc1 wave seems to be mostly ducted when Ne > ∼ 103.5 cm−3,
                     sent plasma density when PWD is observed. Blue and cyan lines correspond to the median and quartiles of

                     as marked by the dashed orange line. Figure 7b shows the occurrence rate as a function of ionospheric plas-
                     ma density. We estimate it by dividing the number of data points for PWD events in Figure 7a by those for

                     that PWD mostly occurs when Ne > ∼ 103.5 cm−3 and it increases with increasing Ne, which is consistent
                     total Swarm passes at each of the 7 Ne intervals (7 bins in logscale). The occurrence rate (blue bars) shows

                     with the summer-winter asymmetry in Figure 6.

                     4. Discussion
                     4.1. Spatial Distribution
                     4.1.1. Longitude Dependence: Preference for the Regions Around the SAA

                     Our statistical results revealed that the peak occurrence of PWD in geographic coordinates appears around

                     ∼200 km. This configuration leads to flux enhancement of energetic particles in this area, which increas-
                     the SAA longitudes. The SAA is an area where Earth's inner radiation belt dips down to an altitude of

                     es conductivity at the bottomside of the ionosphere. According to Zossi et al. (2018), Hall conductivity is
                     highest around the SAA longitudes. We interpret that the peak occurrence of PWD over the SAA longitudes
                     is partly caused by the high Hall conductivity, which is favorable for mode conversion and ducting of Pc1
                     waves (Fujita & Tamao, 1988; Yoshikawa & Itonaga, 2000).

                     The high occurrence rate near the SAA longitudes in the SH can also be explained by F-region plasma
                     density. In the nightside and morningside, the SH midlatitude F-region ionosphere around the SAA hosts
                     high-density plasma during local summer (see Xiong & Lühr, 2014, Figure 2) and even in equinoxes (Jee
                     et al., 2009, Figure 2). This phenomenon is known as the Weddell Sea Anomaly (WSA). Its location is not
                     exactly at the center of the SAA, but still included in the SAA longitudes. The synergy between the SAA lon-
                     gitudes (weak magnetic field, high conductance, and efficient mode conversion) and the WSA (high-density
                     F-region ducts) may explain the hotspot of “subauroral” PWD there.

                     The effect of the WSA on the subauroral PWD can be further confirmed by their local time dependences.
                     According to Xiong and Lühr (2014, Figure 2), the peak of the WSA moves eastward from nightside to day-
                     side via dawn. Figure S6 shows the PWD occurrence rate in the geographic map for both day (06–18 LT) and
                     night (18-06 LT) times. The subauroral peaks of PWD occurrence move eastward from nightside to dayside,
                     suggesting the connection between the PWD and the WSA.

                     Next, we discuss the “low-latitude” hotspots of PWD occurrence near the SAA longitudes. As seen in Fig-
                     ure S6, the low-latitude PWD events prefer daytime to nighttime. As plasma density in the low-latitude F-re-
                     gion is higher on the dayside than on the nightside (see also Figures 6e–6h and 6m–6p), this result implies
                     that very high F-region density is necessary for Pc1 pulsations to penetrate from subauroral to low-latitude

KIM ET AL.                                                                                                                        8 of 14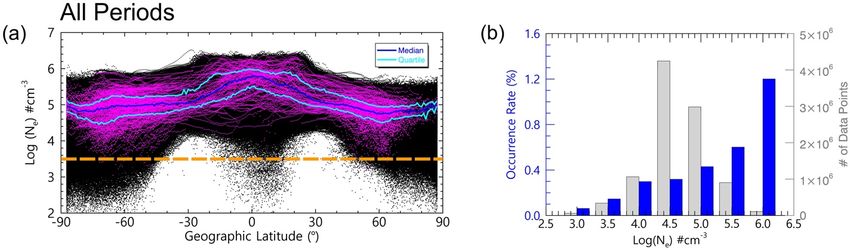
Journal of Geophysical Research: Space Physics 10.1029/2020JA029016
regions. According to Xiong and Lühr (2014, Figure 1) and Jee et al. (2009, Figure 1), the effect of the WSA
(both at night and in the morning) is not confined to subauroral regions, but extends toward the equator via
South America. This may explain the low-latitude hotspots of PWD near South America.
However, we need to explain why the subauroral and low-latitude hotspots of PWD occurrence look in-
terleaved with the midlatitude region of suppressed PWD occurrence (Figures 2a and 2c). If both hotspots
represent Pc1 wave ducting from the subauroral toward the low-latitude ionosphere, they should be con-
nected seamlessly instead of being separated by the midlatitude suppression. This discrepancy may be due
to changes in wave normal angles (WNAs) during ionospheric ducting. For example, the Pc1 pulsations in
which eventually becomes ∼90° at equatorial latitudes. In other words, the Pc1 pulsations were dominated
Kim, Hwang, Park, Miyashita, et al. (2018, Figure 3b) exhibited WNA increases with decreasing latitudes,
by the compressional component at low latitudes, but transverse components became important or even
dominant at midlatitudes. Our event detection method, which is based only on the compressional compo-
nent, may overlook possible WNA changes during equatorward ducting.
The dominance of the compressional component at low latitudes may indicate that some waves are trapped
in the equator due to equatorial ionospheric anomaly (EIA). According to Kim et al. (2020, Figures 2 and 3),
PWD can be reflected and trapped by steep gradients in plasma density. The EIA may cause the enhance-
ment of PWD occurrence at low latitudes.
4.1.2. Altitude Dependence
PWD occurrence rate deduced from Swarm-B is slightly lower than that of Swarm-A (see Figures 2 and 3). It
may be because the Swarm-B altitude is farther from the main ducting layer (i.e., the F-region peak altitude
around 350 km) than Swarm-A. This result implies that our statistics are not dominated by Pc1 waves com-
ing directly from the magnetosphere down to the ionosphere (i.e., primary incident waves), but properly
represent the secondary Pc1 waves that are mode converted below Swarm altitudes.
4.1.3. Local Time Dependence
According to magnetospheric observations close to the equatorial plane (i.e., the wave source region), EMIC
waves are distributed across all MLTs with peak occurrence in dayside (dawn to dusk), and wave occurrence
also depends on the source particle changes (Allen et al., 2016; Jun et al., 2019; Saikin et al., 2015; Usanova
et al., 2012; Wang et al., 2017). Since PWD is more efficient in the meridional direction (Kim et al., 2011),
the MLT distribution of PWD in the ionospheric altitudes should reflect the distribution in the wave source
region. As we can see in Figure 3, our statistical results are consistent with previous studies in that PWD
are distributed across all MLTs, and that clear peak occurrences are seen at dawn, noon, to dusk MLTs from
both satellites (Figures 3a and 3b).
F-region plasma density seems to make an additional contribution to the MLT dependence of PWDs. In
Figure 3, the MLT dependence appears clearer and better organized in the SH than in the NH: e.g., high
occurrence rates in the early morning sector. According to Xiong and Lühr (2014, Figure 2), local time de-
pendence of summer midlatitude ionospheric plasma is generally stronger in the SH than in the NH. Since
PWD is positively affected by ionospheric density (e.g., Kim et al., 2020), PWD occurrence in the SH should
show more conspicuous local time dependence than in the NH, which is actually seen in Figure 3.
4.1.4. Latitude Dependence
The highest occurrence at subauroral/auroral latitudes ( 50 70 MLAT) seems because this region is
close to the putative wave injection L-shells (e.g., Wang et al., 2017, Table 1), and because waves undergo
attenuation and leakage during ionospheric ducting as it propagates away from the injection region (Kim
et al., 2020). WNA changes, as mentioned in a preceding subsection, may further complicate the latitude
dependence of compressional wave signatures in a nonmonotonic manner. Less PWDs in the polar cap
and cusp ( 70 MLAT) may result from nearly ubiquitous ionospheric inhomogeneity there (e.g., Jin
et al., 2020), interrupting poleward propagation of PWD. The high occurrence around the SAA contributes
to the hemispheric asymmetry between the SH and the NH.
At low latitudes below 40 MLAT, clear day-night asymmetry of PWD occurrence cannot be seen in our
results, which is different from previous ground-based observations (e.g., Kawamura et al., 1981; Kuwashi-
KIM ET AL. 9 of 14Journal of Geophysical Research: Space Physics 10.1029/2020JA029016
Figure 8. Geographic distribution of PWD occurrence for three geomagnetic storm phases deduced from Swarm-A. (a–c) The number of data points for PWD
events (d–f) the occurrence rate of PWD. PWD, Pc1 wave ducting.
ma et al., 1981; Kwon et al., 2020). This is because a majority of Pc1 wave observed on the ground is mainly
leaked signals from the ionospheric waveguide, i.e., the observation on the ground is highly affected by
ionosphere-to-ground propagation condition. This may be why the MLT distribution is different between
the ground and ionosphere. It is worth investigating Pc1 wave occurrence on the ground in relation to ion-
osphere-to-ground propagation conditions in future studies.
4.2. Dependence on Geomagnetic Activity
Our study shows the occurrence rate of PWD increases with increasing AE and |SYM-H| indices. According
to Meredith et al. (2014) and Saikin et al. (2015), the spatial distributions of EMIC waves at source (i.e.,
equatorial) regions depend on the level of geomagnetic activity, and the occurrence rate increases with in-
creasing AE index. Those behaviors agree with our results. A statistical study by Kim, Hwang, Park, Bortnik,
et al. (2018) using Swarm satellites showed that 50% of the EMIC waves were found to be directly related
to the geomagnetic storms, and that most of them occur during the late recovery phase (within 2–5 days
following the storm main phase) with minimum occurrence during the early recovery phase.
In order to interpret our results in the same way as Kim, Hwang, Park, Bortnik, et al. (2018), we investigated
the PWD occurrence rate for different phases of geomagnetic storms. We defined geomagnetic storms as
periods with the minimum Dst index falling below –50 nT. A total of 63 storms were detected during the
5 years. We also categorized the storm intervals into the main phase, early recovery phase, and late recovery
phase. The criteria for defining each storm phase are as follows: First, we pick up the minimum Dst value
and then backtrack it until it reaches 0 nT. This interval is defined as the main phase. The endpoint of the
early recovery phase is defined as the time when 50% of the minimum Dst is recovered. Finally, the end-
point of the late recovery phase is defined as the time of Dst, reaching 20% of the minimum.
Figure 8 shows the PWD occurrence distribution corresponding to each storm phase (see Figure S7 for
Swarm-B). Most events are observed during the main and late recovery phase (Figures 8a and 8c), with the
highest occurrence during the late recovery phase (Figure 8f). During the early recovery phase, though bins
of high occurrence rates are observed here and there, the overall occurrence rate is still less than during
other phases (Figure 8e).
One may argue that the azimuthal inhomogeneity, i.e., a high occurrence rate near the SAA longitudes, is
related to the Swarm traveling along specific longitudes during strong geomagnetic activities. However, the
occurrence rate near the SAA longitudes is elevated compared to other longitudes also during quiet time, as
seen in Figures 4d, S2d, and S3d. This implies that the azimuthal inhomogeneity of Pc1 occurrence is not
primarily affected by sampling bias combined with geomagnetic activities.
KIM ET AL. 10 of 14Journal of Geophysical Research: Space Physics 10.1029/2020JA029016
Figure 9. The number of Swarm-A data points for the strong geomagnetic activity (AE >300 nT and SYM-H ∼103.5 cm−3 even during quiet times, and
issue, we repeat Figure 7 in Figure 10, but only for quiet periods (AE < 100 nT) (see Figure S8 for Swarm-B).
the quartiles are similar to those in Figure 7a. The occurrence rate in Figure 10b also shows similar positive
trends to those seen in Figure 7b.
KIM ET AL. 11 of 14Journal of Geophysical Research: Space Physics 10.1029/2020JA029016
Figure 10. (a) Scatter plots of Ne and (b) PWD occurrence rate deduced from Swarm-A during a period of AE < 100 nT
in the same format as that of Figure 7. PWD, Pc1 wave ducting.
The contribution of plasma density to the PWD occurrence rate is also supported by ionospheric plas-
ma density variation during geomagnetic storms. According to Kumar and Parkinson (2017, Figure 4),
ionospheric F-region density above 40 MLAT, where Swarm usually encounters ducting events, gen-
erally decreases after geomagnetic storms, and the decrease is deeper during the early recovery phase
than during the late recovery phase. This strong density decrease during the early recovery phase may
contribute to the lowest occurrence rate of PWD during the early recovery phase of geomagnetic storms
(Figure 8e).
Amplitudes of incident waves naturally play a key role in the wave ducting statistics in this study. That
is, stronger incident waves have more chances to be detected by Swarm, even after long-distance ducting
with significant attenuation. In addition to this effect, Figure 10 also suggests that a dense ionosphere
also generates favorable conditions for Pc1 wave ducting. In short, the ducting statistics in this study seem
to reflect the convolution of wave injection intensity (i.e., magnetospheric effects represented by geomag-
netic indices) with ducting efficiency (i.e., ionospheric effects characterized by background density lev-
els). However, further quantitative studies comparing the EMIC wave generation in the magnetosphere
with PWD in the ionosphere are warranted, especially those based on the coordinated observations from
multiple locations.
5. Summary
Based on the Swarm satellite data during 5 years, we analyzed spatial distributions of PWD and their de-
pendence on the geomagnetic activity, seasons, and ionospheric plasma density. The main results obtained
in this study are summarized as follows:
1. P
WD has a hot spot over the South Atlantic Anomaly longitudes, possibly due to high Hall conductivity
and F-region density there
2. T he occurrence rate of PWD is highest around subauroral/auroral latitudes (50 70 MLAT), which
are generally known to be wave injection regions, and those in the southern hemisphere are higher than
in the northern hemisphere
3. PWD exhibits high occurrence rates during equinoxes and local summer, while local winter hosts only a
low occurrence rate. The asymmetry between the summer and winter can be attributed to the ionospher-
ic plasma density, and the high occurrence rate during equinoxes may result from strong geomagnetic
activity in those seasons
4. The occurrence rate of PWD increases with increasing values of both AE and |SYM-H| indices
5. Both high ionospheric plasma density and high geomagnetic activity contribute to the occurrence of
PWD. The former and the latter may be interpreted as ducting efficiency and incident wave activity,
6. PWD mostly occurs when Ne > ∼103.5 cm−3, and mode conversion and ducting occur more efficiently as
respectively
Ne increases
KIM ET AL. 12 of 14Journal of Geophysical Research: Space Physics 10.1029/2020JA029016
Data Availability Statement
The Swarm vector magnetic field and electron density data were obtained online from (http://swarm-diss.
eo.esa.int). The AE and SYM-H indices data were downloaded online from OMNI web database (https://
omniweb.gsfc.nasa.gov).
Acknowledgments References
The authors thank the ESA and Swarm
team for providing the data to the Allen, R. C., Zhang, J.-C., Kistler, L. M., Spence, H. E., Lin, R.-L., Klecker, B., et al. (2016). A statistical study of EMIC waves ob-
public. This work was supported by the served by cluster: 2. Associated plasma conditions. Journal of Geophysical Research: Space Physics, 121, 6458–6479. https://doi.
JSPS KAKENHI (15H05815, 15H05747, org/10.1002/2016JA022541
16H06286, 17H00728, and 20H01959). Anderson, B. J., Denton, R. E., Ho, G., Hamilton, D. C., Fuselier, S. A., & Strangeway, R. J. (1996). Observational test of local proton cyclotron
instability in the Earth's magnetosphere. Journal of Geophysical Research, 101(A10), 21527–21543. https://doi.org/10.1029/96JA01251
Cornwall, J. M. (1965). Cyclotron instabilities and electromagnetic emission in the ultralow frequency and very low frequency ranges.
Journal of Geophysical Research, 70(1), 61–69. https://doi.org/10.1029/JZ070i001p00061
Erlandson, R. E., & Anderson, B. J. (1996). Pc 1 waves in the ionosphere: A statistical study. Journal of Geophysical Research, 101(A4),
7843–7857. https://doi.org/10.1029/96JA00082
Fedorov, E. N., Pilipenko, V. A., Engebretson, M. J., & Hartinger, M. D. (2018). Transmission of a magnetospheric Pc1 wave beam through
the ionosphere to the ground. Journal of Geophysical Research: Space Physics, 123, 3965–3982. https://doi.org/10.1029/2018JA025338
Fraser, B. J. (1975a). Polarization of Pc 1 pulsations at high and middle latitudes. Journal of Geophysical Research, 80(19), 2797–2807.
https://doi.org/10.1029/ja080i019p02797
Fraser, B. J. (1975b). Ionospheric duct propagation and Pc 1 pulsation sources. Journal of Geophysical Research, 80(19), 2790–2796. https://
doi.org/10.1029/ja080i019p02790
Fujita, S., & Tamao, T. (1988). Duct propagation of hydromagnetic waves in the upper ionosphere. 1. Electromagnetic field distributions
in high latitudes associated with localized incidence of a shear Alfvén wave. Journal of Geophysical Research, 93(A12), 14665–14673.
https://doi.org/10.1029/JA093iA12p14665
Hayashi, K., Kokubun, S., Oguti, T., Tsuruda, K., Machida, S., Kitamura, T., et al. (1981). The extent of Pc 1 source region in high latitudes.
Canadian Journal of Physics, 59, 1097–1105.
Hong, J., Kim, Y. H., & Lee, Y.-S. (2019). Characteristics of the ionospheric mid-latitude trough measured by topside sounders in 1960-70s.
Journal of Astronomy and Space Sciences, 36(3), 121–131. https://doi.org/10.5140/JASS.2019.36.3.121
Ivarsen, M. F., Jin, Y., Spicher, A., & Clausen, L. B. N. (2019). Direct evidence for the dissipation of small-scale ionospheric plasma struc-
tures by a conductive E region. Journal of Geophysical Research: Space Physics, 124, 2935–2942. https://doi.org/10.1029/2019JA026500
Jee, G., Burns, A. G., Kim, Y. -H., & Wang, W. (2009). Seasonal and solar activity variations of the Weddell Sea Anomaly observed in the
TOPEX total electron content measurements. Journal of Geophysical Research, 114, A04307. https://doi.org/10.1029/2008JA013801
Jin, Y., Xiong, C., Clausen, L., Spicher, A., Kotova, D., Brask, S., et al. (2020). Ionospheric plasma irregularities based on in situ measurements
from the Swarm satellites. Journal of Geophysical Research: Space Physics, 124, e2020JA028103. https://doi.org/10.1029/2020JA028103
Jun, C. W., Yue, C., Bortnik, J., Lyons, L. R., Nishimura, Y., Kletzing, C., et al. (2019). A statistical study of EMIC waves associated with
and without energetic particle injection from the magnetotail. Journal of Geophysical Research: Space Physics, 124, 433–450. https://doi.
org/10.1029/2018JA025886
Kawamura, M., Kuwashima, M., & Toya, T. (1981). Comparative study of magnetic Pc1 pulsations between low latitudes and high lati-
tudes: Source region and propagation mechanism of the waves deduced from the characteristics of the pulsations at middle and low
latitudes. Memoirs of National Institute of Polar Research, 18, 83–100.
Kennel, C. F., & Petschek, H. E. (1966). Limit on stably trapped particle fluxes. Journal of Geophysical Research, 71(1), 1–28. https://doi.
org/10.1029/JZ071i001p00001
Kim, H., Hwang, J., Park, J., Bortnik, J., & Lee, J. (2018). Global characteristics of electromagnetic ion cyclotron waves deduced from
Swarm satellites. Journal of Geophysical Research: Space Physics, 123, 1325–1336. https://doi.org/10.1002/2017JA024888
Kim, H., Hwang, J., Park, J., Miyashita, Y., Shiokawa, K., Mann, I. R., et al. (2018). Large-scale ducting of Pc1 pulsations observed by Swarm
satellites and multiple ground networks. Geophysical Research Letters, 45, 12703–12712. https://doi.org/10.1029/2018GL080693
Kim, H., Lessard, M. R., Engebretson, M. J., & Lühr, H. (2010). Ducting characteristics of Pc 1 waves at high latitudes on the ground and in
space. Journal of Geophysical Research, 115, A09310. https://doi.org/10.1029/2010JA015323
Kim, H., Lessard, M. R., Engebretson, M. J., & Young, M. A. (2011). Statistical study of Pc1–2 wave propagation characteristics in the
high-latitude ionospheric waveguide. Journal of Geophysical Research, 116, A07227. https://doi.org/10.1029/2010JA016355
Kim, H., Shiokawa, K., Park, J., Miyoshi, Y., Hwang, J., & Kadokura, A. (2020). Modulation of Pc1 wave ducting by equatorial plasma
bubble. Geophysical Research Letters, 47, e2020GL088054. https://doi.org/10.1029/2020GL088054
Kumar, V. V., & Parkinson, M. L. (2017). A global scale picture of ionospheric peak electron density changes during geomagnetic storms.
Space Weather, 15, 637–652. https://doi.org/10.1002/2016SW001573
Kuwashima, M., Toya, T., Kawamura, M., Hirasawa, T., Fukunishi, H., & Ayukawa, M. (1981). Comparative study of magnetic Pc1 pul-
sations between low latitudes and high latitudes: Statistical study. Memoirs of National Institute of Polar Research-Special Issue, 18,
101–117.
Kwon, J. W., Kim, K. H., Jin, H., Kwon, H. J., Jee, G., Shiokawa, K., & Connors, M. (2020). Statistical study of EMIC Pc1-Pc2 waves observed
at subauroral latitudes. Journal of Atmospheric and Solar-Terrestrial Physics, 205, 105292. https://doi.org/10.1016/j.jastp.2020.105292
Laundal, K. M., Hatch, S. M., & Moretto, T. (2019). Magnetic effects of plasma pressure gradients in the upper F region. Geophysical Re-
search Letters, 46, 2355–2363. https://doi.org/10.1029/2019GL081980
Lühr, H., Park, J., Xiong, C., & Rauberg, J. (2014). Alfvén wave characteristics of equatorial plasma irregularities in the ionosphere derived
from CHAMP observations. Frontiers in Physics, 2, 47. https://doi.org/10.3389/fphy.2014.00047
Meredith, N. P., Horne, R. B., Kersten, T., Fraser, B. J., & Grew, R. S. (2014). Global morphology and spectral properties of EMIC waves de-
rived from CRRES observations. Journal of Geophysical Research: Space Physics, 119, 5328–5342. https://doi.org/10.1002/2014JA020064
Miyoshi, Y., Matsuda, S., Kurita, S., Nomura, K., Keika, K., Shoji, M., et al. (2019). EMIC waves converted from equatorial noise due
to M/Q=2 ions in the plasmapshere: Observations from Van Allen Probes and Arase. Geophysical Research Letters, 46, 5662–5669.
https://doi.org/10.1029/2019GL083024
KIM ET AL. 13 of 14Journal of Geophysical Research: Space Physics 10.1029/2020JA029016
Park, J., Lühr, H., & Rauberg, J. (2013). Global characteristics of Pc1 magnetic pulsations during solar cycle 23 deduced from CHAMP data.
Annales Geophysicae, 31(9), 1507–1520. https://doi.org/10.5194/angeo-31-1507-2013
Pisa, D., Parrot, M., Santolík, O., & Menietti, J. D. (2015). EMIC waves observed by the low-altitude satellite DEMETER during the No-
vember 2004 magnetic storm. Journal of Geophysical Research: Space Physics, 120, 5455–5464. https://doi.org/10.1002/2014JA020233
Russell, C. T., & McPherron, R. L. (1976). Semiannual variation of geomagnetic activity. Journal of Geophysical Research, 78(1), 92–108.
https://doi.org/10.1029/JA078i001p00092
Saikin, A. A., Zhang, J.-C., Allen, R. C., Smith, C. W., Kistler, L. M., Spence, H. E., et al. (2015). The occurrence and wave properties of H-,
He-, and O-band EMIC waves observed by the Van Allen Probes. Journal of Geophysical Research: Space Physics, 120, 7477–7492. https://
doi.org/10.1002/2015JA021358
Sakaguchi, K., Kasahara, Y., Shoji, M., Omura, Y., Miyoshi, Y., Nagatsuma, T., et al. (2013). Akebono observations of EMIC waves in the slot
region of the radiation belts. Geophysical Research Letters, 40, 5587–5591. https://doi.org/10.1002/2013GL058258
Savitzky, A., & Golay, M. J. E. (1964). Smoothing and differentiation of data by simplified least squares procedures. Analytical Chemistry,
36(8), 1627–1639. https://doi.org/10.1021/ac60214a047
Shepherd, S. G. (2014). Altitude-adjusted corrected geomagnetic coordinates: Definition and functional approximations. Journal of Geo-
physical Research: Space Physics, 119, 7501–7521. https://doi.org/10.1002/2014JA020264
Shoji, M., Miyoshi, Y., Katoh, Y., Keika, K., Angelopoulos, V., Kasahara, S., et al. (2017). Ion hole formation and nonlinear gener-
ation of electromagnetic ion cyclotron waves: THEMIS observations. Geophysical Research Letters, 44, 8730–8738. https://doi.
org/10.1023/2017GL074254
Usanova, M. E., Mann, I. R., Bortnik, J., Shao, L., & Angelopoulos, V. (2012). THEMIS observations of electromagnetic ion cyclotron wave
occurrence: Dependence on AE, SYMH, and solar wind dynamic pressure. Journal of Geophysical Research, 117, A10218. https://doi.
org/10.1029/2012JA018049
Wang, X. Y., Huang, S. Y., Allen, R. C., Fu, H. S., Deng, X. H., Zhou, M., et al. (2017). The occurrence and wave properties of EMIC waves
observed by the Magnetospheric Multiscale (MMS) mission. Journal of Geophysical Research: Space Physics, 122, 8228–8240. https://
doi.org/10.1002/2017JA024237
Xiong, C., & Lühr, H. (2014). The midlatitude summer night anomaly as observed by CHAMP and GRACE: Interpreted as tidal features.
Journal of Geophysical Research: Space Physics, 119, 4905–4915. https://doi.org/10.1002/2014JA019959
Yoshikawa, A., & Itonaga, M. (2000). The nature of reflection and mode conversion of MHD waves in the inductive ionosphere: Multistep
ode conversion between divergent and rotational electric fields. Journal of Geophysical Research, 105(A5), 10565–10584. https://doi.
org/10.1029/1999JA000159
Zossi, B. S., Elias, A. G., & Fagre, M. (2018). Ionospheric conductance spatial distribution during geomagnetic field reversals. Journal of
Geophysical Research: Space Physics, 123, 2379–2397. https://doi.org/10.1002/2017JA024925
KIM ET AL. 14 of 14You can also read