Kirklees Local Plan and CIL Viability Addendum
←
→
Page content transcription
If your browser does not render page correctly, please read the page content below
Private & Confidential
                                        www.cushmanwakefield.com

Kirklees Local Plan and CIL Viability
Addendum
KIRKLEES COUNCIL

September 2016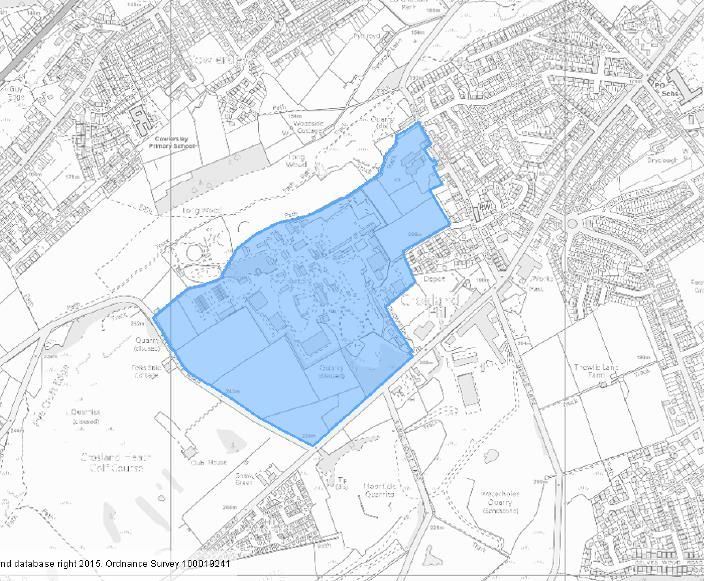
Contents
1.0          Introduction                                                                                                              2
2.0          Review of Value Areas and Sales Evidence                                                                                  2
3.0          Remodelling of Area Wide Appraisals                                                                                       5
4.0          Remodelling of Strategic Allocations                                                                                      7
5.0          Student Residential Development                                                                                          10
6.0          Conclusions                                                                                                              14

Appendix 1: Response to Representations
Appendix 2: Updated market research
Appendix 3: Updated site specific appraisals and proforma
Appendix 4: Student residential worked appraisal

Disclaimer

In light of the recent Referendum concerning the UK’s membership of the EU, we are now in a period of uncertainty in relation to many
factors that impact the property investment and letting markets. At this time organisations involved in the industry are reflecting on the
potential implications of the UK leaving the EU. Since the Referendum date it has not been possible to gauge the effect of the impact on
rental and capital values, along with other elements affecting property appraisal. Cushman & Wakefield continues to closely monitor
market developments and trends in order that we can provide clients with the most up to date advice. The views contained in this document
are provided in the context of this market uncertainty and as such our estimates and opinions are susceptible to change. Development
appraisal results are particularly sensitive to changes in key variables such as cost and values. Accordingly we advise that clients have
regard to this risk and may need to commission further advice before acting on the opinions expressed
1.0 Introduction
1.1 This report represents an Addendum to the Kirklees Local Plan and Community Infrastructure Levy
Viability Study, produced by Cushman and Wakefield on behalf of Kirklees Council, in October 2015.
1.2 It considers the representations that have been made to the Local Plan and Community Infrastructure
Levy Consultation. It specifically deals with those comments that relate to economic viability. It also
provides further analysis and iteration of the viability evidence base as regards the viability of the
proposed planning standards and CIL charges in the Local Plan and Draft Charging Schedule
respectively.
1.3 Appendix 1 provides a record of the representations relating to viability and our responses. The
remaining sections of this report address the key areas of change which are:
Review of value areas and sales evidence
Remodelling of the area wide appraisals
Further testing of strategic development sites based on additional information available since our
previous report
Testing of student accommodation development
Recommendations for changes to Local Plan policy standards and CIL charging rates.
2.0 Review of Value Areas and Sales Evidence
Representations
2.1 Representations have been made which challenge the value areas underpinning the Charging Zones
and the new build evidence supporting those value areas. The points that have been made are, in
summary:
Further justification is required of the value areas
Value areas 1 and 2 (highest value and second highest value) should be merged to reflect the
new build evidence
Consideration should be given to increasing the number of value areas
2.2 As a result of these comments further evidence has been gathered as regards average house prices
and new build sales values which have been analysed geographically.
Updated average house prices and sales revenues
2.3 The use of average house prices (i.e. blended and new build housing prices) is the only
comprehensive and consistent means of documenting residential property values on an area-wide
basis. However, whilst it is useful in informing geographical areas, it is the new build sales evidence
which we have used to inform the value assumptions in the viability assessment which we have over-
layered across the average house price data. The reason for this is that average house prices do not
provide an accurate indication of new build values which generally attain a significant premium over
average prices. Therefore, our approach to defining value areas has involved:
Identify geographical differences in market strength using average house price data at postal
district level (Land Registry data based on all house transactions new and second hand)
Research new build evidence to determine actual sales prices being achieved (through research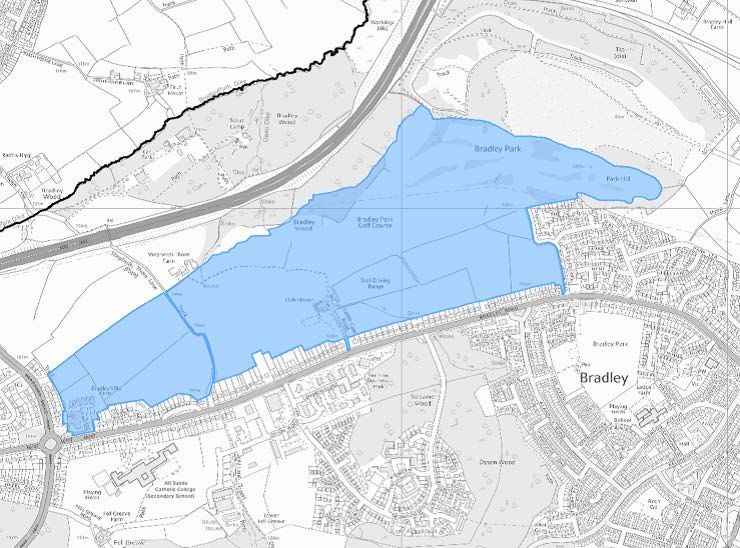
of websites such as Nethouseprice, Zoopla and consultation with housebuilder sales agents)
Devise value areas based on value bands that correspond closely with differences in new build
evidence
Calculate averages of new build evidence in each value area to determine sales revenue
assumption to be applied in the viability model.
2.4 Taking into consideration the representations that have been made, the following changes to average
house price bands have been made which allow a better alignment with geographical differences in
new build evidence that have been observed:
Table 2.1: Average House Price Bands
Value area October 2015 study Revised
1 £200,000-£260,000
£190,000 -£294,000
2 £175,000-£200,000
3 £125,000-£175,000 £165,000-£190,000
4 £100,000-£125,000 £140,000-£165,000
5 £75,000-£100,000 £65,000-£140,000
2.5 The five value areas that were presented in the viability study have been replaced with four value
areas, with the two highest value areas effectively being merged into one single band. The map
presented by Figure 2.1 below presents these average house price bands by postal area (shaded in
blue) together with new build sales values (numbered 1 to 16).
Figure 2.1: Average house prices and average new build values
2.6 Reviewing the map, we considered there to be three anomalies based on stark inconsistencies
between new build values achieved and average house prices. These were: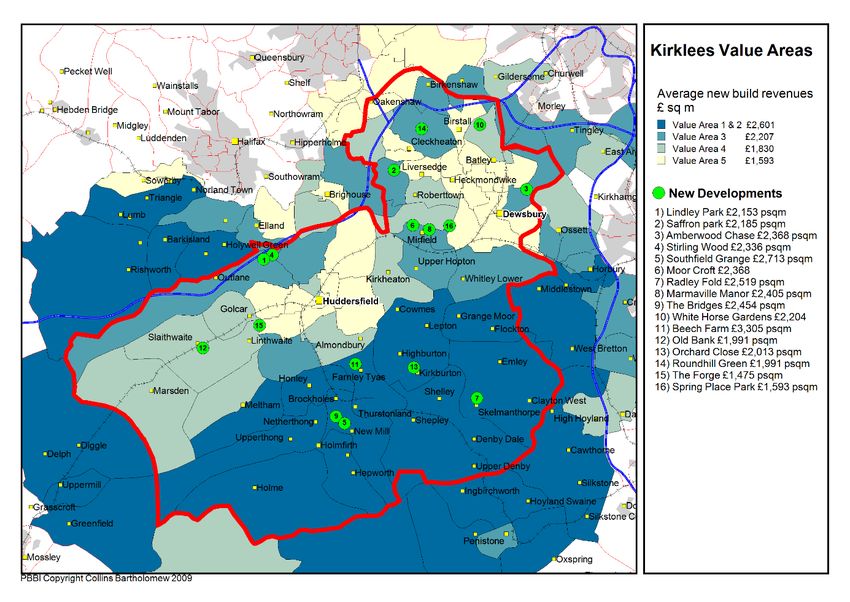
Liversedge, which experiences a relatively high average house price overall but which is not
supported by local new build evidence;
Farnley Tyas, where average house prices are skewed downwards by the area to the north
of Almondbury, concealing a much higher new build revenue potential as demonstrated by
the Beech Farm development which has achieved over £3300 per m; and
To the North East of Dewsbury, where despite a relatively modest average house price
overall, new build evidence provided by the recent Amberwood Chase development indicates
strong new build sales potential with recent revenues achieving well over £2,000 per sq m
Adjustments have therefore been made to address these anomalies with Liversedge moving from
Value Area 1 / 2 to Value Area 3, the Farnley Tyas moving from Value Area 4 to Value Area 1 / 2 and
the area to the north east of Dewsbury moving from Value Area 4 to Value Area 3. The resultant
value areas are presented below together with average new build revenues (i.e. the average of the
revenues achieved of all new build schemes within each area):
Figure 2.2: Adjusted Value Areas
Revised new build revenue assumptions
2.7 Taking into account the revised value areas and value bands the new build revenues have been
averaged and moderated to the following levels: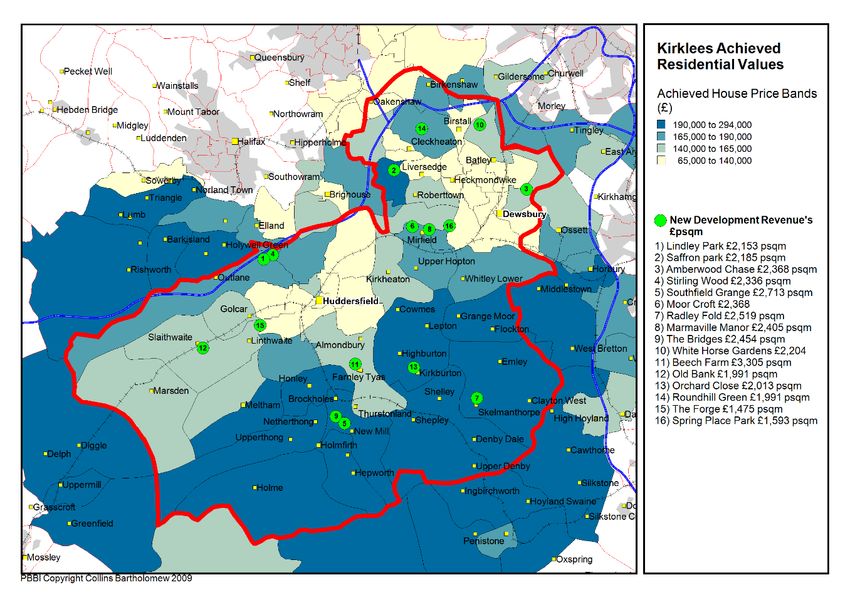
Table 2.2: Sales Revenue Assumptions

                   Average house price      Average new build
                   band (based on Land      revenue (from research     Sales revenue
       Value       Registry - all house     of recent new build        assumption applied to
       area        prices)                  housing schemes)           appraisal
       1 and 2      £190,000 - £294,000        £2604 psm (£242 psf)       £2476 psm (£230 psf)
       3              £165,000-£190,000        £2207 psm (£205 psf)       £2153 psm (£200 psf)
       4              £140,000-£165,000        £1830 psm (£170 psf)       £1884 psm (£175 psf)
       5                 £65,000-£140,000      £1593 psm (£148 psf)       £1614 psm (£150 psf)

3.0 Remodelling of Area Wide Appraisals
      Residential modelling
3.1   The appraisals have been remodelled based on the revised value areas and revenues. The land
      value benchmark for the new Value Area 1 has been adjusted to reflect the reduced revenue
      assumption (this represents an average of the land value benchmarks of Value Areas 1 and 2 in the
      previous viability evidence document). The purchaser costs have also been adjusted to account of
      changes to stamp duty brought into effect by the March 2016 budget.

3.2   The changes to the viability modelling are summarised below, with all other assumptions being
      consistent with the viability report of October 2015:

      Table 3.1: Changes to Viability Assumptions

       New build revenues                          Value Area 1 and 2 £2476 per sq m (£230 psf)
                                                   Value Area 3 £2153 per sq m (£200 psf)
                                                   Value Area 4 £1884 per sq m (£175 psf)
                                                   Value Area 5 £1615 per sq m (£150 psf)
       Land value benchmarks
                                                                         Land value
                                                                        benchmarks
                                                                         inclusive of
                                                                          abnormals       Blended land
                                                                          (Per ha) in         value for
                                                                      Viability Study    revised Value
                                                                      October 2015      Area 1 (per ha)
                                                    Value Area 1         £1,359,050
                                                                                         £1,266,388
                                                    Value Area 2         £1,173,725
       Purchaser costs                             Increased from 5.8% to 6.8% to reflect increases in
                                                   stamp duty introduced by March 2016 budget (the
                                                   percentage also allows for agents and legal fees
                                                   inclusive of VAT). The actual level of stamp duty will
                                                   vary according to the value of the transaction
                                                   however 6.8% of the land value represents the
                                                   highest possible overall purchaser costs and as such
                                                   is a conservative assumption.

3.3   The appraisals have been assessed on the basis of an affordable housing requirement of 20% in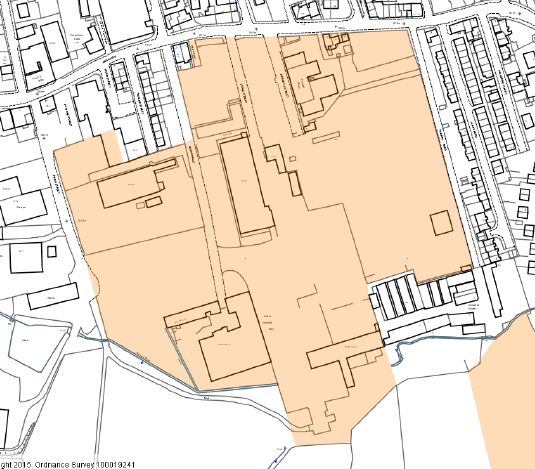
accordance with the emerging Local Plan policy and the mix and transfer values consistent with the
         earlier report.

3.4      Table 3.1 below sets out the results in respect of the CIL headroom figures expressed in £ per sq m
         for each of the site typologies. An overall average for each revised value area is provided.
         Table 3.2: Remodelled results

                      Residential Area Wide Viability Analysis 20% Affordable Housing (except Schemes 0 and 1)

                                                                                           Headroom for
                                           Benchmark Land                                  CIL (residual
                                              Value per        Actual                       Land Value                   Average
                                             hectare with    Benchmark     Residual Land minus actual      Headroom     maximum
                              Market floor    abnormal      Land Value(£)    Value of       benchmark (overage) for available for
Value   Scheme     Site Size   coverage allowance (£ per applied to site      scheme        Land Value)       CIL           CIL
Area    reference (hectares)    (sq m)           ha)            size             (£)             (£)      (£ per sq m) (£ per sq m)
            0            0.14          529       £1,266,387    £177,294.18        £341,827       £164,533          £311
                                                                                                                           £311
            1            0.25          945       £1,266,387       £316,597        £610,405       £293,808          £311
  1         2            0.70        2,164       £1,266,387       £886,471      £1,273,852       £387,381          £179
            3            1.50        4,516       £1,266,387     £1,899,581      £2,527,508       £627,928          £139
  a
            4           2.50        7,597       £1,266,387      £3,165,968      £4,203,950     £1,037,982        £137
  n
  d         5           3.50       10,588       £1,266,387      £4,432,355      £5,725,798     £1,293,443        £122
                                                                                                                          £127
            6           4.50       13,564       £1,266,387      £5,698,742      £7,139,878     £1,441,137        £106
  2         7           6.50       19,683       £1,266,387      £8,231,516     £10,512,333     £2,280,818        £116
            8           8.00       24,257       £1,266,387     £10,131,096     £12,859,229     £2,728,133        £112
            9          10.00       30,244       £1,266,387     £12,663,870     £15,723,204     £3,059,334        £101
            0           0.14          529         £988,400        £138,376        £235,740        £97,364        £184
                                                                                                                          £183
            1           0.25          945         £988,400        £247,100        £419,431       £172,331        £182
            2           0.70        2,164         £988,400        £691,880        £846,407       £154,527         £71
            3           1.50        4,516         £988,400      £1,482,600      £1,654,850       £172,250         £38
            4           2.50        7,597         £988,400      £2,471,000      £2,777,450       £306,450         £40
  3
            5           3.50       10,588         £988,400      £3,459,400      £3,805,083       £345,683         £33
                                                                                                                           £34
            6           4.50       13,564         £988,400      £4,447,800      £4,722,310       £274,510         £20
            7           6.50       19,683         £988,400      £6,424,600      £6,963,530       £538,930         £27
            8           8.00       24,257         £988,400      £7,907,200      £8,500,577       £593,377         £24
            9          10.00       30,244         £988,400      £9,884,000     £10,391,369       £507,369         £17
            0           0.14          529         £803,075        £112,431        £147,329         £34,899         £66
                                                                                                                           £66
            1           0.25          945         £803,075        £200,769        £263,088         £62,319         £66
            2           0.70        2,164         £803,075        £562,153        £587,934         £25,781         £12
            3           1.50        4,516         £803,075      £1,204,613      £1,033,896       -£170,717        -£38
            4           2.50        7,597         £803,075      £2,007,688      £1,405,063       -£602,624        -£79
  4
            5           3.50       10,588         £803,075      £2,810,763      £1,745,962     -£1,064,800       -£101
                                                                                                                           -£95
            6           4.50       13,564         £803,075      £3,613,838      £2,565,049     -£1,048,789        -£77
            7           6.50       19,683         £803,075      £5,219,988      £3,128,027     -£2,091,961       -£106
            8           8.00       24,257         £803,075      £6,424,600      £3,846,851     -£2,577,749       -£106
            9          10.00       30,244         £803,075      £8,030,750        £120,614     -£7,910,136       -£262
            0           0.14          529         £617,750         £86,485         £69,257        -£17,228        -£33
                                                                                                                           -£33
            1           0.25          945         £617,750        £154,438        £123,673        -£30,764        -£33
            2           0.70        2,164         £617,750        £432,425        £133,828       -£298,597       -£138
            3           1.50        4,516         £617,750        £926,625        £199,132       -£727,493       -£161
            4           2.50        7,597         £617,750      £1,544,375        £393,124     -£1,151,251       -£152
  5
            5           3.50       10,588         £617,750      £2,162,125        £532,378     -£1,629,747       -£154
                                                                                                                          -£154
            6           4.50       13,564         £617,750      £2,779,875        £647,512     -£2,132,363       -£157
            7           6.50       19,683         £617,750      £4,015,375        £948,701     -£3,066,674       -£156
            8           8.00       24,257         £617,750      £4,942,000      £1,156,088     -£3,785,912       -£156
            9          10.00       30,244         £617,750      £6,177,500      £1,415,389     -£4,762,111       -£157

3.5      Table 3.3 below summarises the average maximum headroom figures for sites over and under 10
         units respectively, in comparison to the original viability study. The results of the merged value areas
         1 and 2 are reduced and reflect broadly a mid-point between the previous value areas. The headroom
         in Value Area 3 has been reduced marginally which reflects the higher purchaser costs that are applied
in the revised modelling.
Table 3.3: Comparison of CIL headroom between October 2015 report and revised
assessments
Preliminary Draft
Maximum CIL Headroom (October Charging Schedule
2015) Rates Maximum CIL Headroom (May 2016)
£ per sq m £ per sq m £ per sq m
Sites of 10 units
plus Sites of 10 units plus
Value Area 1 163 80
Value Area 1 and 2 127
Value Area 2 101 60
Value Area 3 38 20 Value Area 3 34
Value Area 4 0 5 Value Area 4 0
Value Area 5 0 5 Value Area 5 0
Sites of less than Sites of less than 10
10 units units
Value Area 1 360 100
Value Area 1 and 2 311
Value Area 2 274 80
Value Area 3 188 60 Value Area 3 183
Value Area 4 102 40 Value Area 4 66
Value Area 5 0 0 Value Area 5 0
3.6 In terms of the implications for the CIL charging rates, the revised results indicate that the merged
zones of value areas 1 and 2 can support the higher rate of £80 per sq m with a significant viability
buffer. The results also indicate that the charging rates for all other zones remain viable with an
adequate viability buffer. Therefore, the result of this reappraisal indicates there is a case for merging
the two highest value zones and attributing the higher charge rate to this merged area, but retaining
all other rates as set out in the Preliminary Draft Charging Schedule as set out.
4.0 Remodelling of Strategic Allocations
Strategic Site Allocations
4.1 In this section we present the results of further testing of strategic sites originally set out in Section 8
of the Viability Study published in October 2015. Within our earlier report only a single phase of these
sites were appraised but as a result of further information being available they have now been
appraised in their entirety.
4.2 The sites that have been retested are:
Dewsbury Riverside (H2089)
Chidswell (MX1905) Bradley Golf Course (H1747 & H351)
Blackmoorfoot Road (MX1930)
Storthes Hall (MDGB2134)
4.3 In addition to these sites a further site allocation has been appraised which is referenced as ‘Westgate’
located in Cleckheaton (MX3349).
4.4 The sites have been modelled in Argus Developer which is an industry standard development
appraisal and valuation software. The assessment is based on a period by period residual
development appraisal in a form consistent with the area wide viability appraisals.
Site details and development assumptions
4.5 The sites have been assessed based on their residential development capacity consistent with the
proposals emerging in the Draft Local Plan. Because the land values benchmarks are based on net
developable areas, for the purposes of benchmarking, net site areas have been used and where these
areas were not available, an implied figure has been used assuming a development density of 35
dwellings per ha. Whilst most of these sites’ development will include areas designated for other
supporting uses such as community facilities and green infrastructure, these have been excluded from
the calculation of net developable areas as would typically be expected when calculating land value
benchmarks on a net developable basis.
Table 4.1: Site details
Site Net developable area Units
Dewsbury Riverside (land 66.00 ha* 2310 units
south of Ravensthorpe Road,
Thornhill Leeds, Dewsbury)
Chidswell, land east of Leeds 43.86 ha* 1535 units
Road, Shawcross, Dewsbury
Bradley Golf Club, land north of 55.94 ha* 1958 units
Bradley Road, Bradley,
Huddersfield
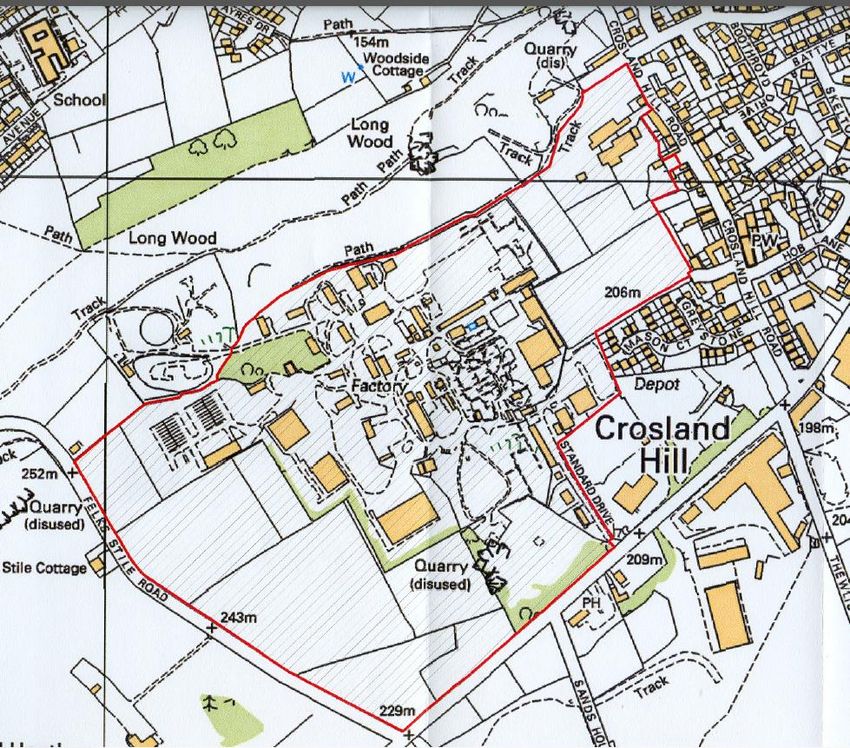
Blackmoorfoot Road, land north 12.60 ha* 441 units
of Blackmoorfoot Road,
Crossland Moor, Huddersfield
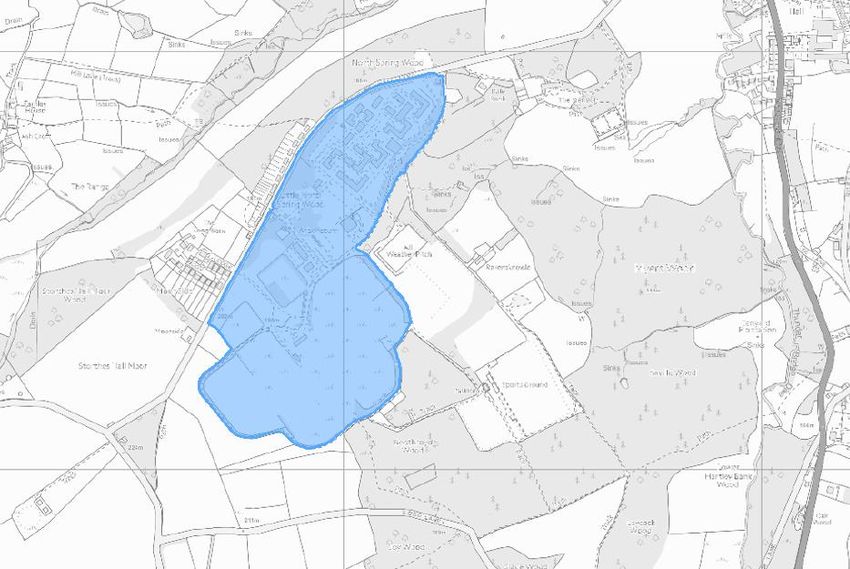
Storthes Hall Student Village 14.43 ha 505 units
and site of former Storthes Hall
Hospital, Storthes Hall Lane,
Kirkburton, Huddersfield
Land adjacent Westgate, 6.60 ha 198 units
Cleckheaton
4.6 In respect of the development assumptions, a dwelling mix and dwelling size has been assumed
consistent with the area wide assumptions set out in the original viability study (October 2015). This
is based on a dwelling mix of 25% 2 bed, 40% 3 bed, 25% 4 bed and 10% five bed. The application
of this mix and the size assumptions from the 2015 report generates an overall floor area which has
been applied in the development appraisals.Development appraisal assumptions
4.7 Each site has been assessed to determine the most suitable value, timing and cost assumptions to
apply. In the main, the appraisal assumptions are consistent with those used in the area wide model
although where justified by site specific circumstances different inputs have been used. The principal
differences are in respect of the overall quantum of development and the phasing and timescales for
delivery.
4.8 Details of the assumptions that have been used for each site are set out in proforma format in
Appendix 3. Because of the size of each site, it is assumed that each will be delivered via multiple
delivery outlets with an appropriate phasing of payments for land and infrastructure. Delivery rates
have been assumed at between 20 and 40 units per annum per outlet with adjustments being applied
according to the quantity of housebuilders assumed on each site. It has been assumed that each
house-builder will draw-down land for circa 100 units at a time with payments being made at each
draw-down.
4.9 Because of a lack of technical information relating to site infrastructure and abnormal development
costs we have had to make allowances for site infrastructure and abnormal development costs. It
should be noted that this is merely an allowance and that in practice such requirements could change.
The approach we have used is consistent with the area wide assessments in which a minimum land
price was assumed alongside an allowance of £370,560 per ha (£150,000 per acre) for site abnormal
development costs. Depending on the density of development achieved this allowance for abnormal
development costs equates to approximately £15,000 per dwelling.
Results
4.10 Full details of the appraisal assumptions together with the Argus Appraisal summaries is set out at
Appendix 3. A summary of the results, expressed in terms of the headroom for CIL, is provided in
Table 4.2 below. The CIL headroom is effectively the maximum amount of CIL the development can
afford, to be paid in instalments at the commencement of each phase of the scheme.
4.11 The results indicate that all sites are viable with the exception of Westgate in Cleckheaton, and able
to deliver the affordable housing policy requirements and a CIL tariff. The range of CIL headroom
figures varies from £27 per sq m to £153 per sq m for Storthes Hall. This reflects the relative market
strength of each site’s location and is broadly consistent with the area wide viability analysis.
Table 4.2: Site Specific Appraisal Results
Allowance for Headroom
Gross residual Allowance for abnormals and Headroom for CIL per
Net area (ha) land value land costs site infrastructure for CIL sq m
Dewsbury Riverside 66.00 £70,017,594 £40,771,500 £24,462,900 £4,783,194 £27
£617,750 per ha £370,650 per ha
Chidswell 43.86 £49,115,384 £27,094,515 £16,256,709 £5,764,160 £49
£617,750 per ha £370,650 per ha
Bradley Golf Course 55.94 £62,728,925 £34,558,700 £20,735,220 £7,435,005 £49
£617,750 per ha £370,650 per ha
Blackmoorfoot Road 12.6 £13,391,701 £7,783,650 £4,670,190 £937,861 £27
£617,750 per ha £370,650 per ha
Storthes Hall 14.429 £24,262,187 £12,924,596 £5,348,109 £5,989,482 £153
£895,738 per ha £370,650 per ha
Land adjacent
Westgate, 6.6 £3,317,756 £2,854,005 £2,446,290 -£1,982,539 -£129
Cleckheaton £432,425 per ha £370,650 per ha
4.12 Relating these findings to the proposed charging rates indicates that these headroom levels broadlycorrelate to the charging zones in the anticipated revisions to the Preliminary Draft Charging Schedule:
Dewsbury Riverside would largely fall into a £20 per sq m zone with part being in the nominal £5
per sq m zone
Chidswell is located in the £20 per sq m charge zone and indicates capacity to deliver this rate
of CIL.
Bradley Golf Club would partly fall into the nominal charging zone (£5 per sq m) and partly in the
mid charging zone (£20 per sq m) both tariff rates being significantly below the maximum
headroom figures.
Storthes Hall is located within the highest charging zone of £80 per sq m, with the appraisal
displaying the potential for this site to meet the tariff.
Land adjacent to Westgate in Cleckheaton is the only site that indicates there is no potential for
CIL. However this site is already in the lowest charging area.
4.13 Therefore it is considered that these results provide a further justification for the CIL rates proposed,
indicating the capacity of the tested sites to deliver the required CIL levy. Although there are
acknowledged to be a significant number of unknowns at the current time as regards site development
costs, there is considered to be adequate potential to insulate the potential for variations with the
abnormal allowances and other viability buffers within the appraisal model.
4.14 There is also considered to be a case for a site specific CIL charging rate for the three largest strategic
sites – Dewsbury Riverside, Chidswell and Bradley – which are differentiated by their scale and
importance to the delivery of the Local Plan. The benefits of applying such an approach are that it
creates a charging rate based on individual site circumstances and also ensures that complexity
created by having multiple charging rates and zones crossing the site, is avoided. However, due to
the lack of site information that has been supplied in respect of these sites which would make opting
for a site specific CIL risky given the unknowns.
5.0 Student Residential Development
Market
5.1 There has been a significant amount of private student residential development in recent years in
Huddersfield, reinforcing the strength of the market. This can be seen as a result of numerous factors
including the University gaining various accolades and recognition and being ranked within the 10 top
in England for student satisfaction and teaching excellence.
5.2 The University is located to the south of Huddersfield town centre, and attracts a city centre living
market. Students are generally more attracted to living in the town centre within walking distance of
the University and amenities. The table below shows this shift in student accommodation with a
number of private student accommodation schemes now located within the Town Centre (HD1):
Table 5.1: Student accommodation in Huddersfield
Property No. of beds Location
Palace Studios, Kirkgate 120 HD1 1QJ
Aspley House, Firth Street 729 HD1 3BN
Little Aspley HouseSnow Island, Kings Mill Lane 108 HD1 3AU
Canalside Halls, Firth Street 35 HD1 6SD
Castings House, Kings Bridge 653 HD1 3DG
Road
100 Firth Street – Unite 200 HD1 3BQ
Students
Edge Student Living, 1 Ray 80 HD1 6BB
Street
Saw Mill, Kings Mill Road 378 HD1 3AN
Kirkgate Residence, Oldgate 100 HD1 6HQ
Broomfield House, Firth Street 35 HD1 3DA
Northpoint Student Living, 5 57 HD1 2RD
Northumbria Street
Storthes Hall Park Student 1,386 HD8 0WA
Village
Ashenhurst Houses Student 280 HD4 6QN
Village
Firth Point 200 HD1 3BQ
Oldgate House 179 HD1 6QF
TOTAL 4,540
5.3 Below is a table that shows private student accommodation average weekly rent and let lengths based
on research carried out by Cushman and Wakefield’s student residential team for the 12 months of
2015:
Table 5.2: Student Accommodation Rents in Huddersfield
Student Operator Av. Weekly Rent Average Let length
Accommodation
Ashenhurst Houses DIGS Student 86.67 39
Aspley Halls Prodigy Living 140.50 48
Canalside Canal side - -
Firth Point UNITE 110.50 44
Kingsmill Studios Kingsmill Studios 152 51
Kirkgate Residence Kirkgate Residence 109.24 46
Saw Mill UNITE 129.18 47
Snow Island UNITE 114.60 47
Strothes Hall Park DIGS Student 101 42
The Castings Prodigy Living 137.43 49
5.4 The ranges in average weekly rent vary between £86 - £152, these variances will be based on the
different specification of the accommodation available and the vicinity to the University.
Appraisal assumptions
5.5 A development appraisal of a typical Huddersfield town centre private student residential scheme has
been produced. The table below sets out the assumptions used in the development appraisal. The
scheme assumption is based on recent developments of student residential development in
Huddersfield town centre, as detailed in the table. Other appraisal assumptions are based on marketresearch, with explanatory comments provided:
Table 5.3: Student Accommodation Appraisal Assumptions
Variable/Input Assumptions Comments
Scheme Site area 0.57 ha Based on review of recent planning
assumption 500 beds permissions in Huddersfield
2 blocks - Former Robert Castings site,
Colne Road (p/p Feb 2012) -
653 beds @ 0.74 ha = 883 units
per ha. GIA 19,544 = 30 m2 per
room
- Land adjacent to Manchester
Road (P/P 19/08/2014) – 504
rooms @ 0.5978 ha = 843 per
ha
Rental £139 per week for 49 weeks Based on average achieved for Castings
assumptions in 2015
Voids and bad 5% Industry assumption
debts
Operating £1500 per room Industry assumption
costs
Investment 6.5%, 6.75% and 7% Based on C&W market intelligence.
yield Student residential yields can range
depending on the whether it is a direct
development for the university or a
private sector development. In this
instance it is a private sector
development; these include private let
and a nomination agreement. A
nomination agreement is where an
agreement is in place with the university
to fill the accommodation, commanding
a stronger yield. The other is a standard
private let. The range in yields is 5.75% -
7.25%. Based on a review of
comparable evidence and discussion
with Cushman and Wakefield’s student
residential investment team, we have
applied three yield scenarios of 6.5%,
6.75% and 7% which we consider
provides a suitable range of most likely
investment outcomes.
Purchaser’s 1.8% (1% Agent, 0.5% legal, Stamp duty rate is based on new
costs 0.3% VAT) legislation introduced in March 2016,
Stamp duty @ a relevant rate legal and agents fees are based on
prevailing market rates
Land costs Residualised and Land costs for student residential
benchmarked against town development vary according to location
centre land price of and site condition. Land prices will also
£1,235,500 per ha (£500,000 be influenced by the density of
per acre)development achieved and the quantity
of bedrooms created on site.
Build costs £1,391 sq m (gross internal Source: BCIS – (Kirklees Q2 2016)
floor area) 15,000 x 1,391 = Discussion with student accommodation
£20,865,000 specialists indicates that typically build
costs per bed are in the order of £40,000
+ 10% uplift for external to £45,000 for new build student
works applied = £22,951,500 accommodation. For 500 beds this
equates to £20,000,000-£22,500,000,
which is broadly comparable with the
BCIS costs applied.
S106/S278 £945 per room Based on planning permission for student
costs residential development at Manchester
Road Huddersfield, (approved
19/08/2014). Sum of £466,667 + £10,000
for on-site public realm and monitoring
fee. Equates to £945 per room.
Contingencies 3% Industry Assumption
Professional 8% Industry Assumption
fees
Finance Costs 6.75% debit, 0.5% credit Industry Assumption
Sales Agent & 1.25% Industry Assumption
Legal fees
Developers 20% on cost Industry Assumption for commercial
profit based development projects
Appraisal results and implications for CIL
5.6 The results show a marked difference in the ability of development to withstand CIL across the yield
sensitivities. At a yield of 6.5% there is CIL headroom of approximately £80 per sq m. At the higher
yield of 7% there is no CIL headroom and at the mid-point of 6.75% there is a modest CIL headroom
figure of £17 per sq m.
Table 5.4: Appraisal results
Residual Benchmark Headroom
Net area (ha) GIA (m2) land value land value Headroom per sq m
Yield 6.5% 0.57 15000 £1,908,272 £704,235 £1,204,037 £80
Yield 6.75% 0.57 15000 £962,102 £704,235 £257,867 £17
Yield 7% 0.57 15000 £67,028 £704,235 -£637,207 -£42
5.7 The above analysis indicates there is a case for the application of a modest CIL tariff predicated on
the mid-point yield not exceeding £15 per sq m to allow for a small buffer, however it is important that
this is considered in the context of the potential for variation in other key assumptions. The yield
analysis underlines the sensitive nature of student residential development to changes in key variables
and there is also a significant degree of uncertainty as regards site abnormals and land costs. With
many sites being town centre based there is likely to be significant abnormal development costs
associated with site assembly and remediation – above that allowed for in the above appraisal.Therefore in determining whether to introduce a tariff for student residential developments,
consideration must be given to achieving an appropriate balance between infrastructure funding need
and not placing delivery at risk.
6.0 Conclusions
6.1 In conclusion, the review and additional research undertaken alongside the consultation has identified
the potential for a series of small modifications to the Council’s charging strategy as set out in the
Preliminary Draft Charging Schedule. These are:
Adjustments to charging zones to align with updated viability evidence
Reduction in the number of residential charging zones from five to four
Consideration to be given to the introduction of a tariff on student residential accommodation not
exceeding £15 per sq m.Appendix 1 Response to representations
Issues
Who Summary Response
Older persons accommodation has been tested
Test Older separately. See chapter 5.5 on other sectors and also
People's Page 51 on the results. A care home was tested and
Accommodation indicated there was no CIL headroom. Therefore
Planning Bureau and have specialist forms of supported retirement housing (i.e. C2
(McCarthy & separate in the Use Classes Order) should be excluded from the
Stone) charge rate Residential charge rates.
The charging zones are based on average house prices
mapped by postal code. The rates that apply within
those zones are based on new build revenue evidence
that has been researched within each zone. The
average house price map has been updated and
additional new build evidence carried out to reinforce the
evidence base. The average house price bands have
been adjusted to align more closely with the new build
evidence. The bands have been simplified from five to
four areas taking into account the updated evidence.
The revised high value band is based on an average
house price of £190,000 to £294,000, in which the
average revenue from new build evidence is
Merge zones 1 approximately £3476 per sq m (£230 per sq ft). The
Tangent & 2 (rates too remodelling of the viability appraisals indicate that this
Properties high) area can support the PDSC tariff of £80 per sq m.
Viability Study
section 5.1.4 -
Table 5.3 -
challenging
sales rates of
individual
schemes in
other zones
compared to
zone 1.
Suggest no
evidence to Rates have been reviewed and charging zones 1 and 2
differentiate have been amalgamated under a blended rate of £2476
Tangent between zones per sq m (£230 per sq ft) which is supported by evidence
Properties 1&2 (see response to last question)
Dewsbury Accept need for single revenue for Dewsbury Riverside -
Riverside revised value area places the site in Value area 2 - £200
Assumptions - psf, it is also close to Moor Croft (£220 psf) and
5, 8.4 and Marmaville (£190 psf). Therefore propose overall value
Appendix 3 as £200 psf.Issues
Who Summary Response
The use of average house prices (i.e. blended and new
build housing prices) is the only comprehensive and
consistent means of documenting residential property
values on an area-wide basis. However, whilst it is useful
in informing geographical areas, it is the new build sales
evidence which we have used to inform the value
assumptions which we have over-layed across the
average house prices. We note the alternative map that
has been presented in the representation which
p11 Savills disaggregates the District into a greater number value
Heat Map and area bands. Whilst this provides an interesting illustration
value of the small variation in average house prices at a
comparison / neighbourhood level, we do not consider it appropriate to
are secondary apply this level of disaggregation in the viability analysis
sales values nor in ultimately in the charging schedule. We consider it
relevant? is overly complex and more significantly there is
review heat inadequate new build sales evidence to substantiate the
map and sales value assumptions that could be applied in each
update, justify area.
Value areas 3,
4 & 5 should
be reviewed
and based on
OS Value areas have been reviewed.
The area wide analysis was based on 10 schemes in five
value areas, at six different affordable housing scenarios
Residential - this equates to 300 appraisals. The appraisals were
Development then subject to three sensitivity tests (plus and minus
Scheme revenue and plus cost). On top of this the five major
Selection - strategic allocations were tested with various sensitivities.
suggest We consider that the quantity of schemes tested to
broader adequately meet the requirements of appropriate
assessment - available evidence - critically they are considered to
including provide an adequate range of sites that reflect the most
sensitivity likely development in the District. An additional site
analysis of size specific appraisal has been carried out of a brownfield
and distribution site in Cleckheaton.
Residential The area wide analysis was based on 10 schemes in five
Development value areas, at six different affordable housing scenarios
Scheme - this equates to 300 appraisals. The appraisals were
Selection - then subject to three sensitivity tests (plus and minus
'Taylor revenue and plus cost). On top of this the five major
Wimpey is strategic allocations were tested with various sensitivities.
sceptical We consider that the quantity of schemes tested to
whether this adequately meet the requirements of appropriate
broad mix available evidence - critically they are considered to
reflects the provide an adequate range of sites.
market and
suggests that
evidence be
produced to
justify the
assumption -
suggest testing
broader range
of sites (more
that 5)Issues
Who Summary Response
Savills
preparing
viability
assessment for
Dewsbury
Riverside so
challenged CW C&W has engaged with the promoted who has not been
and happy to able to provide any further viability appraisal or evidence
discuss at this stage.
The representation demonstrates new build revenues of
£203 per sq ft (Moor Croft) and £222 per sq ft
(Meadowbrook). Whilst these developments are not
Indicative immediately adjacent to the Dewsbury Riverside area,
development they are considered within the same housing market and
sites are not given the scale of Dewsbury Riverside we consider there
near Dewsbury to be a realistic prospect of creating a market that is
Riverside p.13 above the tone of the existing neighbourhood.
Our revised value area map indicates Dewsbury
Riverside to straddle two value areas (Value Area 4 £150
psf and Value Area 2 £200 psf). Given the potential of
Suggest the wider housing market demonstrated by new build
blended rate evidence we consider it appropriate to model the first
for whole site phase of 500 units at the £185 psf suggested and then
of 185/sq ft. increasing to £200 psf.
Suggest a
contingeny of 3% allowance for contingencies is within the industry
5% rather than standard. A separate allowance for abnormals has been
3% due to made. Conservatisms elsewhere in the appraisals allow
uncertainty of for insulation against variations (e.g. abnormals, land
abnormals value benchmarks).
The blended profit is justified by the fact that affordable
units are delivered effectively on a pre sale basis
resulting in the risk profile and thus profit requirements
being different. The HCA DAT model states that profit on
affordable houses “[profit rate] should be moderate to
p.15 PROFIT reflect low risk of this activity. Note BCIS costs include
suggest 20% contractors’ profit, therefore should be zero when based
on all units on BCIS costs”
p18.
Timescales of
delivery and
cashflow
assumptions -
App 3 - is the
phasing
aligned with all
our emerging Revised appraisals for Dewsbury Riverside produced
evidence? with bespoke phasing.Issues
Who Summary Response
Affordable
Housing (p.19)
"we would
strongly
advocate that
these transfer
values and
tenure mix be
reviewed to
reflect changes
in affordable
housing policy
going forward.
Moreover, if the
Council wants
to maintain The tenure mix and transfer values are based on the
close policy current SHMAA and policy in respect of transfer values.
levels of The rent transfer values are based on social rent rather
affordable than affordable rent which is now the predominant form
housing then of rented affordable product; given that affordable rent is
the need for generally a higher value than social rent, this could mean
greater levels an under estimation of the potential transfer value.
of flexibility in Similarly, given the likelihood of starter homes forming
the definitions, part of the mix, this will also increase the overall transfer
tenure mix and value equation. Therefore, the current transfer values
restrictions on are conservative and there is considered to be significant
use is in built viability buffers in view of the changes that are
paramount. expected in the near future.
S106 and zero
carbon: 5%
zero carbon
uplift not Noted - this is a sensitivity only, it has not been the basis
relevant for determining CIL headroom.
Residential
Land Values: Original correspondence provided by Spawforths
don’t agree indicated that there would be three different values
with 3 separate occurring across the Dewsbury Riverside site. The
value areas for revised appraisals have been updated with blended
DR revenues across the whole site.
Details of site abnormal development costs are limited.
The allowance is expected to provide for a typical level of
site abnormal costs. Site specific appraisals indicated
that where abnormals are particularly high there is a
Abnormals: greater tolerence in the price that land owners will be
want more willing to accept for the release of their sites. The
evidence to evidence set out in Appendix 1 of site specific viability
justify abnormal cases indicated a target minimum land value of £150,000
£150,000 per per acre. Therefore, applying this level to the serviced
acre, site value benchmarks used in our appraisals suggests
considering an even greater tolerence for abnormals than previously
topography indicated.Issues
Who Summary Response
Evidence indicates that £80 psm in the highest value
areas would be viable with a reasonable viability buffer.
The rates are not set at the limit of viability. It is
Overall important to not make simple comparisons to other
Viability: locations as Kirklees has a lower affordable housing
concerned that requirement than say Wakefield (20% compared with
£60-£80 would 30% of all units) which increases the relative headroom
be unviable for CIL in Kirklees.
DR rep p.20 -
suggest varying
AH rates AH rates have been varied in the sensitivity analysis.
Appendix 3
Chidswell
appraisal -
WYG update
Residential site
coverage - their
experient
15,500 sqft
The updated market evidence locates Chidswell within
Value Area 3 which has an average new build revenue of
£200 psf. However we consider the potential for an
Sales values - increase in value given site's scale, strategic location
they say £170 and the potential to create a market. Also note that there
per sqft rather is already a precedent established for an even higher
than £200 for revenue being achieved within this location on the
value area 3 Amberwood Chase development.
Sales values -
Amberwod
Chase scheme
not
representative
of Chidswell.
Plus other Amberwood chase now achieving £220 psf. Chidswell
examples has potential to deliver higher sales values than its
suggesting immediate locality via creation of a new market, but we
£200 p sqm is would acknowledge that this would not be possible within
too high the early years of the development.
Contingencies -
should be 5%
rather than 3% 3% allowance for contingencies is within the industry
based on standard. A separate allowance for abnormals has been
unknown cost made. Conservatisms elsewhere in the appraisals allow
and abnormals for insulation against variations (e.g. abnormals, land
of gf site value benchmarks).
5.8 Policy
standards -
want
clarification that
strategic sites
will have £5000
per unit S106
costs This is an assumption at a point in time.Issues
Who Summary Response
Land value - Land value benchmarks are based on net site areas,
want therefore the gross / net split is not relevant in the
clarificaiton of appraisal. If site benchmarks were based on gross
60:40 gross to areas, the benchmarks applied would be substantially
net split less.
Strategic Sites
should fall in
Zero charging
rates due to
high cost of on
site
infrastructure
provision
(Savills
research - over
30 adopted
CILs with 0 for
strategic sites) Noted
Older peoples
accommodation
should be
tested
separately. The
Borough's
housing market
does not vary
enough to
WYG (Priority justify £0 to £80
Assets variations of
Management) chargesAppendix 2 Updated market research
New Results
N
e
Developer Address Transaction Date Sales Price Achieved (£) Area (sqft) £/sqft
t
s
HD3 3ZG, 3ZY
77 Tennyson Avenue 30-Oct-15 £ 205,000 1109 £ 184.85
83 tennyson Avenue 23-Oct-15 £ 295,000 1259 £ 234.31
71 tennyson avenue 23-Sep-15 £ 225,000 1152 £ 195.31
67 tennyson avenue 02-Sep-15 £ 165,000 775 £ 212.90
Miller Homes
19 tennyson avenue 24-Jul-15 £ 215,000 1109 £ 193.87
79 Tennyson Avenue 23-Oct-15 £ 210,000 1109 £ 189.36
73 tennyson aenue 18-Sep-15 £ 165,000 775 £ 212.90
54 tennyson avenue 21-Aug-15 £ 205,000 1109 £ 184.85
68 tennyson avenue 21-Aug-15 £ 165,000 775 £ 212.90
36 tennyson avenue 27-Mar-15 £ 200,000 1109 £ 180.34
£ 200.16
WF15 8LU
4 victoria close 28-Aug-15 £ 299,995 1518 £ 197.63
6 victoria close 28-Aug-15 £ 299,995 1518 £ 197.63
8 victoria close 21-Aug-15 £ 254,995 1238 £ 205.97
10 victoria close 20-Aug-15 £ 274,995 1410 £ 195.03
22 victoria close 07-Aug-15 £ 249,995 1410 £ 177.30
18 victoria close 31-Jul-15 £ 274,995 1410 £ 195.03
12 victoria close 31-Jul-15 £ 274,995 1410 £ 195.03
14 victoria close 09-Jul-15 £ 354,995 1238 £ 286.75
1 victoria close 26-Jun-15 £ 325,995 1690 £ 192.90
16 victoria close 26-Jun-15 £ 304,995 1615 £ 188.85
Harron Homes £ 203.21
WF12 7SY, WF12 7PZ
15 Hawthorn Court 21-Dec-15 £ 209,995 850 £ 247.05
5 Hawthorn Court 18-Dec-15 £ 209,995 850 £ 247.05
8 hawthorn Court 18-Dec-15 £ 191,996 850 £ 225.88
7 Hawthorn Court 18-Dec-15 £ 259,995 1313 £ 198.02
9 Hawthorn Court 18-Dec-15 £ 209,995 850 £ 247.05
3 hawthorn Court 18-Dec-15 £ 219,995 1023 £ 215.05
6 hawthorn Court 11-Dec-15 £ 259,995 1313 £ 198.02
4 hawthorn court 11-Sep-15 £ 239,995 1141 £ 210.34
1 Hawthorn Court 11-Sep-15 £ 247,995 1206 £ 205.63
2 Hawthorn Court 28-Aug-15 £ 247,995 1206 £ 205.63
£ 219.97
HD3 3HT
51 stirling wood close 21-Aug-15 £ 234,995 1249 £ 188.15
10 stirling wood close 14-Aug-15 £ 264,995 1152 £ 230.03
3 stirling wood close 19-Jun-15 £ 264,995 1152 £ 230.03
47 stirling wood close 19-Jun-15 £ 284,995 1367 £ 208.48
4 sirling wood close 12-Jun-15 £ 284,995 1378 £ 206.82
Taylor Wimpey
49 stirling wood close 12-Jun-15 £ 264,995 1152 £ 230.03
5 stirling wood close 05-Jun-15 £ 264,995 1152 £ 230.03
7 stirling wood close 05-Jun-15 £ 264,995 1152 £ 230.03
11 stirling wood close 21-May-05 £ 274,995 1249 £ 220.17
6 stirling wood close 19-May-15 £ 249,995 1249 £ 200.16
£ 217.39
HD9 7FD, HD8 9UT
14 Weavers Mill Court 12-Feb-16 £ 387,995 1507 £ 257.46
5 Weavers Mill Court 29-Jan-16 £ 340,995 1367 £ 249.45
8 Weaves Mill Court 25-Jan-16 £ 325,995 1335 £ 244.19
3 Weavers Mill Court 08-Jan-16 £ 309,995 1227 £ 252.64
6 Weavers Mill Court 18-Dec-15 £ 385,995 1507 £ 256.13
Jones Homes
£ 251.98
WF14 9FA
23 Moor croft close 29-Oct-15 £ 335,000 1410 £ 237.59
27 moor croft close 29-Oct-15 £ 192,000 969 £ 198.14
19 moor croft close 02-Oct-15 £ 337,500 1442 £ 234.05
18 moor crfot close 29-Sep-15 £ 229,950 1216 £ 189.10
17 moor croft close 25-Sep-15 £ 340,000 1410 £ 241.13
Ben Bailey
16 moor croft close 23-Sep-15 £ 229,950 1216 £ 189.10
10 moor croft close 28-Aug-15 £ 225,000 1216 £ 185.03
12 moor croft close 28-Aug-15 £ 305,000 1163 £ 262.25
15 moor croft close 28-Aug-15 £ 335,000 1142 £ 293.35
8 moor croft close 26-Aug-15 £ 225,000 1216 £ 185.03
£ 221.48HD8 9AY, 9US
18 strike lane 02-Sep-15 £ 350,000 1378 £ 253.99
20 strike lane 15-Apr-15 £ 259,950 1130 £ 230.04
14 strike lane 10-Apr-15 £ 247,950 1055 £ 235.02
16 Emley view 11-Dec-15 £ 159,950 700 £ 228.50
6 emley view 23-Oct-15 £ 323,950 1378 £ 235.09
Redrow Homes
4 emley view 22-Oct-15 £ 323,950 1378 £ 235.09
12 emley view 16-Oct-15 £ 247,950 1055 £ 235.02
9 emley view 01-Sep-15 £ 159,950 700 £ 228.50
1 emley view 20-Aug-15 £ 259,950 1130 £ 230.04
10 emley view 07-Aug-15 £ 248,500 1055 £ 235.55
5 emley view 24-Jul-15 £ 159,950 700 £ 228.50
£ 234.12
WF14 9TS
44 marmaville 22-Jun-15 £ 134,995 764 £ 176.70
30 marmaville 04-Jun-15 £ 132,995 657 £ 202.43
Bovis Homes
7 marmaville 27-Mar-15 £ 209,995 1109 £ 189.36
22 marmaville 23-Jan-15 £ 137,995 732 £ 188.52
£ 189.25
HD9 7FE
16 the bridges 18-Dec-15 £ 229,500 947 £ 242.34
15 the bridges 15-Dec-15 £ 220,500 1001 £ 220.28
Eastwood Homes 1 the bridges 28-Aug-15 £ 150,000 667 £ 224.89
2 the bridges 28-Aug-15 £ 150,000 667 £ 224.89
£ 228.10
WF17 0HW
3 bed Kilburn £186,995 936 £199.78
3 bed kilburn £184,995 936 £197.64
3 bed kilburn £182,995 936 £195.51
3 bed Cherhill 1088
Rouse Homes
3 bed Cleadon 1019
4 bed woolbury £239,995 1382 £173.66
4 bed westbury £218,995 1182 £185.27
4 bed westbury £209,995 1182 £177.66
£188.25
Beech Farm Development, Beech Court, Farnley Tyas, Huddersfield HD4 6AX, HD4 6BE, HD4 6AQ
4 beech court 22-Jun-15 £ 247,000 828 £ 298.31
1 beech court 10-Jun-15 £ 257,000 828 £ 310.39
2 beech court 02-Jun-15 £ 250,000 828 £ 301.93
Farnley Estates
5 keepers Way 16-Nov-15 £ 440,000 1389 £ 316.77
3 Keepers Way 11-Jun-15 £ 94,000
4 Manor Drive 27-Jul-15 £ 125,000
£ 306.85
Towngate, Mirfield - ASKING PRICES
Plot 1 - 55 Towngate N/A £ 325,000 1944 £ 167.18
Darren Brooke
Plot 2 - 53 Towngate N/A £ 295,000 1579 £ 186.83
Homes
Plot 3 - 51 Towngate N/A £ 295,000 1460 £ 202.05
£ 185.35
Old Bank, Slaithwaite, HD7 5AR
SB Homes 4 Old Bank 23-Jun-15 £ 290,000 1335 £ 217.23
Orchard Close, Hallas Road, Kirkburton HD8 0ZF
2 Orchard Close 28-Aug-15 £ 440,000 2379 £ 184.95
Worth Homes 3 orchard close 30-Mar-15 £ 460,000 2390 £ 192.47
5 orchard close 27-Mar-15 £ 435,000 2379 £ 182.85
£ 186.76
Roundhill Green, Gomersal, Cleackheaton, BD19 4TH
6 roundhill green 06-Nov-15 £ 251,700 1367 £ 184.13
8 roundhill green 22-Oct-15 £ 254,950 1367 £ 186.50
Leacroft Residential 14 roundhill green 09-Oct-15 £ 259,950 1367 £ 190.16
10 roundhill green 02-Oct-15 £ 250,000 1367 £ 182.88
16 roundhill green 21-Aug-15 £ 249,950 1367 £ 182.85
£ 185.30
The Forge Manchester Road, HD7 5RD
Brow 421 Manchester Road 13-Aug-15 £ 149,995 1098 £ 136.61
Developments 427 Manchester Road 07-Aug-15 £ 149,995 1098 £ 136.61
£ 136.61
Spring Place Park/Gardens, North Road, Northorpe, Mirfield,WF14 0QU
61 Spring Place Gardens 30-Oct-15 £ 169,995 958 £ 177.45
55 Spring Place 15-Oct-15 £ 143,000 958 £ 149.27
103 Spring Place 15-Aug-15 £ 169,995 1184 £ 143.58
93 Spring Place 29-May-15 £ 169,995 1184 £ 143.58
109 Spring Place 15-May-15 £ 179,995 1184 £ 152.02
Orion Homes
107 Spring Place 12-May-15 £ 199,995 1389 £ 143.98
97 Spring Place 01-May-15 £ 185,000 1356 £ 136.43
105 Srping Place 01-May-15 £ 199,995 1389 £ 143.98
69 Spring Place 30-Jan-15 £ 178,195 1259 £ 141.54
101 Spring Place 21-Oct-14 £ 170,000 1184 £ 143.58
£ 147.54
The Cuttings Brockholes, HD9 7HL
59 21-Aug-15 £ 235,000 N/A
67 29-May-15 £ 150,000 N/A
69 17-Apr-15 £ 149,995 N/A
Heywood Homes
41 17-Apr-15 £ 230,000 N/A
61 27-Mar-15 £ 235,000 N/A
39 18-Feb-15 £ 235,000 N/AAppendix 3 Updated Site Specific Appraisals
Kirklees Council
Site Specific Viability Analysis
Site 1 – Residential development
Location plan
Site address and Land south of Ravensthorpe Road, Thornhill Lees, Dewsbury (H2089)
reference
Site size 159 ha (assumed 66 ha net based on 2310 units at 35 DPH)
Land
Part Council owned / part private ownership
ownership/tenure
Details of proposed
Current Status: Housing Allocation, Safeguarded Land, Green Belt, Future Local Plan
development
Housing Allocation
including current
planning statusSite constraints No known site information
2,310 residential units
The site specific appraisal assumes:
Residential development in six phases:
Phase 1 delivering 140 dwellings:
Housing Mix
2 bed 3 bed 4 bed 5 bed
house house house house Total
No of units 35 56 35 14 140
Total floor space 2,450 5,040 4,095 1,960 13,545
Total market floor
space 1,960 4,032 3,276 1,568 10,836
Total AH floor space 490 1,008 819 392 2,709
AR / SR floor space 271 558 454 217 1,501
SO floor space 219 450 365 175 1,208
Accommodation
schedule Phase 2 delivering 280 dwellings:
Housing Mix
2 bed 3 bed 4 bed 5 bed
house house house house Total
No of units 70 112 70 28 280
Total floor space 4,900 10,080 8,190 3,920 27,090
Total market floor
space 3,920 8,064 6,552 3,136 21,672
Total AH floor space 980 2,016 1,638 784 5,418
AR / SR floor space 543 1,117 907 434 3,002
SO floor space 437 899 731 350 2,416
Phase 3 delivering 630 dwellings:
Housing Mix
2 bed 3 bed 4 bed 5 bed
house house house house Total
No of units 158 252 158 63 630Total floor space 11,025 22,680 18,428 8,820 60,953
Total market floor
space 8,820 18,144 14,742 7,056 48,762
Total AH floor space 2,205 4,536 3,686 1,764 12,191
AR / SR floor space 1,222 2,513 2,042 977 6,754
SO floor space 983 2,023 1,644 787 5,437
Phase 4 delivering 630 dwellings:
Housing Mix
2 bed 3 bed 4 bed 5 bed
house house house house Total
No of units 158 252 158 63 630
Total floor space 11,025 22,680 18,428 8,820 60,953
Total market floor
space 8,820 18,144 14,742 7,056 48,762
Total AH floor space 2,205 4,536 3,686 1,764 12,191
AR / SR floor space 1,222 2,513 2,042 977 6,754
SO floor space 983 2,023 1,644 787 5,437
Phase 5 delivering 630 dwellings:
Housing Mix
2 bed 3 bed 4 bed 5 bed
house house house house Total
No of units 158 252 158 63 630
Total floor space 11,025 22,680 18,428 8,820 60,953
Total market floor
space 8,820 18,144 14,742 7,056 48,762
Total AH floor space 2,205 4,536 3,686 1,764 12,191
AR / SR floor space 1,222 2,513 2,042 977 6,754
SO floor space 983 2,023 1,644 787 5,437
Start on site 2017 with two outlets open delivering 70 units per annum
Anticipated start 2019 four outlets open delivering 140 units per annum
date 2021 six outlets open
This delivery programme is based on evidence provided by the site promotersBuild period 3 months lead in period from first land payment
Phase 1 - 24 month construction period
Phase 2 - 24 month construction period
Phase 3 - 38 month construction period
Phase 4 - 38 month construction period
Phase 5 - 38 month construction period
The scheme will be delivered through
Phase 1 – 2 outlets at a total delivery rate of 70 units per annum
Phase 2 – 4 outlets at a total delivery rate of 140 units per annum
Phasing
Phase 3 – 6 outlets at a total delivery rate of 200 units per annum
Phase 4 – 6 outlets at a total delivery rate of 200 units per annum
Phase 5 – 6 outlets at a total delivery rate of 200 units per annum
Phase 6 – 6 outlets at a total delivery rate of 200 units per annum
20% affordable housing with tenure and transfer values consistent with area
wide assumptions, phased through life of development.
Planning gain incorporated into allowance of £370,650 per ha (£150,000 per
acre), paid out at the commencement of each phase.
Planning gain
(including AH) &
timing of payments
Revenue Market units:
First 2 phases, £1991psm (£185 psf)
Phase 3 onward £2,152psm (£200 per sq ft)
Shared ownership
£999 per sq m / £92.81 per sq ft
Affordable housing Rented (affordable and social) – 29.53% of market value
revenues £588 per sq m / £54.62 per sq ft
£964 per sq m (£90 per sq ft) inclusive of external works
Professional fees – 8%
Build costs
Contingency – 3%
Abnormals incorporated into allowance of £370,650 per ha (£150,000 per acre),
Abnormal costs
paid out at the commencement of each phase.You can also read