Kongsberg Automotive ASA - Fourth quarter 2015 | February 12, 2016
←
→
Page content transcription
If your browser does not render page correctly, please read the page content below

Kongsberg Automotive ASA
Fourth quarter 2015 | February 12, 2016

                                          1
Highlights

                   • Revenues of EUR 249.5 million, q-on-q growth of 3.8%
      Q4 2015      • EBIT of EUR 13.1 million (margin 5.3%) vs. Q4 2014 of EUR 5.7 million
     financials      (margin 2.4%)
                   • Strong product mix and fixed cost management

   Growth in new   • New business wins in Q4 at EUR 127 million p.a. value
     business      • Two-thirds of the Q4 new business value from Growth Platforms

                   • Europe: Both light & commercial vehicle production increased in 4Q15,
                     but some KA mature products less impacted by this growth
      Market
   developments
                   • Brazil & China: Commercial vehicle production continue to be at low
                     level

  Foundation for   • Focus on core products to build sustainable growth
     growth        • R&D investments are high and directed to growth platforms

                                                                                             2
Progress within growth platforms

                                                                                               Advanced Fluid
       Seat Comfort                              Efficient Powertrains
                                                                                                  Handling

            Interior                      Driveline                Driver Control                Fluid Transfer

  ▸ Next generation Seat          ▸ Japanese OEM             ▸ Contract for AMT gear        ▸ ABC coupling systems
    ventilation                     contract for SBW           shifters to top truck
    – European premium                                         maker                          – To leading Chinese bus
                                    shifters
      OEM                                                      - North American market          maker and global
                                    - B-segment cars in
                                                                                                supplier of truck
                                      Indian market
  ▸ New product area                                         ▸ AMT contract for                 breaking systems
    contract                      ▸ OBC for plug in hybrid     premium truck OEM
    – Interior panel heating to     electric car               - Supply to Europe and the
      Premium SUV                   - Significant break          Americas
                                      through in Chinese
                                      market
  ▸ Continue to increase                                     ▸ Significant progress in
    market share in                                            gaining future market
    premium car segment                                        share

 Booked in 4Q15                                                                                                          3
New business wins

  New business wins (LTM per annum value)
  EUR Million

                                                   ▸   Good order intake: EUR 127 million p.a. of
 350
                                            319
                                                       new business wins booked in Q4 2015
 300
                                                   ▸   EUR 319 million for new business booked
                                            127
 250                                                   in 2015 – an all time high level

 200                                               ▸   Approx. 54% in growth platforms
                            318      321
 150              293
          282

 100                                        192

 50

   0
          4Q14   1Q15      2Q15      3Q15   4Q15

                                                                                                    4
Converting R&D to new business

 LTM 4Q15 new business wins                            R&D spending
                     2014   2015                       R&D of sales                                       EURm
                                                      8%                                                     80
           19%                               19%
                                                      7%                                                      70
                             16%
                      14%
                                                      6%                                                      60
     13%                                                   Normalized R&D spending
                                                      5%                                                      50

                                                      4%                                                      40
                                        8%
                                                      3%                                                      30

                                                      2%                                                      20

                                                      1%                                                      10

                                                      0%                                                      0
                                      ADVANCED              2011      2012      2013   2014    2015   2016E
       SEAT          EFFICIENT
                                        FLUID
     COMFORT       POWERTRAINS                                         R&D             R&D of sales
                                      HANDLING

 ▸     New business wins in 2015 accumulated to        ▸    Increased R&D to develop new technology
       319MEUR per annual value
                                                       ▸    Supporting growth platforms
 ▸     Increased proportion of new business related
       to growth platforms from 2014 (~35%) to 2015    ▸    Normalized R&D spending expected to fluctuate
       (~54%)                                               around 5-6% of sales

                                                                                                                   5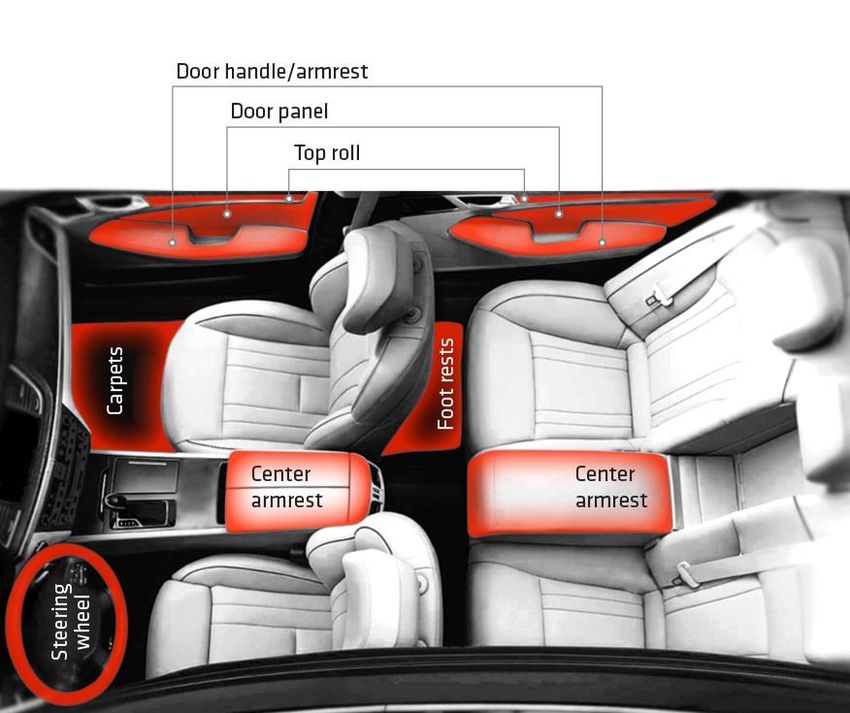
Seat comfort

Operational update

 ▸ Global supply of seat heat and seat
   ventilation to mid-size luxury vehicles
        – European premium OEM
        – worth an estimated EUR 76* million over 10
          years
        – Production in Pruszkow, Poland, & later
          Reynosa, Mexico & Wuxi, China

 ▸ New product area contract: Panel heating
     – Door panel heating to global European based
       premium automaker
            •    To enhance interior comfort in cold climates
                 and in electrified vehicles with no waste heat
                 from combustion engine
     – Strong growth potential with more electrified
       vehicles & strong comfort trend in vehicles

*Estimated life time value                                        6
Efficient Powertrains

Operational update

 ▸ Significant AMT segment contract win confirms
   strategy & ambition
        – EUR 100m* contract over 5 years
                • Reduces fuel consumption, minimizes
                  maintenance cost & enhances driver comfort
                • Production ramp up in 2020, from KA facilities in
                  Europe & Americas
        – In line with EUR 150 million ambition in annual
          sales in AMT segment within 10 years

 ▸ Shift-by Wire
     – Strategic contract secured with Japanese OEM in
       Indian market
     – B-segment cars
*Estimated life time value                                            7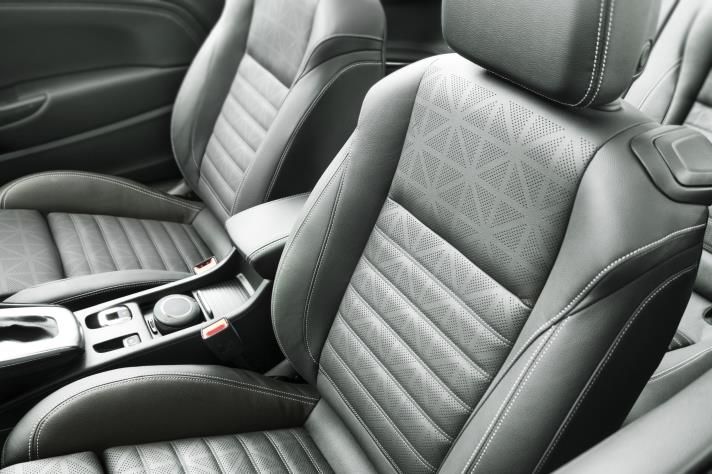
Advanced Fluid Handling

Operational update

 ▸ Important Air Handling contracts in China
   with total lifetime value of EUR 41m
   – For couplings to leading bus maker

 ▸ Air couplings to European system supplier
   – Worth EUR 17m over lifetime

 ▸ Two product launches in Air Handling
   segment and strong growth in Q4
   – Both programs related to Couplings for Scania with
     annual volumes at 500 000 and 800 000 units of
     couplings
   – Booked in 2013 and supplied from KA Raufoss

                                                          8
Trond Stabekk

Financial Update

                   9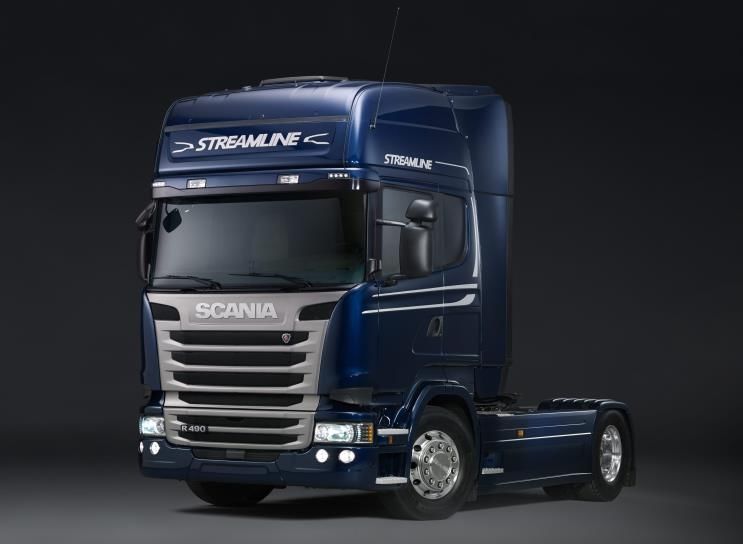
Group Revenue and EBIT

            Revenues                                                     EBIT and EBIT margin
            EUR million                                                  EUR million and percent

                                                                                      16.7
                            270
                                           266                                                       14.7
                                                                                                                         13.1
                                                               250
                                                                                                               11.5
             240
                                                     235

                                                                                      6.2%
                                                                          5.7                       5.5%                 5.3%
                                                                                                               4.9%

                                                                         2.4%

           Q4 2014        Q1 2015       Q2 2015     Q3 2015   Q4 2015   Q4 2014     Q1 2015        Q2 2015*   Q3 2015   Q4 2015
* Excludes EUR 19.5 million in Goodwill write-off
                                                                                                                                  10
Trend overview of business areas
Interior Driveline Driver Control Fluid Transfer
Revenues (EUR million)
83 82 86
77 80
70 68 71 69
64 62 61
58 59 56 57
55 52
48 50
EBIT (EUR million) and EBIT margin (%)
10 18% 4 6% 10 18% 10 15,3 % 14,5 % 18%
14,1 % 14,3 % 16%
16% 5% 16%
14% 14% 14%
10,1 % 12% 4% 9,5 % 12%
12%
8,0 % 8,7 % 3% 7,9 % 10%
7,0 % 10% 6,7 % 10%
6,3 % 1,4 % 1,1 % 6,6 % 5 8%
5 8% 1,0 % 2% 5
4,6 % 8%
6% 3,1 % 6% 6%
-0,3 % -0,1 % 0,6 1%
4% 1,0 0,7 4% 4%
0% 2%
2% 2%
4,8 6,6 5,7 6,9 8,6 0% -0,2 -0,1 -1% 1,9 4,7 5,5 2,5 4,1 0% 4,5 8,6 8,3 7,1 7,4 0%
0 -2% -1 -2% 0 -2% 0 -2%
* Excludes EUR 19.5 million goodwill write-off in Q2-15, Interior
11Revenue development
Revenues
EUR million
Revenues:
260
8.4 ► EUR 9.2 (3.8 %)
250 3.2 -7.5
3.0 -0.4 2.6
240 million above fourth
quarter 2014
230
220 ► End of production in
249.5 Driveline program
210 240.3
200 ► Exposure to South
190 America and China
180 ► Run-rate impacted
Q4 Interior* Driveline* Fluids* DCS* Others FX Q4
by currency effects
2014 2015
* Variances excluding FX effects
12EBIT development
EBIT
EUR million
EBIT
18
2.4 -1.8
15 0.0
2.9 ► Favorable changes in
12 product mix
0.4
3.5
9 ► Higher volumes
6 13.1
► Operational
3 5.7 improvements
0 ► Lower net R&D costs
Q4 Interior* Driveline* Fluids* DCS* Others Net FX Q4
2014 2015
* Variances excluding FX effects
13Net Profit development
Net Profit
EUR million
15
10
0.8 -6.7 Net profit:
14.5
5
-1.0 ► Lower interest expenses
0
► Positive change in
-5 1.2
7.4 unrealized FX effects
-10 -18.1
► Taxes impacted by
-15
reduction in deferred taxes
-20 and losses not capitalized
Q4 EBIT Interest FX Effects Others Tax Q4
2014 financial 2015
items
14Free Cash Flow (LTM)
Free Cash Flow (LTM)
EUR million
37
► Last Twelve Months Free Cash Flow
30
before repayment of debt
► Free Cash Flow trend impacted by
17 17
16 increased net working capital,
investments and purchase of treasury
shares as apposed to sale of treasury
shares last year
Q4 2014 Q1 2015 Q2 2015 Q3 2015 Q4 2015
15Cash flow and facility development
Available funds
EUR million
Cash flow Other
160.0
12.9 (20.8)
140.0 24.7
(2.1) 1.0 125.2
120.0 109.4
100.0
71.6
80.0 53.0
60.0
75.3
61.8
40.0
56.4 53.6
20.0
.0
Q3 2015 EBITDA Change in total Investments Net financial Other Q4 2015
NWC, and taxes expenses
paid
Cash (unrestricted) Unutilized facility
16Financial ratios
NIBD/EBITDA ROCE (Ltm)
Times Percent
2.4 2.4 2.4
2.2
2.1 11.8% 11.8%*
11.1% 10.4%* 9.9%*
6.7% 6.2% 7.8%
Q4 2014 Q1 2015 Q2 2015 Q3 2015 Q4 2015 Q4 2014 Q1 2015 Q2 2015 Q3 2015 Q4 2015
Equity ratio Avg. Capital Employed and turnover (Ltm)
Percent EUR million and Times
2.17 2.15 2.19
30.5% 30.7% 30.0% 30.7% 2.11
29.6% 2.06
481
463 463 469 466
Q4 2014 Q1 2015 Q2 2015 Q3 2015 Q4 2015 Q4 2014 Q1 2015 Q2 2015 Q3 2015 Q4 2015
17Philippe Toth, SVP Business Development & IR
MARKET UPDATE
18Market summary and outlook
Global industry growth
Country/ 2016 growth
Outlook
region estimate
+ 2.3% Modest growth in Europe. Western Europe up, Russia pulls down
+ 1.3% Modest growth in EU production for both internal sales and export
+ 2.3% Growth continues in 2016, but trails off around midyear
-Automotive development trends
Drivers Increased user experience Legislation
Comfort CO2 reduction Legislation
NOx reduction
End Premium segment & SUVs EV’s & Hybrids Trucks
segment CAGR 2015-20 ~ 5.4% CAGR 2015-20 ~ 16% CAGR 2015-20 ~ 6%
• Full range of premium • Light weight couplings
seat comfort solutions • Power electronics
KA • High temperature hoses
solutions from ePower
Focus • SBW technology
solutions • AMT solutions
Product content increase per vehicle
Down segment
Increasing
Increasing
fitment
Fitment
rate
rate
20A growing automotive market
Market segment outlook KA’s exposure by end-markets & regions
105 Light Duty Vehicles
CAGR 15-20: 3.2%
Millions
100
95 60%
90
85
80 50%
75
70
65 40%
60
2011 2012 2013 2014 2015 2016 2017 2018 2019 2020
Asia
SA
30%
NA
4.500 EU
Commercial Vehicles >6t
Thousands
CAGR 15-20: 20%
4.000 7.5%
3.500
3.000 10%
2.500
2.000 0%
2011 2012 2013 2014 2015 2016 2017 2018 2019 2020 Commercial Light Duty Non Auto Off-Highway/RV
Vehicles Vehicles
Source: IHS & LMC
21Hans Peter Havdal, CEO
STRATEGY & OUTLOOK
22Our strategic priorities
Focus on core
products to build
sustainable growth
• Seat Comfort
• Efficient Powertrains
• Advanced Fluid Handling
Optimizing
conventional Financial
product portfolio platform with
dividend
• Continued review potential
of segments to
optimize product
offering
23Targeting 3-5% annual growth towards 2020
Estimated sales (EURm)
Conventional products Growth platforms
▸ Growth platforms expected to
increase in revenue share from 30%
CAGR
to above 40% next five years ~10%*
– R&D spending and capex will be
focused on growth platforms
▸ Conventional products are still key
CAGR
in next 5 year period ~2%*
– Selective growth opportunities for
conventional products with limited
capex needs will be pursued
▸ Current business mix creates a
platform for organic growth and
R&D funding
2015 2016 2017 2018 2019 2020
*Kongsberg Automotive estimates 24Summary and outlook
▸ Strong momentum in new business wins
in 2015
– Booked strategic contracts in growth platforms
– ~ 54% total new business wins related to
growth segments
▸ Outlook for main addressable markets in
North America & Europe shows modest
growth in 2016
▸ KA expects Q1 2016 revenues of approx.
EUR 250 million
25Appendix
26Advanced Fluid
Seat Comfort Efficient Powertrains
Handling
Focusing on 3 growth platforms
Interior Driveline Driver Control Fluid Transfer
33% of revenues 24% of revenues 22% of revenues 21% of revenues
PRODUCTS PRODUCTS PRODUCTS PRODUCTS
• Seat climate systems • Shift by Wire systems • AMT systems • Pipe/hose assemblies for
• Seat support systems • Inverters & converters • Inverters & converters powertrains
• Head restraints • On Board Chargers • On Board Chargers • Couplings and manifolds
• Arm rests • Automatic & manual gear • Manual gear- and clutch for air distribution systems
• Light duty cables shifters systems • Industrial applications
• Shift cables &towers • Steering columns • Pipe/hose assemblies for
• Chassis stabilizers chassis systems
• Throttle- & brake pedals
Conventional products Growth platforms 27Calendar and Investor Relations contacts
Financial calendar 2016 IR contacts
Interim Reports Presentation Hans Peter Havdal
President & CEO
Telephone: +47 92 06 56 90
Q1 2016 14th of April 2016 15th of April 2016 E- mail: Hans.Havdal@ka-group.com
Trond Stabekk
Q2 2016 13th of July 2016 14th of July 2016 EVP & CFO
Telephone: +47 98 21 40 54
E- mail: Trond.Stabekk@ka-group.com
Q3 2016 20th of October 2016 21th of October 2016
Philippe Toth
SVP BD & IRO
Telephone: +47 98 21 40 21
E- mail: Philippe.Toth@ka-group.com
Kongsberg Automotive ASA
Telephone: +47 32 77 05 00
For more information, see: www.kongsbergautomotive.com/investor-relations/
28Disclaimer
This presentation contains certain forward-looking information and statements. Such forward-looking information and
statements are based on the current, estimates and projections of the Company or assumptions based on information currently
available to the Company. Such forward-looking information and statements reflect current views with respect to future events
and are subject to risks, uncertainties and assumptions. The Company cannot give assurance to the correctness of such
information and statements. These forward-looking information and statements can generally be identified by the fact that they
do not relate only to historical or current facts. Forward-looking statements sometimes use terminology such as "targets",
"believes", "expects", "aims", "assumes", "intends", "plans", "seeks", "will", "may", "anticipates", "would", "could", "continues",
"estimate", "milestone" or other words of similar meaning and similar
expressions or the negatives thereof.
By their nature, forward-looking information and statements involve known and unknown risks, uncertainties and other important
factors that could cause the actual results, performance or achievements of the Company to differ materially from any future
results, performance or achievements that may be expressed or implied by the forward-looking information and statements in
this presentation. Should one or more of these risks or uncertainties materialize, or should any underlying assumptions prove to
be incorrect, the Company's actual financial condition or results of operations could differ materially from that or those described
herein as anticipated, believed, estimated or expected.
Any forward-looking information or statements in this presentation speak only as at the date of this presentation. Except as
required by the Oslo Stock Exchange rules or applicable law, the Company does not intend, and expressly disclaims any
obligation or undertaking, to publicly update, correct or revise any of the information included in this presentation, including
forward-looking information and statements, whether to reflect changes in the Company's expectations with regard thereto or as
a result of new information, future events, changes in conditions or circumstances or otherwise on which any statement in this
presentation is based.
Given the aforementioned uncertainties, prospective investors are cautioned not to place undue reliance on any of these forward-
looking statements.
29You can also read