LABOR MARKET NEWS MICHIGAN'S
←
→
Page content transcription
If your browser does not render page correctly, please read the page content below

MICHIGAN’S
LABOR MARKET NEWS
                                      VOL. 76, NO. 11
                                      JANUARY 2021

Employment Trends in Michigan’s
Manufacturing Sector
Feature Article pg. 16

Map of the Month: Net Change
in Manufacturing Jobs by State,
February–November 2020
pg. 15

Ask the Economist: What Are Some of
Data Spotlight:
the Ways LaborMonthly
                Demand Retail Sales
                       is Measured?
pg. 26
TABLE OF CONTENTS
            The Michigan jobless rate
            rose by 0.8 percentage
            points in November to 6.9                                                                      4         Michigan Employment and Unemployment Trends
            percent, slightly above the                                                                    6         Michigan Job Trends by Industry Sector
            national rate.
                                                                                                          10         Regional Labor Market Analysis
            NOVEMBER 2020 JOBLESS RATE
                                                                                                          15         Map of the Month: Net Change in Manufacturing
                                                                                                                     Jobs by State, February–November 2020
            MICHIGAN

            6.9%
                                                                                                          16         Feature Article: Employment Trends in Michigan’s
                                                                                                                     Manufacturing Sector

                                                                                                          20         Industry Focus: Transportation Equipment
                                                                                                                     Manufacturing
            NATIONAL

            6.7%
                                                                                                          22         Online Job Advertisements

                                                                                                          24         Relevant Rankings

                                                                                                          26         Data Spotlight: Monthly Retail Sales

                  HAILEY BARRUS                                                      SHIBANI PUTATUNDA                                                  TRISHA SCHLEGEL
                  DESIGNER                                                           CONTRIBUTOR                                                        CONTRIBUTOR
                  Communications Representative                                      Economic Specialist                                                Economic Analyst
                  barrush1@michigan.gov                                              putatundas@michigan.gov                                            schlegelt@michigan.gov

                  JIM BIRNEY                                                                                                                            ASHLEY TARVER
                                                                                     WAYNE ROURKE
                  CONTRIBUTOR                                                                                                                           CONTRIBUTOR
                                                                                     EDITOR
                                                                                                                                                        Demographic Analyst
                  Economic Analyst                                                   Associate Director
                                                                                                                                                        tarvera2@michigan.gov
                  birneyj@michigan.gov                                               rourkew@michigan.gov

                   EVAN LINSKEY                                                      DYLAN SCHAFER                                                      BRUCE WEAVER
                   CONTRIBUTOR                                                       CONTRIBUTOR                                                        CONTRIBUTOR
                   Economic Analyst                                                  Economic Analyst                                                   Economic Manager
                   linskeye@michigan.gov                                             schaferd9@michigan.gov                                             weaverb1@michigan.gov

IT’S BIGGER THAN DATA.

The Bureau of Labor Market Information and Strategic Initiatives is your one-stop shop for information and analysis on Michigan’s population, labor market, and more.

   ●   Our Federal-State Programs division runs the state’s cooperative agreements with the U.S. Bureau of Labor Statistics and the U.S. Census Bureau, making us the official
       source for this information.

   ●   Our Research and Evaluation division conducts workforce research and program evaluation, giving you the insight you need to make smarter decisions.
Michigan’s jobless rate advanced by eight-tenths of a percentage
point to 6.9 percent in November. Payroll jobs fell by 10,700, the first
monthly decline since April’s historic pandemic related job cuts. The
state’s workforce climbed by 30,000 with total employment falling by
14,000 and the number of unemployed rising by 43,000. Over the year,
Michigan’s unemployment rate was 3.0 percentage points greater than
in November 2019.

This issue of Michigan’s Labor Market News reviews one of the state’s
most critical industries, the Manufacturing sector, last featured in our
October 2018 issue. The Feature Article analyzes vehicle assembly,
exports, and of course the employment trends of this industry in recent
years as well as discussing 2020’s impact. Our Map of the Month
uses Current Employment Statistics data to display how each state’s
Manufacturing employment has changed between February and
November of 2020. There is also an Industry Focus highlighting the
Manufacturing subsector of Transportation equipment manufacturing
that provides interesting details about one of Michigan’s key industries.
Finally, our Data Spotlight explores monthly retail sales data using a
new experimental data set from the U.S. Bureau of Labor Statistics.

We hope you enjoy this issue of Michigan’s Labor Market News. Please
let us know if there is something you would like to know more about.

              SCOTT POWELL
              DIRECTOR
              Bureau of Labor Market Information and Strategic Initiatives
              powells6@michigan.gov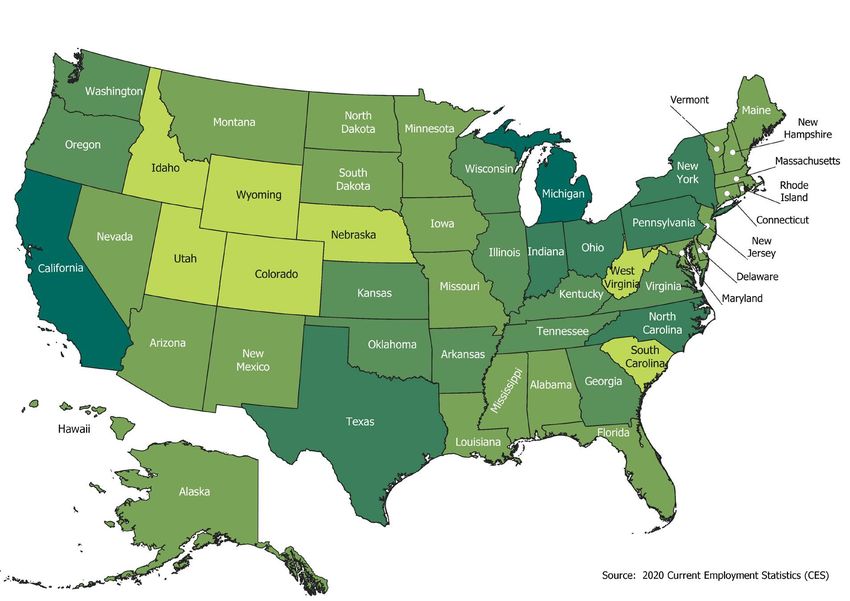
MICHIGAN JOBLESS RATE ADVANCES
   IN NOVEMBER
   The Michigan seasonally adjusted jobless rate                   about 80 percent since November 2019, while                    rate rose further during May to a record rate
   rose by eight-tenths of a percentage point in                   the U.S. unemployment total rose by a similar                  of 23.2 percent. The unemployment rate then
   November to 6.9 percent. The state’s October                    percent. Michigan’s total workforce edged down                 began to move downward, particularly in
   rate was revised upwards by six-tenths of a                     by 0.4 percent over the year, well under the                   June and July, as workers were recalled from
   percentage point, from 5.5 to 6.1 percent.                      reduction nationally (-2.4 percent).                           pandemic-related layoffs. The jobless rate
                                                                                                                                  declined in June by 5.3 percentage points to
   The U.S. unemployment rate edged down by
                                                                   Detroit Metro Region                                           17.9 percent, and then recorded the largest
   two-tenths of a percentage point in November
   to 6.7 percent. Michigan’s jobless rate in
                                                                   Unemployment Rate Surges                                       drop in July to 9.3 percent. Since July, the
                                                                                                                                  regional jobless rate has generally been
   November was 0.2 percentage points above the                    Over Year
                                                                                                                                  high but stable, and rose from 7.0 percent in
   national rate. Over the past year, the national                 The Detroit metropolitan statistical area (MSA)                October back to 9.3 percent in November.
   jobless rate advanced sharply by 3.2 percentage                 jobless rate surged substantially between
   points, while the state rate jumped by 3.0                      November 2019 and November of 2020, due                        So far through the first 11 months of 2020,
   percentage points, reflecting the impact of the                 to the considerable labor market impact of the                 the seasonally adjusted Detroit metro
   pandemic on labor market conditions.                            COVID-19 pandemic.                                             unemployment rate averaged 10.7 percent,
                                                                                                                                  somewhat above the Michigan average rate of
   Total employment in Michigan inched down by                     Between November 2019 and February of                          10.0 percent.
   0.3 percent in November. National employment                    2020, the Detroit MSA jobless rate was stable
   was essentially unchanged over the month.                       at roughly 4.0 percent. During March 2020, the
   The statewide number of unemployed rose                         early effects of the COVID-19 pandemic on the                  SHIBANI PUTATUNDA
   significantly by 14.4 percent in November, while                labor market began to be seen, with the jobless                Economic Specialist
   the U.S. unemployment total declined by 2.9                     rate rising from 3.9 to 4.6 percent, an increase
   percent over the month.                                         of 0.7 percentage points.

   Over the year, Michigan employment receded                      Mass layoff activity related to the pandemic
   by 3.6 percent, about two percentage points                     surged in April 2020, as the Detroit metro
   below the reduction nationally. The number of                   region unemployment rate soared by 16.9
   unemployed residents in Michigan jumped by                      percentage points to 21.5 percent. The jobless

     MICHIGAN UNEMPLOYMENT RATE, NOVEMBER 2019–NOVEMBER 2020 (PERCENT)

        25.0                                                                        24.0

        20.0

        15.0

        10.0
                                                                                                                                                                         6.9

         5.0

         0.0
                 NOV 19
                 Nov 19       DEC 19
                              Dec 19       JAN
                                            Jan 20      FEB
                                                        Feb 20       MAR  20
                                                                     Mar 20       APR 20
                                                                                  Apr 20      MAY 20
                                                                                              May 20       JUN 20
                                                                                                           Jun 20       JUL  20
                                                                                                                         Jul 20      AUG  20
                                                                                                                                     Aug 20       SEP 20
                                                                                                                                                  Sep 20      OCT  20
                                                                                                                                                              Oct 20    NOV  20
                                                                                                                                                                        Nov 20

    Source: Local Area Unemployment Statistics, Bureau of Labor Market Information and Strategic Initiatives, Department of Technology, Management & Budget

4 | STATE OF MICHIGAN | DEPARTMENT OF TECHNOLOGY, MANAGEMENT, AND BUDGET | BUREAU OF LABOR MARKET INFORMATION AND STRATEGIC INITIATIVES
MICHIGAN LABOR FORCE ESTIMATES, NOVEMBER 2020 (SEASONALLY ADJUSTED)
                                                                                                             OVER THE MONTH                               OVER THE YEAR
                                          NOVEMBER            OCTOBER            NOVEMBER
                                               2020               2020                2019
                                                                                                            NUMERIC            PERCENT                NUMERIC         PERCENT

   Civilian Labor Force                        4,923,000        4,893,000            4,941,000                   30,000               0.6%                 -18,000         -0.4%
      Employed                                 4,581,000        4,595,000            4,751,000                  -14,000              -0.3%                -170,000         -3.6%
      Unemployed                                 342,000          299,000              190,000                   43,000             14.4%                 152,000          80.0%
         Unemployment Rate                             6.9              6.1                  3.9                      0.8             XXX                      3.0             XXX

Source: Local Area Unemployment Statistics, Bureau of Labor Market Information and Strategic Initiatives, Department of Technology, Management & Budget

 DETROIT MSA UNEMPLOYMENT RATE, NOVEMBER 2019–NOVEMBER 2020

    25.0                                                                                    23.2

    20.0

    15.0

                                                                                                                                                                     9.3
    10.0

      5.0

      0.0
             NOV 19
             Nov 19       DEC 19
                          Dec 19       JAN 20
                                       Jan 20       FEB 20
                                                    Feb 20       MAR  20
                                                                 Mar 20       APR  20
                                                                              Apr 20      MAY20
                                                                                          May 20        JUN20
                                                                                                        Jun 20       JUL  20
                                                                                                                     Jul 20      AUG2020 Sep
                                                                                                                                 Aug     SEP20
                                                                                                                                             20            OCT
                                                                                                                                                           Oct 2020 Nov
                                                                                                                                                                     NOV2020

Source: Local Area Unemployment Statistics, Bureau of Labor Market Information and Strategic Initiatives, Department of Technology, Management & Budget

                                                                                                                               JANUARY 2021 | MICHIGAN'S LABOR MARKET NEWS | 5
MICHIGAN JOB TRENDS BY INDUSTRY SECTOR
   Monthly Overview                                               hospitality, (-5,000) and Education and health                 levels, on a seasonally adjusted basis. The
   Michigan payroll jobs edged down by 10,700                     services (-2,000). The largest over-the-month                  national job loss over this same period was
   since October, a 0.3 percent decrease. This                    changes in industry subsectors occurred in                     6.1 percent. The industries with the largest
   small reduction was the first decline in the                   Accommodation and food services (-5,500),                      percentage job cuts over the year in Michigan
   state’s nonfarm employment since jobs plunged                  and Federal government (-3,500). Though not                    were Leisure and hospitality (-33.0 percent),
   in April due to the pandemic. This also differed               large enough to offset job losses, five industries             Mining and logging (-13.5 percent), and Other
   from the nationwide November increase of                       registered monthly job gains, the largest                      services (-10.1 percent). No major industry
   0.2 percent. Employment change over the                        occurring in Other services (+1,900) and                       in Michigan recorded an over-the-year rise
   month in the state’s 11 major industry sectors                 Construction (+1,600) industries.                              in jobs, although Construction employment
   was mixed, with five showing increases, five                                                                                  was essentially flat. Finance and insurance
   recording decreases, and one remaining                         Over-the-Year Analysis                                         was the only industry in Michigan to indicate
   unchanged. Employment withdrawals were most                    Total nonfarm employment in Michigan declined                  no seasonally adjusted job change since
   notable in Government (-5,300), Leisure and                    418,800 or 9.4 percent below November 2019                     November 2019.

     MICHIGAN OVER-THE-MONTH PAYROLL JOB CHANGE, NOVEMBER 2019–NOVEMBER 2020 (IN THOUSANDS)

                                                                                                          266.3
                                                                                            170.8
                                                                                                                       101.5
           28.0                                                                                                                       55.0         22.8    17.0
                         6.7           1.3          10.9

                                                                 -38.7                                                                                              -10.7

                                                                             -1,021.7

          NOV19
         NOV           DEC19
                      DEC           JAN
                                   JAN 20         FEB
                                                FEB 20         MAR20
                                                              MAR            APR
                                                                            APR 20         MAY
                                                                                          MAY 20         JUN20
                                                                                                        JUN           JUL
                                                                                                                     JUL 20         AUG20
                                                                                                                                   AUG            SEP20
                                                                                                                                                 SEP       OCT20
                                                                                                                                                          OCT       NOV20
                                                                                                                                                                   NOV
          2019                                                                                                                                                     2020

   Source: Current Employment Statistics, Bureau of Labor Market Information and Strategic Initiatives, Department of Technology, Management & Budget

6 | STATE OF MICHIGAN | DEPARTMENT OF TECHNOLOGY, MANAGEMENT, AND BUDGET | BUREAU OF LABOR MARKET INFORMATION AND STRATEGIC INITIATIVES
MICHIGAN INDUSTRIES COMPARED
TO THE NATION                                                     MICHIGAN AND U.S. OVER-THE-YEAR EMPLOYMENT
The coronavirus pandemic caused employment                        CHANGE BY INDUSTRY
to fall in every major industry over the year in
both Michigan and the United States. Since                                                                                                                NOV 2019–NOV 2020
November 2019, total nonfarm payrolls jobs have                  MAJOR INDUSTRY
fallen in Michigan by 9.4 percent compared to the                                                                                                     MICHIGAN                       U.S.
U.S. which has only seen a drop of 6.1 percent.
                                                                 TOTAL NONFARM                                                                                -9.4%                  -6.1%
In Michigan, three industries had an over-the-                    Construction                                                                                -0.1%                  -2.4%
year employment decrease of 5 percent or                          Financial Activities                                                                        -2.6%                  -0.8%
less. The Construction; Financial activities; and
                                                                  Trade, Transportation, and Utilities                                                        -4.1%                  -3.2%
Trade, transportation, and utilities industries all
                                                                  Government                                                                                  -7.2%                  -5.4%
suffered much less employment withdrawal over
                                                                  Information                                                                                 -7.3%                  -9.0%
the year, likely due to their flexibility in adjusting
to work outdoors, performing duties remotely,                     Professional and Business Services                                                          -8.0%                  -4.6%
or conducting business online. These three                        Education and Health Services                                                               -8.1%                  -4.5%
industries were also the least impacted nationally.               Manufacturing                                                                              -10.0%                  -4.8%

                                                                  Other Services                                                                             -10.1%                  -7.0%
Jobs in four Michigan industries fell between
5.0 and 10.0 percent over the year. The                           Mining and Logging                                                                         -13.5%                 -13.8%
Government, Information, Professional and                         Leisure and Hospitality                                                                    -33.0%                 -19.9%
business services, and Educational and                         Source: Current Employment Statistics, Bureau of Labor Market Information and Strategic Initiatives, Department of
health services industries all had a greater                   Technology, Management & Budget

capacity to shift employees to a remote work
environment and did not need as much face-
to-face interaction to conduct work. While most                greatest impact. These industries primarily                     Significant Industry Employment
industries in Michigan had larger over-the-year                perform work indoors or though face-to-face
                                                                                                                               Developments
drops than the U.S., the Information sector was                interactions with customers. The employment
one of three industries where the employment                   reduction in these industries featured a                        CONSTRUCTION
drop was less severe in the state than on the                  similar impact nationally, with the exception                   The Construction industry’s seasonally adjusted
nationwide level, on a percentage basis.                       of the U.S. Manufacturing sector, which only                    employment posted the second highest percent
                                                               slid by 4.8 percent compared to Michigan’s                      and numeric employment growth in November,
With over-the-year employment drops of                         10.0 percent drop. The greater diversity                        behind only the Other services industry.
10.0 percent or greater, the Manufacturing,                    in manufactured products nationally likely                      Payroll jobs in the industry also appeared to
Other services, Mining and logging, and                        shielded the U.S. Manufacturing sector from                     be essentially flat over the year, the only major
Leisure and hospitality industries endured the                 deeper employment losses.                                       industry in Michigan to hold this distinction. From

  MICHIGAN OVER-THE-MONTH JOB CHANGE BY SELECT INDUSTRY, OCTOBER 2020–NOVEMBER 2020

                                  Construction                                                                                                                   1,600

       Trade, Transportation, and Utilities                                                                                  400

                          Financial Activities             -1,400

Source: Current Employment Statistics, Bureau of Labor Market Information and Strategic Initiatives, Department of Technology, Management & Budget

                                                                                                                                JANUARY 2021 | MICHIGAN'S LABOR MARKET NEWS | 7
METROPOLITAN AREA JOB CHANGE, OCTOBER 2020–NOVEMBER 2020 (NOT SEASONALLY ADJUSTED)

                 Battle Creek                                                                                                                           1.3%

                   Muskegon                                                                                                          0.7%

                      Saginaw                                                                                                 0.5%

                      Jackson                                                                                             0.4%

                        Detroit                                                                                 0.1%

               Grand Rapids                                                                                     0.1%

                      Lansing                                                                               0.0%

                    Ann Arbor                                                             -0.2%

                      Midland                                                         -0.3%

                     Michigan                                                         -0.3%

                           Flint                                                      -0.3%

              Benton Harbor                                                           -0.3%

                  Kalamazoo                                         -0.8%

                      Bay City                    -1.3%

                       Monroe       -1.7%

   Source: Current Employment Statistics, Bureau of Labor Market Information and Strategic Initiatives, Department of Technology, Management & Budget

   February to April, during the first few months                 FINANCIAL ACTIVITIES                                           small in November with either gains or losses
   of the coronavirus pandemic, the Construction                  Both of the subsectors in Financial activities                 registering less than 2.0 percent. The Battle
   industry in Michigan lost 84,000 jobs. Since then,             exhibited job losses in November. The Finance                  Creek MSA had the highest increase with a
   over 78,000 jobs have been recovered through                   and insurance subsector’s monthly reduction of                 1.3 percent uptick, while Monroe suffered the
   November. Most of those gains occurred in May                  300 jobs was the smaller of the two. As the only               greatest over-the-month job loss at 1.7 percent.
   and June. Construction employment stabilized to                industry to not have a seasonally adjusted over
   between 170,000 and 177,000 jobs since July.                                                                                  Similar to Michigan, all MSAs lost employment
                                                                  the year job decrease, the Finance and insurance
                                                                                                                                 since November 2019. On a percentage basis,
                                                                  sector’s November employment level of 170,000
   TRADE, TRANSPORTATION,                                                                                                        the most significant over-the-year reductions
                                                                  was still near its peak employment level in
   AND UTILITIES                                                                                                                 were in Monroe (-15.5 percent) and Bay
                                                                  February 2020 of 170,900. The Real estate
   Although employment in the Trade,                                                                                             City (-12.7 percent). Four other MSAs also
                                                                  and rental industry declined by 2.1 percent, tied
   transportation, and utilities sector recorded                                                                                 recorded year-over-year declines greater than
                                                                  for the second largest monthly job reduction of
   minimal movement, the subsectors within this                                                                                  10 percent. Ann Arbor’s 5.8 percent over-the-
                                                                  Michigan’s seasonally adjusted industries. This
   industry displayed notable trends in November.                                                                                year payroll job cut was the smallest among
                                                                  subsector‘s employment peaked at 59,000 in
   The Wholesale trade and Retail trade subsectors                                                                               Michigan’s metro areas.
                                                                  March 2020 before losing nearly 11,000 jobs in
   continued to be down significantly over the                    April. Through November, it has only recovered                 No MSA produced a rise in monthly
   year, by 4.5 and 5.1 percent, respectively. The                2,800 of those jobs and remained 13.7 percent                  employment in the Mining, logging, and
   11,200 job increase in Wholesale trade from                    below its peak employment.                                     construction industry. Most areas only had
   May to November crossed the halfway mark
                                                                                                                                 slight monthly job declines with the greatest
   to recovering the 20,100 jobs lost in April. In                Metropolitan Statistical Areas                                 numeric drops occurring in Detroit (-1,900 jobs)
   November, Retail trade recorded its first over-                (MSAs)                                                         and Grand Rapids (-600).
   the-month employment decline since April, losing
   3,300 jobs. The Transportation, warehousing,                   On a not seasonally adjusted basis, half of
   and utilities subsector had a significant over-the-            Michigan’s 14 Metropolitan Statistical Areas                   WAYNE ROURKE
   month gain of 2,600 jobs. This subsector’s job                 (MSAs) experienced payroll job growth and half                 Associate Director
   recovery remained strong and averaged over                     underwent an employment drop. The monthly
   2,500 additional jobs each month since August.                 employment change for all MSAs was relatively

8 | STATE OF MICHIGAN | DEPARTMENT OF TECHNOLOGY, MANAGEMENT, AND BUDGET | BUREAU OF LABOR MARKET INFORMATION AND STRATEGIC INITIATIVES
MICHIGAN PAYROLL JOBS (SEASONALLY ADJUSTED)
                                                            NOVEMBER               OCTOBER            NOVEMBER                 OVER THE MONTH                OVER THE YEAR
 INDUSTRY
                                                                 2020                  2020                2019                LEVEL       PERCENT           LEVEL      PERCENT

 TOTAL NONFARM                                                    4,023,800            4,034,500           4,442,600            -10,700              -0.3%   -418,800       -9.4%

 Total Private                                                    3,454,200            3,459,600           3,828,800              -5,400             -0.2%   -374,600       -9.8%

 Private Service-Providing                                        2,706,800            2,714,000           3,017,700              -7,200             -0.3%   -310,900      -10.3%

 GOODS-PRODUCING                                                    747,400              745,600             811,100              1,800              0.2%     -63,700       -7.9%

 Mining, Logging, and Construction                                  182,800              181,000             183,900              1,800              1.0%      -1,100       -0.6%

    Mining and Logging                                                6,400                6,200                7,400               200              3.2%      -1,000      -13.5%

    Construction                                                    176,400              174,800             176,500              1,600              0.9%       -100        -0.1%

 Manufacturing                                                      564,600              564,600             627,200                   0             0.0%     -62,600      -10.0%

    Durable Goods                                                   416,600              417,800             473,000              -1,200             -0.3%    -56,400      -11.9%

       Transportation Equipment Manufacturing                       160,500              159,900             186,800                600              0.4%     -26,300      -14.1%

    Non-Durable Goods                                               148,000              146,800             154,200              1,200              0.8%      -6,200       -4.0%

 SERVICE-PROVIDING                                                3,276,400            3,288,900           3,631,500            -12,500              -0.4%   -355,100       -9.8%

 Trade, Transportation, and Utilities                               765,900              765,500             798,900                400              0.1%     -33,000       -4.1%

    Wholesale Trade                                                 163,100              162,000             170,800              1,100              0.7%      -7,700       -4.5%

    Retail Trade                                                    439,000              442,300             462,400              -3,300             -0.7%    -23,400       -5.1%

    Transportation, Warehousing, and Utilities                      163,800              161,200             165,700              2,600              1.6%      -1,900       -1.1%

 Information                                                         50,900               50,800               54,900               100              0.2%      -4,000       -7.3%

 Financial Activities                                               220,900              222,300             226,900              -1,400             -0.6%     -6,000       -2.6%

    Finance and Insurance                                           170,000              170,300             170,000                -300             -0.2%         0        0.0%

    Real Estate and Rental and Leasing                               50,900               52,000               56,900             -1,100             -2.1%     -6,000      -10.5%

 Professional and Business Services                                 602,000              603,200             654,600              -1,200             -0.2%    -52,600       -8.0%

    Professional, Scientific, and Technical Services                287,100              285,900             297,900              1,200              0.4%     -10,800       -3.6%

    Management of Companies and Enterprises                          68,800               69,500               70,500               -700             -1.0%     -1,700       -2.4%

    Administrative and Support and Waste
                                                                    246,100              247,800             286,200              -1,700             -0.7%    -40,100      -14.0%
    Management and Remediation Services

 Education and Health Services                                      627,100              629,100             682,300              -2,000             -0.3%    -55,200       -8.1%

    Educational Services                                             57,100               58,200               74,500             -1,100             -1.9%    -17,400      -23.4%

    Health Care and Social Assistance                               570,000              570,900             607,800                -900             -0.2%    -37,800       -6.2%

 Leisure and Hospitality                                            290,700              295,700             434,100              -5,000             -1.7%   -143,400      -33.0%

    Arts, Entertainment, and Recreation                              29,400               28,900               53,400               500              1.7%     -24,000      -44.9%

    Accommodation and Food Services                                 261,300              266,800             380,700              -5,500             -2.1%   -119,400      -31.4%

 Other Services                                                     149,300              147,400             166,000              1,900              1.3%     -16,700      -10.1%

 Government                                                         569,600              574,900             613,800              -5,300             -0.9%    -44,200       -7.2%

    Federal Government                                               51,700               55,200               52,200             -3,500             -6.3%      -500        -1.0%

    State Government                                                174,600              177,100             194,400              -2,500             -1.4%    -19,800      -10.2%

    Local Government                                                343,300              342,600             367,200                700              0.2%     -23,900       -6.5%

Source: Current Employment Statistics, Bureau of Labor Market Information and Strategic Initiatives, Department of Technology, Management & Budget

                                                                                                                               JANUARY 2021 | MICHIGAN'S LABOR MARKET NEWS | 9
REGIONAL LABOR MARKET ANALYSIS
 ANN ARBOR METROPOLITAN AREA                                            BATTLE CREEK METROPOLITAN AREA
 • The November Ann Arbor jobless rate declined by 0.6                  • Joblessness in the Battle Creek region declined by 0.7
   percentage points to 3.4 percent. The Ann Arbor unemployment           percentage points this month to 5.2 percent.
   rate in November was the lowest among all Michigan major             • The number of unemployed persons in the area moved down
   labor market areas.                                                    400 in November but remained elevated (+1,200) over the year.
 • Although the monthly rate dropped, employment levels were            MONTHLY INDUSTRY DEVELOPMENTS
   little changed. The rate cut was primarily due to fewer persons      • Total payroll jobs in the Battle Creek MSA advanced by 700 or 1.3
   active in the area labor force (-1,100).                               percent since October.
 MONTHLY INDUSTRY DEVELOPMENTS                                          • Employment in most industry sectors stayed relatively flat in
 • In the Ann Arbor MSA, total nonfarm payroll jobs decreased             November, with the exception of Trade, transportation, and utilities
   by 400 or 0.2 percent over the month and fell by 5.8 percent           (+400) and Government (+300).
   since November 2019.
                                                                        INDUSTRY TRENDS
 INDUSTRY TRENDS                                                        • All sectors within the Battle Creek metro area lost jobs since
 • Regional job reductions within the Leisure and hospitality             November 2019 due primarily to pandemic-related job cuts. The
   (-600) and Professional and business services (-300) sectors           largest percent decline occurred in the Leisure and hospitality
   accounted for the largest share of the area’s November                 industry (-28.9 percent).
   employment decline.

                                                                        DETROIT-WARREN-DEARBORN METRO AREA
 BAY CITY METROPOLITAN AREA
                                                                        • The jobless rate in the Detroit region rose by 1.9 percentage
 • In November, the unemployment rate in the Bay City MSA                 points in November to 8.9 percent and was the only Michigan
   decreased slightly by 0.3 percentage points to 4.9 percent but         metro area to experience an increase in its unemployment rate
   remained 1.3 percentage points above the year-ago rate.                over the month.
 • The number of employed (-0.9 percent) and unemployed (-8.0           • The rate gain was due to a hike of 41,000 unemployed residents
   percent) residents declined this month which contributed to a          over the month. Since November 2019, a jump of 116,000
   labor force reduction of 500.                                          unemployed occurred due to the impact of the pandemic.
 MONTHLY INDUSTRY DEVELOPMENTS                                          MONTHLY INDUSTRY DEVELOPMENTS
 • Regional nonfarm payroll jobs moved down by 400 or 1.3               • In the Detroit MSA, total nonfarm payroll jobs were little changed
   percent in November, one percentage point more than the                over the month (+0.1 percent) and consequently remained well
   statewide rate of decline.                                             below (-9.3 percent) year-ago levels.
 INDUSTRY TRENDS                                                        • The Retail trade (+4,700), Transportation, warehousing, and
 • In November, a seasonal job cut in the Leisure and hospitality         utilities (+3,400), and Professional and technical services (+1,500)
   (-400) sector accounted for the bulk of job change in the region.      subsectors all recorded noteworthy job growth over the month.
                                                                        INDUSTRY TRENDS
                                                                        • The Financial activities sector moved down by 600 jobs (-0.5
                                                                          percent) in November, the largest numeric decline in this industry
 FLINT METROPOLITAN AREA                                                  among all Michigan metro areas.

 • The unemployment rate in the Flint region decreased by 0.8
   percentage points in November to 5.6 percent.
 • The rate drop primarily reflected a monthly cut in the size of the
   workforce (-1,700) as the number of unemployed declined and          GRAND RAPIDS-WYOMING METRO AREA
   the number of employed was little changed.                           • The Grand Rapids regional jobless rate fell by 0.5 percentage
                                                                          points this month to 3.7 percent, notably lower than the statewide
 MONTHLY INDUSTRY DEVELOPMENTS
                                                                          unemployment rate for November (6.3 percent).
 • Total payroll employment in the Flint MSA moved down by 400
   or 0.3 percent in November and fell a sharp 9.6 percent since        • The total number of unemployed persons in the region
   November 2019.                                                         decreased by 2,500 (-10.4 percent) over the month but was still up
                                                                          8,200 since November 2019.
 • A seasonal gain in Retail trade jobs (+300) in November was
   offset by employment declines in Professional and business           MONTHLY INDUSTRY DEVELOPMENTS
   services and Leisure and hospitality, both down by 300.              • In November, total jobs in the Grand Rapids region edged up
                                                                          very slightly by 700 (+0.1 percent), and dropped significantly by
 INDUSTRY TRENDS
                                                                          7.0 percent over the year, reflecting pandemic-related layoffs.
 • Area Transportation equipment manufacturing jobs
   have remained near 10-year high levels for the third                 INDUSTRY TRENDS
   consecutive month.                                                   • Job gains in November were concentrated in the Retail sector
                                                                          (+700), due to seasonal hiring for the holiday shopping season,
                                                                          and in Health care and social assistance (+800).
CIVILIAN LABOR FORCE AND NONFARM PAYROLL JOBS
ANN ARBOR BATTLE CREEK BAY CITY
NOV OCT NOV NOV OCT NOV NOV OCT NOV
2020 2020 2019 2020 2020 2019 2020 2020 2019
PLACE OF RESIDENCE
Civilian Labor Force 200,800 201,900 202,000 60,800 60,700 62,700 47,200 47,700 49,900
Employed 194,000 193,800 197,600 57,600 57,100 60,700 44,900 45,300 48,100
Unemployed 6,800 8,000 4,400 3,200 3,600 2,000 2,300 2,500 1,800
Unemployment Rate 3.4% 4.0% 2.2% 5.2% 5.9% 3.2% 4.9% 5.2% 3.6%
PLACE OF WORK
Total Nonfarm Jobs 221,300 221,700 235,000 52,600 51,900 58,700 30,900 31,300 35,400
Mining, Logging, and Construction 4,600 4,700 5,100 1,600 1,600 1,800 1,300 1,400 1,400
Manufacturing 14,200 14,000 14,800 9,700 9,700 11,300 3,300 3,300 4,700
Trade, Transportation, and Utilities 26,200 26,000 27,000 9,300 8,900 9,500 7,300 7,200 7,600
Wholesale Trade 6,200 6,200 6,600 * * * * * *
Retail Trade 15,700 15,600 16,100 6,000 5,800 6,100 4,600 4,500 4,900
Information 5,500 5,500 5,700 * * * 300 300 300
Financial Activities 6,500 6,600 6,800 1,100 1,100 1,200 1,200 1,200 1,300
Professional and Business Services 27,800 28,100 31,400 5,300 5,200 6,000 2,100 2,100 2,400
Educational and Health Services 28,300 28,200 30,200 10,000 10,000 10,900 6,000 6,000 6,600
Leisure and Hospitality 13,100 13,700 18,000 3,200 3,300 4,500 3,200 3,600 4,200
Other Services 5,900 5,900 6,300 1,800 1,800 2,100 1,100 1,100 1,200
Government 89,200 89,000 89,700 10,300 10,000 11,100 5,100 5,100 5,700
DETROIT-WARREN-
FLINT GRAND RAPIDS-WYOMING
DEARBORN
NOV OCT NOV NOV OCT NOV NOV OCT NOV
2020 2020 2019 2020 2020 2019 2020 2020 2019
PLACE OF RESIDENCE
Civilian Labor Force 2,174,000 2,143,000 2,157,000 178,800 180,500 183,900 574,800 577,600 579,700
Employed 1,981 1,992 2,081 168,800 169,000 177,000 553,300 553,600 566,400
Unemployed 192 151 76 10,000 11,500 6,900 21,500 24,000 13,300
Unemployment Rate 8.9% 7.0% 3.5% 5.6% 6.4% 3.7% 3.7% 4.2% 2.3%
PLACE OF WORK
Total Nonfarm Jobs 1,865,600 1,862,900 2,057,300 130,700 131,100 144,500 529,100 528,400 569,100
Mining, Logging, and Construction 74,700 76,600 77,000 5,700 5,700 6,000 27,500 28,100 26,800
Manufacturing 231,700 231,600 258,800 11,700 11,700 14,100 105,200 105,000 117,900
Trade, Transportation, and Utilities 369,500 360,600 392,200 29,800 29,500 30,200 92,800 91,800 98,200
Wholesale Trade 79,900 79,100 84,900 5,700 5,700 5,900 29,800 29,700 32,400
Retail Trade 202,400 197,700 215,600 19,700 19,500 19,700 45,600 44,900 48,700
Information 25,400 25,300 26,500 3,100 3,100 3,600 6,100 6,000 6,400
Financial Activities 116,300 116,900 120,500 5,700 5,700 6,100 26,700 26,700 26,900
Professional and Business Services 371,000 370,900 394,000 16,100 16,400 17,400 72,600 72,300 76,400
Educational and Health Services 283,100 282,500 323,000 24,200 24,200 27,100 90,200 89,300 95,200
Leisure and Hospitality 139,600 144,500 195,700 12,400 12,700 15,600 39,100 40,300 48,400
Other Services 71,400 70,400 74,800 5,100 5,100 5,300 21,400 21,300 22,700
Government 182,900 183,600 194,800 16,900 17,000 19,100 47,500 47,600 50,200
Source: Current Employment Statistics and Local Area Unemployment Statistics, Bureau of Labor Market Information and Strategic Initiatives, Department of Technology, Management & Budget
* Data is suppressed
JANUARY 2021 | MICHIGAN'S LABOR MARKET NEWS | 11JACKSON METROPOLITAN AREA KALAMAZOO-PORTAGE METRO AREA
• In the Jackson metro area, the unemployment rate declined by • In November, the Kalamazoo MSA unemployment rate
0.6 percentage points to 4.6 percent in November. decreased by 0.4 percentage points to 4.1 percent but was
still up 1.3 percentage points over its year-ago rate.
• Regional labor force in November remained relatively
unchanged over the month (-0.3 percent), as there were • The monthly rate drop was due to a labor force reduction of
only minor changes in the number of employed (+200) and 2,300 or 1.4 percent, as the number of employed residents
unemployed (-400). actually fell in November (-1,500).
MONTHLY INDUSTRY DEVELOPMENTS MONTHLY INDUSTRY DEVELOPMENTS
• Total nonfarm payroll jobs edged up by 200 or 0.4 percent in • Kalamazoo metro area payroll jobs decreased by 1,200 or 0.8
November in the Jackson MSA. percent over the month.
• Job levels in most area sectors remained unchanged over • Leisure and hospitality jobs declined by 1,600 or 9.9 percent in
the month, as a job advance was concentrated in Trade, November, which was the third largest percent reduction for this
transportation, and utilities (+200). industry among Michigan metro areas.
INDUSTRY TRENDS INDUSTRY TRENDS
• Payroll employment in the region was down significantly by • Over the year, the Manufacturing (-2,600) and Government
8.0 percent (-4,700) since November 2019, although this job (-2,400) industry sectors recorded the largest numeric job cuts
drop was somewhat less than the over-the-year statewide in this metro area.
rate of decline (-9.3 percent).
MIDLAND METROPOLITAN AREA
LANSING-EAST LANSING METRO AREA • The jobless rate in the Midland region decreased by 0.4
• Joblessness in the Lansing metro area moved down by 0.6 percentage points to 3.8 percent, ranking as the third lowest
percentage points to 3.9 percent in November. unemployment rate among major labor markets in Michigan.
• Despite this monthly rate drop, the number of employed was • Total workforce in the area remained down both over the
little changed over the month. The rate reduction instead month (-0.8 percent) and over the year (-2.2 percent).
reflected fewer persons active in the regional job market, as MONTHLY INDUSTRY DEVELOPMENTS
the unemployment count declined by 1,400 or 13.0 percent. • In November, total payroll jobs in the Midland metro area
MONTHLY INDUSTRY DEVELOPMENTS (34,900) remained nearly unchanged (-100).
• Lansing area payroll job levels were virtually unchanged in INDUSTRY TRENDS
November (+100), and fell sharply by 10.9 percent over the • Payroll jobs in the region still show the significant impact
year, reflecting pandemic-related job cuts. of pandemic-related reductions, with a sharp drop of 2,700
INDUSTRY TRENDS positions since November 2019.
• Typical seasonal job expansion occurred within the Trade,
transportation, and utilities (+800) sector this month, which
pushed total jobs in this industry to 34,400 in November.
MUSKEGON METROPOLITAN AREA
• The Muskegon regional jobless rate fell by 0.7 percentage
points in November to 6.4 percent, nearly matching the
MONROE METROPOLITAN AREA statewide unemployment rate for the month.
• The jobless rate in the Monroe labor market fell by 1.1
• Over the year, the labor force was down 1,800 (-2.3 percent),
percentage points in November to 4.2 percent. This was the
due mainly to a pandemic-related decline in the number of
largest over-the-month rate decline among all Michigan major
employed persons in the area (-3,800).
labor market areas.
MONTHLY INDUSTRY DEVELOPMENTS
• This large monthly rate cut was due to a November drop
• Muskegon metro area job levels increased by 400 or 0.7
in the civilian labor force, as the number of employed and
percent over the month, despite the monthly reduction in jobs
unemployed residents both fell by 300 and 800, respectively.
statewide (-0.3 percent).
MONTHLY INDUSTRY DEVELOPMENTS
INDUSTRY TRENDS
• Regional payroll jobs in Monroe moved down by 600 or
• The Service providing sector recorded the entirety of area
1.7 percent since last month. This was the largest percent
job growth in November, rising by 0.9 percent due mainly to
decline among all Michigan metro areas in November.
an increase in employment in the Trade, transportation, and
INDUSTRY TRENDS utilities industry (+500).
• Only two major industry sectors added jobs this month; Trade,
transportation, and utilities (+200) and Manufacturing (+100),
as total nonfarm payroll jobs remained 15.5 percent lower than
year-ago levels.
12 | STATE OF MICHIGAN | DEPARTMENT OF TECHNOLOGY, MANAGEMENT, AND BUDGET | BUREAU OF LABOR MARKET INFORMATION AND STRATEGIC INITIATIVESCIVILIAN LABOR FORCE AND NONFARM PAYROLL JOBS
JACKSON KALAMAZOO-PORTAGE LANSING-EAST LANSING
NOV OCT NOV NOV OCT NOV NOV OCT NOV
2020 2020 2019 2020 2020 2019 2020 2020 2019
PLACE OF RESIDENCE
Civilian Labor Force 73,000 73,200 74,200 167,800 170,100 170,000 241,000 242,500 253,200
Employed 69,600 69,400 72,000 160,900 162,400 165,300 231,600 231,700 246,800
Unemployed 3,400 3,800 2,200 6,900 7,700 4,700 9,400 10,800 6,400
Unemployment Rate 4.6% 5.2% 3.0% 4.1% 4.5% 2.8% 3.9% 4.5% 2.5%
PLACE OF WORK
Total Nonfarm Jobs 53,800 53,600 58,500 141,900 143,100 153,000 217,100 217,000 243,700
Mining, Logging, and Construction 2,200 2,300 2,000 6,800 6,900 6,500 7,400 7,600 8,300
Manufacturing 8,400 8,400 9,400 20,700 20,800 23,300 16,400 16,300 19,100
Trade, Transportation, and Utilities 10,800 10,600 12,300 24,400 24,100 26,500 34,400 33,600 37,300
Wholesale Trade * * * 5,800 5,800 6,200 6,000 5,900 6,400
Retail Trade 6,200 6,200 6,500 14,300 14,100 16,100 20,600 20,100 22,400
Information 200 200 200 600 600 700 2,900 2,900 2,900
Financial Activities 2,200 2,200 2,200 8,100 8,100 8,100 16,600 16,700 17,100
Professional and Business Services 6,000 6,000 6,200 17,900 17,900 18,400 25,000 24,500 25,300
Educational and Health Services 9,300 9,200 10,300 23,200 23,400 25,500 30,400 30,200 33,000
Leisure and Hospitality 4,400 4,500 5,200 14,600 16,200 15,700 14,700 15,900 18,900
Other Services 2,400 2,400 2,600 4,900 4,900 5,200 9,100 9,100 10,100
Government 7,900 7,800 8,100 20,700 20,200 23,100 60,200 60,200 71,700
MIDLAND MONROE MUSKEGON
NOV OCT NOV NOV OCT NOV NOV OCT NOV
2020 2020 2019 2020 2020 2019 2020 2020 2019
PLACE OF RESIDENCE
Civilian Labor Force 39,200 39,500 40,100 71,500 72,600 75,800 75,400 75,700 77,200
Employed 37,700 37,800 38,900 68,500 68,800 73,600 70,600 70,300 74,400
Unemployed 1,500 1,600 1,200 3,000 3,800 2,200 4,800 5,400 2,800
Unemployment Rate 3.8% 4.2% 3.0% 4.2% 5.3% 2.8% 6.4% 7.1% 3.6%
PLACE OF WORK
Total Nonfarm Jobs 34,900 35,000 37,600 35,400 36,000 41,900 57,800 57,400 64,900
Mining, Logging, and Construction * * * 1,700 1,900 1,900 2,800 2,900 2,600
Manufacturing * * * 4,800 4,700 5,700 11,600 11,500 13,800
Trade, Transportation, and Utilities * * * 10,000 9,800 10,800 13,700 13,200 14,300
Wholesale Trade * * * 1,700 1,700 1,700 * * *
Retail Trade * * * 4,300 4,200 4,900 10,400 10,300 11,500
Information * * * * * * 200 200 300
Financial Activities * * * 900 900 900 1,700 1,700 1,800
Professional and Business Services * * * 4,400 4,600 5,800 3,700 3,700 3,700
Educational and Health Services * * * 4,500 4,500 5,000 10,400 10,500 11,900
Leisure and Hospitality * * * 2,500 3,000 4,400 5,000 5,200 7,300
Other Services * * * 1,300 1,300 1,500 1,700 1,700 2,000
Government 3,100 3,200 3,000 5,000 5,000 5,500 7,000 6,800 7,200
Source: Current Employment Statistics and Local Area Unemployment Statistics, Bureau of Labor Market Information and Strategic Initiatives, Department of Technology, Management & Budget
* Data is suppressed
JANUARY 2021 | MICHIGAN'S LABOR MARKET NEWS | 13NILES-BENTON HARBOR METRO AREA SAGINAW METROPOLITAN AREA
• Joblessness in the Niles-Benton Harbor MSA moved down by • The unemployment rate in the Saginaw MSA decreased by
0.5 percentage points to 4.7 percent this month. 0.5 percentage points this month to 5.4 percent, about a full
percentage point below the statewide rate in November.
• This rate reduction reflected fewer persons in the regional labor
force (-1.0 percent), as both the number of employed (-300) • Workforce in the metro area remained flat over the month and
and the number of unemployed (-400) fell in November. was down sharply by 2,800 or 3.2 percent over the year.
MONTHLY INDUSTRY DEVELOPMENTS MONTHLY INDUSTRY DEVELOPMENTS
• Regional payroll jobs in the Niles-Benton Harbor metro area • In the Saginaw region, total payroll jobs rose by 400 or 0.5
edged down slightly by 200 or 0.3 percent in November. percent in November but were still down by 9.9 percent over
the year.
• Jobs in the Manufacturing sector remained unchanged both
over the month and over the year, with an employment level • Retail trade jobs advanced seasonally by 400 or 3.7 percent
of 13,000. in November, reflecting hiring for the holiday shopping season.
This was the largest monthly percent job gain in this industry
INDUSTRY TRENDS
among Michigan metro areas.
• Jobs in only two major industry sectors rose in November,
including Trade, transportation, and utilities (+300) and INDUSTRY TRENDS
Government (+100). • Payroll jobs plunged by 8,800 due to pandemic-related layoffs
since November 2019, and jobs were down over the year in all
sectors except Wholesale trade and Federal government.
CIVILIAN LABOR FORCE AND NONFARM PAYROLL JOBS
NILES-BENTON HARBOR SAGINAW
NOV OCT NOV NOV OCT NOV
2020 2020 2019 2020 2020 2019
PLACE OF RESIDENCE
Civilian Labor Force 72,200 72,900 72,800 83,900 83,900 86,700
Employed 68,800 69,100 70,600 79,400 79,000 83,400
Unemployed 3,400 3,800 2,300 4,500 4,900 3,300
Unemployment Rate 4.7% 5.2% 3.1% 5.4% 5.9% 3.8%
PLACE OF WORK
Total Nonfarm Jobs 58,200 58,400 62,600 79,700 79,300 88,500
Mining, Logging, and Construction 2,800 2,900 2,600 2,900 3,000 3,200
Manufacturing 13,000 13,000 13,000 10,600 10,600 11,900
Trade, Transportation, and Utilities 10,100 9,800 10,700 15,800 15,300 17,500
Wholesale Trade * * * 1,900 1,900 1,900
Retail Trade 6,100 6,000 6,900 11,200 10,800 12,700
Information 400 400 500 1,000 1,000 1,200
Financial Activities 2,400 2,400 2,500 3,600 3,600 3,700
Professional and Business Services 5,400 5,400 5,500 10,400 10,300 11,600
Educational and Health Services 9,200 9,300 9,600 14,700 14,700 16,000
Leisure and Hospitality 5,100 5,500 7,100 7,100 7,300 8,800
Other Services 2,000 2,000 2,300 3,100 3,100 3,200
Government 7,800 7,700 8,800 10,500 10,400 11,400
UPPER PENINSULA NORTHEAST MICHIGAN NORTHWEST MICHIGAN
NOV OCT NOV NOV OCT NOV NOV OCT NOV
2020 2020 2019 2020 2020 2019 2020 2020 2019
PLACE OF RESIDENCE
Civilian Labor Force 138,000 140,000 135,200 79,500 80,500 79,900 152,500 154,900 146,900
Employed 132,100 134,100 129,600 75,100 76,300 75,800 146,200 148,300 142,000
Unemployed 5,900 5,900 5,600 4,300 4,300 4,100 6,300 6,600 5,000
Unemployment Rate 4.2% 4.2% 4.1% 5.5% 5.3% 5.1% 4.1% 4.2% 3.4%
Source: Current Employment Statistics and Local Area Unemployment Statistics, Bureau of Labor Market Information and Strategic Initiatives, Department of Technology, Management & Budget
* Data is suppressed
14 | STATE OF MICHIGAN | DEPARTMENT OF TECHNOLOGY, MANAGEMENT, AND BUDGET | BUREAU OF LABOR MARKET INFORMATION AND STRATEGIC INITIATIVESMAP OF THE MONTH:
NET CHANGE IN MANUFACTURING JOBS BY STATE,
FEBRUARY–NOVEMBER 2020
Net Change in Jobs (In Thousands)
Source: 2020 Current Employment Statistics, Bureau
of Labor Market Information and Strategic Initiatives,
Department of Technology, Management & Budget
The pandemic has resulted in job loss across of February and November 2020, the map February, and Michigan reported 56,000 fewer
all industries, and Manufacturing was no provides a snapshot of the degree of job change Manufacturing jobs in over the same time
exception. During the months of March and in this industry across states. period. So far in 2020, April was the low point in
April, temporary layoffs caused a reduction of Manufacturing jobs, and Michigan registered the
1.4 million Manufacturing jobs nationally. Since Most states have recorded significant cuts in largest percent job cut from April 2019 to April
then, workers have been recalled to jobs in Manufacturing employment due to the pandemic, 2020 among states, a plunge of 29.8 percent.
this industry, but U.S. Manufacturing jobs in but some states have added jobs over this
November remained over 500,000 below the pre- period. Idaho, Wyoming, Nebraska, Colorado, Reference:
pandemic February level (BLS 2020). Utah, West Virginia, and South Carolina reported Bureau of Labor Statistics. 2020. “Current
a higher number of Manufacturing positions in Employment Statistics Highlights: November
Over the past 10 months, each state has November than the pre-pandemic February level. 2020.” U.S. Department of Labor.
followed a unique trajectory toward economic
recovery, and this has resulted in a wide degree California and Michigan were the hardest hit
of variance in the net change in Manufacturing in terms of the amount of Manufacturing job ASHLEY TARVER
jobs across states during 2020. Using Current reductions. Through November, California Demographic Analyst
Employment Statistics data for the months had 85,000 fewer jobs in this industry than in
JANUARY 2021 | MICHIGAN'S LABOR MARKET NEWS | 15EMPLOYMENT TRENDS IN MICHIGAN’S
MANUFACTURING SECTOR
The Manufacturing sector has continued How Recessions Have Affected responsible for the production and assembly
to be a staple of both Michigan and the
Michigan’s Manufacturing Sector of motor vehicles and motor vehicle parts.
U.S. economy, even throughout economic Payroll job levels in both the Machinery sector
downturns. Contributing over 12.8 million jobs, In March 2001, the nation experienced a and Furniture and related products sector also
the Manufacturing sector plays a significant short period of economic downturn, resulting saw notable declines during this time, falling
role in the United States, making up nearly in significant job losses in the Manufacturing by 19,500 and 11,800, respectively.
8.5 percent of the nearly 151 million total sector. In the year prior to the start of
nonfarm jobs in 2019. Due to the abundance the recession, Michigan’s Manufacturing Even after a period of constant decline from
of auto production firms in Michigan, the employment peaked at 886,400. By 2001, 2001 until 2007, the Manufacturing sector
Manufacturing sector plays an even greater the sector’s employment levels had fallen was not yet showing signs of recovery.
role than seen nationally. Manufacturing to 811,800. In subsequent years, the During the Great Recession from December
accounted for over 627,200 or 14.1 percent Manufacturing sector would continue to see a 2007 to June 2009, the industry lost 152,700
of all employment in Michigan. Over the last gradual decline in job levels. additional jobs, dropping to its lowest point of
two decades, the Manufacturing sector has 455,100 jobs in 2009. The largest losses were
After having never fully recovered from the
seen large changes in employment as a result again within the Transportation equipment
2001 recession, the sector was hit again at the
of productivity changes, economic downturns manufacturing sector, where job levels fell by
start of the Great Recession in 2007, where
and the recent pandemic. This article provides 74,000 during this period.
employment in the sector had since fallen to
information on job trends in the Michigan
607,800. From 2001 to 2007, a large majority It was not until 2010 when the Manufacturing
Manufacturing sector and additional analysis
of job losses were seen in the Transportation sector began to show signs of recovery
on how the sector has been impacted by the
equipment sector (-114,500), which is after the end of the Great Recession. Due
COVID-19 pandemic.
16 | STATE OF MICHIGAN | DEPARTMENT OF TECHNOLOGY, MANAGEMENT, AND BUDGET | BUREAU OF LABOR MARKET INFORMATION AND STRATEGIC INITIATIVESFIGURE 1: MANUFACTURING JOBS IN MICHIGAN, 2000–2019
1,000,000
900,000
811,800
800,000
700,000
627,200
607,800
600,000
455,100
500,000
400,000
300,000
200,000
2000 2001 2002 2003 2004 2005 2006 2007 2008 2009 2010 2011 2012 2013 2014 2015 2016 2017 2018 2019
Source: Current Employment Statistics, Bureau of Labor Market Information and Strategic Initiatives, Department of Technology, Management & Budget
to restructuring and a general shift within the end of the Great Recession in July 2009 one percent. As of November, employment in
Michigan’s Manufacturing sector, from 2009 when the sector employed 432,800. Over the the Transportation equipment manufacturing
until 2019, sector jobs rose by 37.8 percent next few months, some businesses began subsector was still 12.7 percent below pre-
(+172,100 jobs). By 2017, the sector had to reopen showing rising employment levels pandemic February levels, though jobs had
experienced enough growth to exceed job throughout the industry. substantially recovered from April employment
levels last recorded in 2007. Job levels lows. Primary metal manufacturing was one
The Transportation equipment manufacturing
stabilized from 2018 to 2019, with a small subsector with minimal job recovery so far, as
subsector was the most impacted by the
reported decline of 1,400 over the year. jobs in November remained slightly lower than
coronavirus with employment levels declining
April’s levels.
by 49.5 percent from February (189,200)
The Impact of the Pandemic to April (95,600). Other subsectors like Total nonfarm jobs in Michigan declined by
In March of 2020, Michigan had taken action Fabricated metal product manufacturing 23.1 percent from 4,407,600 in February to
to slow the spread of COVID-19, which (-33.4 percent) and Plastics and rubber 3,391,200 in April. The Manufacturing sector
meant the temporary closing of businesses products manufacturing (-30.8 percent) also was not the only industry to record major job
and nonessential services. The shutdown saw notable job reductions during this period. cuts during this period. Other sectors including
affected the state’s automakers as well, Some subsectors in Manufacturing were Leisure and hospitality (-58.1 percent), Mining,
when on March 18th, the Detroit automakers not as heavily affected by the pandemic, logging and construction (-42.8 percent),
suspended most operations. such as Food manufacturing and Chemical and Other services (-34.3 percent) were also
manufacturing, which registered a 5.8 percent initially impacted by pandemic-related layoffs
According to the Current Employment and 7.7 percent job cut, respectively. in April (LMISI 2000–2020) .
Statistics (CES) program, in February
2020, before the start of the pandemic, the Since the low point in April, the sector
Manufacturing sector supplied 621,600 jobs. has shown signs of returning to prior Vehicles Assembled and Sold
As additional precautions were being taken employment counts. Though still not to pre- According to the U.S. Bureau of Economic
to prevent the spread of the coronavirus, pandemic levels by November, payroll jobs Analysis (BEA), in February of 2020, there
temporary layoffs in April resulted in a rose by 28.2 percent or 565,600. Most of were 221,900 vehicles assembled nationally.
plunge of jobs in the industry of 29 percent Manufacturing’s subsectors had jobs that were As the pandemic began to cause employment
to 441,200. That was the lowest employment still below February levels, apart from Food levels to plummet in many key industries in
level in Michigan’s Manufacturing sector since manufacturing, which has since increased by late March, vehicle assembly began to drop
JANUARY 2021 | MICHIGAN'S LABOR MARKET NEWS | 17FIGURE 2: MICHIGAN MANUFACTURING SUBSECTOR JOB CHANGE (NOT SEASONALLY ADJUSTED)
INDUSTRY FEBRUARY 2020 APRIL 2020 NOVEMBER 2020
MANUFACTURING 621,600 441,200 565,600
Transportation Equipment Manufacturing 189,200 95,600 165,100
Fabricated Metal Product Manufacturing 78,500 52,300 67,900
Machinery Manufacturing 71,000 56,800 67,300
Plastics and Rubber Products Manufacturing 42,800 29,600 36,200
Food Manufacturing 38,100 35,900 38,500
Chemical Manufacturing 31,300 28,900 29,800
Furniture and Related Product Manufacturing 23,600 17,700 20,900
Primary Metal Manufacturing 21,800 15,800 15,300
Computer and Electronic Product Manufacturing 21,000 19,100 18,700
Printing and Related Support Activities 13,400 10,300 11,600
Source: Current Employment Statistics, Bureau of Labor Market Information and Strategic Initiatives, Department of Technology, Management & Budget
significantly. By April, vehicle assembly fell value is down from second quarter 2019 when firms, both small and large, began to retool
by 99.2 percent since February to just 1,800 Manufacturing’s share of Michigan’s real facilities to transition to the production of PPE.
as most auto manufacturers had nearly GDP was 19.1 percent. The sector is typically Michigan’s manufacturers gained national
halted production. In comparison, in April of considered highly cyclical, making it often one attention for their efforts to quickly expand
2019, the number of vehicles assembled was of the first affected by an economic downturn, production efforts to meet demand.
212,100. which due to the current pandemic, resulted
in a lower contribution to the state’s GDP Though still in the midst of an ongoing
As manufacturing facilities slowly began to in 2020. Nationally, the industry accounted pandemic, the Manufacturing sector has
resume production, vehicle assemblies started for 11.3 percent of real GDP in the second taken steps to reopen many of their facilities.
to increase. By July, the number of vehicles quarter of 2020, down from 11.6 a year before. Michigan’s Manufacturing sector jobs have not
assembled nationally rose to 178,300, which yet returned to pre-pandemic levels, but the
was a gain of 2.6 percent over the prior year. In 2019, Michigan was ranked sixth among all industry appears to be showing improvement.
In recent months, the number of vehicles other states in value of manufactured goods
assembled had remained close to 2019 levels exports, with exports exceeding $53.1 billion. Future Trends
through October, as the number of vehicles Manufactured exports in the state decreased According to 2018–2028 long-term
assembled was 209,300 compared to 212,700 by nearly $2.3 billion or 4.1 percent since employment projections by Michigan’s Bureau
in 2019. 2018. Nationally, manufactured goods exports of Labor Market Information and Strategic
exceeded $1.36 trillion, down 2.5 percent from Initiatives, Michigan’s employment is expected
Domestic auto sales of vehicles assembled in
the $1.39 trillion in 2018 (BEA 2020). to see little growth in the coming years.
the U.S., Canada, and Mexico were far less
Manufacturing is projected to see an overall
affected by the pandemic compared to vehicle Current Efforts decline of 1.9 percent by 2028 in the state,
assemblies at the start of the pandemic. In
To help prevent the spread of COVID-19 and equivalent to a loss of nearly 12,200 jobs
April, vehicle sales had fallen to 125,900 in
to keep employees safe, many of Michigan’s (LMISI 2020). It is important to note however,
the U.S., down 53.2 percent from February’s
manufacturers slowed or halted production of that long-term employment projections were
269,100 sales. Since then, vehicle sales have
manufactured goods in the early stages of the generated using 2018 data, and therefore do
steadily increased, although not to levels
pandemic. Manufacturers began to reassess not take into account the current COVID-19
equivalent to a year prior. In November,
their workplace health and safety standards by pandemic. It is not yet known what long-term
the number of vehicles sold was 209,500.
implementing new protocols and procedures effects the pandemic will have on the industry
That was a decline of 19.9 percent from the
to limit the spread of the virus once facilities and its job levels.
261,400 sold in November 2019.
opened again.
A majority of industries in the sector are
Real Gross Domestic Product and One approach to limit the spread of COVID-19 projected to decline with Fabricated metal
Export Trends was to provide employees with personal product manufacturing expected to see a loss
The Manufacturing sector contributes the protective equipment (PPE) such as face of 4,400 jobs, the greatest of any subsector.
greatest share to Michigan’s real Gross masks, face shields, gowns, and more. Transportation equipment manufacturing
Domestic Product (GDP) than any other With an increased demand for PPE by the and Printing and related support activities
industry. In the second quarter of 2020, the Healthcare industry and the public, the are other subsectors with notable expected
Manufacturing sector was responsible for demand quickly outpaced the supply. As a losses, with employment levels projected to
18.1 percent of the state’s real GDP. That result, many of Michigan’s manufacturing contract by 3,300 and 3,000, respectively. The
18 | STATE OF MICHIGAN | DEPARTMENT OF TECHNOLOGY, MANAGEMENT, AND BUDGET | BUREAU OF LABOR MARKET INFORMATION AND STRATEGIC INITIATIVESFIGURE 3: DOMESTIC VEHICLES ASSEMBLED AND SOLD
Vehicles Sold Vehicles Assembled
400,000
350,000
300,000
250,000
Number of Vehicles
200,000
150,000
100,000
50,000
0
June
June
April
May
April
May
January
January
March
September
October
July
August
March
September
October
July
August
February
November
December
February
November
2019 2020
Source: Supplemental Estimates, Motor Vehicles; U.S. Bureau of Economic Analysis, U.S. Department of Commerce
Miscellaneous manufacturing sector, which related products manufacturing subsectors. Bureau of Labor Market Information and
includes the manufacturing of jewelry, medical In recent years, the sector has shown notable Strategic Initiatives. 2020. “Long-term
equipment and more, is one of the few improvement but has never fully recovered Employment Projections, 2018–2028.”
industries in the sector projected to add jobs, from the jobs lost from 2000 to 2009. The Department of Technology, Management
with employment levels increasing by 5,100 or Manufacturing sector had been heavily & Budget.
19.3 percent during this time. affected in the early stages of the COVID-19
pandemic but has since recovered many of Burton, Jacob T., Gabriel M. Ehrlich, Donald R.
In a recent report from the University of the lost jobs. Though the number of jobs in Grimes, Michael R. McWilliams. Presented Nov.
Michigan’s Research Seminar in Quantitative the industry are not at pre-pandemic levels, 20, 2020. “The Michigan Economic Outlook for
Economics (RSQE), the state’s Manufacturing the industry has continued to show recent 2021–2022.” Research Seminar in Quantitative
sector is projected to lose 64,400 jobs gains in terms of jobs, the number of vehicles Economics (RSQE). University of Michigan.
in 2020. These losses are a result of an assembled, and vehicle sales.
expected decline in light vehicle sales and DYLAN SCHAFER
the shutdowns of manufacturing plants. With References: Economic Analyst
vehicle sales expected to be reasonable over
Bureau of Labor Market Information and
the next two years, RSQE is forecasting that
Strategic Initiatives. 2000–2020. “Current
the sector will recover 31,500 jobs in 2021 and
Employment Statistics (CES).” Michigan
another 17,500 in 2022 (Burton et al. 2020).
Department of Technology, Management
Conclusion & Budget.
Michigan’s Manufacturing sector has U.S. Bureau of Economic Analysis. 2020.
experienced a series of job reductions since “Supplemental Estimates, Motor Vehicles.”
2000 with job losses largely occurring in the U.S. Department of Commerce. (Accessed
Transportation equipment manufacturing, Dec. 23, 2020)
Machinery manufacturing, and Furniture and
JANUARY 2021 | MICHIGAN'S LABOR MARKET NEWS | 19You can also read