LABORATORY EXPERIMENT ON THE NANO-TIO2 PHOTOCATALYTIC DEGRADATION EFFECT OF ROAD SURFACE OIL POLLUTION
←
→
Page content transcription
If your browser does not render page correctly, please read the page content below
Nanotechnology Reviews 2020; 9: 922–933
Research Article
Qing’e Wang, Kai Zheng, Huanan Yu*, Luwei Zhao, Xuan Zhu, and Junqian Zhang
Laboratory experiment on the nano-TiO2
photocatalytic degradation effect of road
surface oil pollution
https://doi.org/10.1515/ntrev-2020-0072 Keywords: nano-TiO2, photocatalytic degradation, road
received August 27, 2020; accepted September 16, 2020 surface, oil pollutions, testing method
Abstract: Oil leak from vehicles is one of the most
common pollution types of the road. The spilled oil could
be retained on the surface and spread in the air voids of
the road, which results in a decrease in the friction 1 Introduction
coefficient of the road, affects driving safety, and causes
damage to pavement materials over time. Photocatalytic With the rapid development of transportation in China,
degradation through nano-TiO2 is a safe, long-lasting, the environmental problems associated with road traffic
and sustainable technology among the many methods for operation cannot be ignored [1,2]. In recent years,
treating oil contamination on road surfaces. In this study, frequent incidents of oil pollution occurring in traffic
the nano-TiO2 photocatalytic degradation effect of road operation have caused serious impacts on roads and the
surface oil pollution was evaluated through the lab surrounding environment, and the negative impact of
experiment. First, a glass dish was used as a substrate traffic operations on the environment has become
to determine the basic working condition of the test; then, increasingly prominent [3].
a test method considering the impact of different oil The main source of road surface oil pollution is the
erosion degrees was proposed to eliminate the effect of oil leakage of motor vehicle fuels (gasoline and diesel) and
erosion on asphalt pavement and leakage on cement lubricants. Spilled oil will remain on the surface of the
pavement, which led to the development of a lab test road and spread in the air voids of the pavement, which
method for the nano-TiO2 photocatalytic degradation could result in a decrease in the friction coefficient of the
effect of oil pollution on different road surfaces. road, affect driving safety, and cause damage to
pavement materials over time, and thus reduce the
service life of the road [4]. At the same time, on the road
* Corresponding author: Huanan Yu, Department of Road
Engineering, National Engineering Laboratory of Highway
surface polluted by the oil spill, the road runoff formed
Maintenance Technology, School of Traffic and Transportation by rain erosion will cause secondary pollution of the
Engineering, Changsha University of Science & Technology, surrounding soil and water.
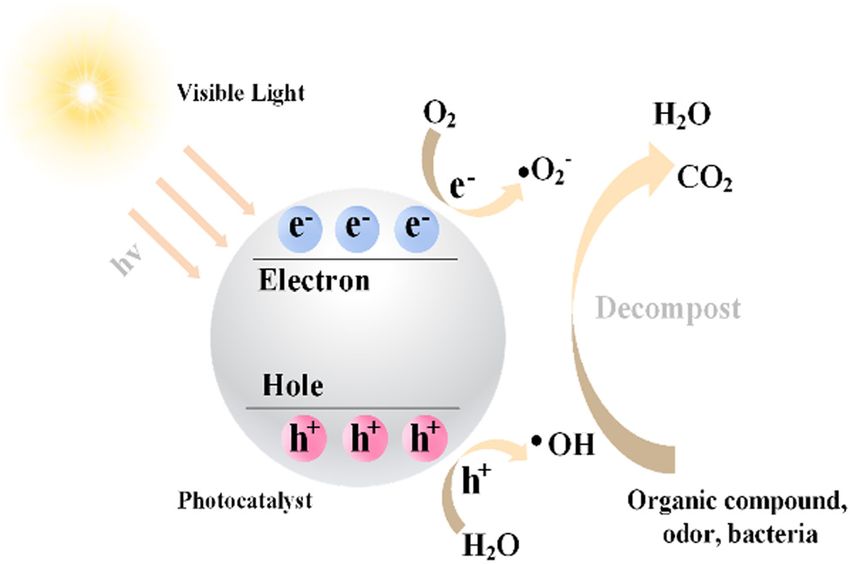
Changsha, 410114, Hunan, China, e-mail: huanan.yu@csust.edu.cn The photocatalytic degradation is a safe, long-
Qing’e Wang: Department of Engineering Management, School of
lasting, and sustainable technology in the treatment of
Civil Engineering, Central South University, Changsha, 410000,
Hunan, China, e-mail: wqecsu@csu.edu.cn air pollutions [5–9] and road surface oils [10,11]. The
Kai Zheng: China Railway 14th Bureau Group Co. Ltd, Shandong, basic mechanism is that photocatalytic materials
China, e-mail: 1055146556@qq.com will induce photo-oxidation–reduction reactions under
Luwei Zhao: Department of Engineering Management, School of the action of light. When it is exposed to high energy
Civil Engineering, Central South University, Changsha, 410000,
light, it generates highly reactive electron–hole pairs
Hunan, China, e-mail: luweizhao@csu.edu.cn
Xuan Zhu: Department of Road Engineering, School of Traffic and on the surface, which will interact with dissolved
Transportation Engineering, Changsha University of Science & oxygen and water molecules adsorbed on the surface
Technology, Changsha, 410114, China, of the material and eventually oxidize and degrade
e-mail: zhuxuan@stu.csust.edu.cn the organic matter into inorganic substances such as
Junqian Zhang: Department of Civil Engineering, School of Civil
Engineering, Central South University, Changsha, 410000, Hunan,
CO2 and H2O, as shown in Figure 1. The reaction
China, e-mail: jqstark@163.com mechanism contains the following reaction formula (1)
ORCID: Huanan Yu 0000-0001-9491-6383 to formula (9) [12,13].
Open Access. © 2020 Qing’e Wang et al., published by De Gruyter. This work is licensed under the Creative Commons Attribution 4.0
International License.Lab experiment on the Nano-TiO2 photocatalytic degradation effect 923
Kim et al. [20] investigated the degradation of petroleum
hydrocarbons by the TiO2 suspension system. In 2002, a
7,000 m2 environmentally friendly pavement was con-
structed in Milan, Italy, in which the photocatalyst was
mixed with cement slurry in a certain proportion and
then coated on the surface of the pavement, and the gas
test results showed that the degradation rate of the
photocatalyst on the pavement was still high for
nitrogen oxides after long-term use [21,22].
Research related to the application of photocatalytic
materials on pavements is also becoming an important
aspect of environmentally friendly pavement construc-
tion. Researchers [23–25] analyzed the degradation
Figure 1: Diagram of photocatalytic degradation mechanism. properties of TiO2-doped pavement material on NOX
and found that nano-TiO2 did not adversely affect the
physical properties of pavement materials before and
photocatalyst + hv → h+ + e− (1)
after incorporation. Chen and Liu [26] prepared nano-
h+ + H2 O → OH + H+ (2) TiO2-containing specimens by infiltration technique
based on the porous characteristics of concrete and
e− + O2 → O−2 → ⋅ HO
2 (3)
investigated the effects of surface friction, humidity and
2⋅ HO 2 → O2 + H2 O2 (4) light intensity on the efficiency of NOX decomposition.
O−2 + H2 O2 → ⋅ OH + OH− + O2 (5) Based on vehicle emissions of decontamination by using
nanometer TiO2 of photocatalysis method, Ai and Chen
H2 O2 + e− → ⋅ OH + OH− (6)
[27] had optimized the nano-TiO2 content, and surfactant
OH− + h+ → ⋅ OH (7) utilized the permeability technology to make concrete
OH + Organ → HO2 + CO2 . (8) with nano-TiO2. Chen et al. [28] examined the potential
use of heterogeneous photocatalysis as an innovative
The aforementioned reaction process can be sum- oxidation technology and found that this technology can
marized as formula (9): reduce the damaging effects of vehicle emissions by
hv + photocatalyst
(9) using nitrogen-doped (N-doped) TiO2 as a photocatalyst
Organ + O2 ⟶ CO2 + H2 O.
coated on the asphalt road surface. The experimental
A large number of research studies have shown that results showed that an N-doped TiO2 asphalt road
photocatalysts loaded onto suitable carriers can be effec- material has a higher activity compared with a pure
tively applied for the treatment of oil pollution. For example, TiO2 asphalt road material under visible light irradiation.
Heller [14] conducted an outdoor experiment in which Tseng and Kuo [29] found that the carbonaceous species
100 µm diameter hollow glass spheres were loaded with on the TiO2 surface plays an important role in the visible-
TiO2 and made to float on the water surface for oil pollution light absorption and photocatalytic degradation rates for
degradation. Berry and Mueller [15] used TiO2 powder as the NOX and methyl orange through photoluminescence,
photocatalytic material and adhered it to wood chips with Raman, UV-vis, infrared, and X-ray photoelectron
epoxy resin, and the test result showed that it could spectroscopies. Lei et al. [30] evaluated the ball milling
effectively degrade petroleum pollutants on the water process on the photocatalytic performance of CdS/TiO2
surface. Zhang et al. [16] also evaluated nano-TiO2 in water composite through X-ray diffraction and UV-Vis diffuse
treatment. King et al. [17] and Yang et al. [18] found that the reflectance spectroscopy methods. Zhang et al. [31] and
photocatalytic technology was useful in the degradation of Ossai and Raghavan [32] evaluated the properties of
the oil in the Deepwater Horizon spill accident. nano-modified materials for cement-based materials.
Ziolli and Jardim [19] used photocatalytic technology From the above literature review, it can be seen that
to analyze and determine the degradation of crude oil scholars have achieved much progress in the use of TiO2
with nano-TiO2. In this experimental study, nano-TiO2 for the treatment of oil pollution on water surfaces and
was used as a photocatalyst under a UV light source, and the construction of environmentally friendly roads.
the result shows that the degradation rate of crude oil However, in the current road engineering, there is a
could reach more than 90% after 24 h of UV irradiation. lack of systematic studies on the quantitative effects and924 Qing’e Wang et al.
influence laws of TiO2 in degrading oil pollution on road Accordingly, a lab test procedure for photocatalytic
surfaces. Most of the applied research studies on the degradation of oil on the road surface was proposed, and
treatment of oil pollutants by TiO2′ were focused on the a simulation test method for photocatalytic degradation of
treatment of water surface oil pollution, while the studies oil on asphalt pavement and the concrete road surface was
on the effects of photocatalytic degradation of oil pollution developed based on the optimization of the test conditions
on road surfaces and the corresponding test methods and and the sensitivity analysis of the test parameters.
evaluation indexes for cement concrete or asphalt pave-
ments are still relatively few. Besides, many researchers
have found that the nanoparticles can potentially improve
the rutting and cracking resistance of asphalt mixtures, 2.1 Test process design
which make the application of TiO2 on the asphalt
pavement to be more applicable [33–39]. For roads with a high risk of oil leakage and sensitive
The nano-TiO2 particles are in the dimension of environmental impact, it is important to apply the
100 nm or less, which makes the nanoparticles have a protective nano-TiO2 coating on the road surface to
greater surface area and let them be more reactive with reduce the adverse effects of road surface oil pollution.
oil spills [40,41]. In this study, a lab test method for Therefore, in this study, the test procedure was designed
photocatalytic degradation of the effects of road surface to analyze the effect of nano-TiO2 photocatalytic degra-
oil pollution was proposed to address the aforemen- dation of road surface oil pollution, as shown in Figure 2.
tioned problems. The glassware was used as a substrate The nano-TiO2 photocatalytic degradation test of
to initially explore the basic working condition para- roadway oil stains was conducted in an environmental
meters, and then asphalt pavement and cement concrete simulation system designed in house, which consisted of
were used as substrates to simulate the oil degradation a light device and a temperature control device [42]. The
effect of the two types of the pavement surface. light illumination device uses a UV-LED light source
with a wavelength of 365 nm, including a controller and
an irradiation head; the controller can adjust the UV
output power of the light illumination device to adjust
2 Research methodology the light intensity within the range of 0–150 W/m2. The
illumination device is able to meet the requirements of
Taking the oxidation ability, chemical stability and simulating a variety of UV irradiation intensities in the
economics of various photocatalytic materials into test process.
consideration, nano titanium dioxide (nano-TiO2) was In this study, the petroleum concentration and COD
selected as the test substrate because of the good (Chemical Oxygen Demand) values were selected as the
photocatalytic performance, stable properties and wide evaluation indicators. The samples collected were
application range. The nano-TiO2 was applied on assessed for water quality, the COD, and petroleum
different substrates (simulating different pavement sur- concentration tests, and the main test instruments are
faces) by spraying and external penetration methods. shown in Table 1, and the corresponding chemical
surface modification material
photocatalysis material levitated solution simulation of oil pollution
solvent uniformly
specimens
coating
start the clock
test vector testing process
set test temperature
and light intensity
Environmental simulation reaction test system flushing test pieces
water sample testing
test results aqueous solution after rinsing
Figure 2: Test flow diagram.Lab experiment on the Nano-TiO2 photocatalytic degradation effect 925
Table 1: Indicators and methods for water quality testing
Serial number Test items Test method Testing equipment
1 COD GB11914-89 GDYS-201M (multiparameter water quality analyzer)
2 Petroleum SL93.2-94 MAI-50G (infrared oil detector)
Table 2: Main technical parameters of nano-TiO2
Appearance Crystallographic structure Water content Average particle size (nm) Specific surface area (m2/g) Purity
White powder Anatase ≤0.5% 20 50–100 ≥99.8%
Note: the water content is the percentage of dry weight loss after 2 h at 105°C.
Table 3: Main technical parameters of silane coupling agent
Density (g/cm3) Refractive index Boiling point (°C) Characteristics
0.949 1.423 213–216 Colorless to light yellow transparent liquid
reagents were stored according to the national sample 2.2.2 Other materials and technical parameters
storage standard (GB12997-91).
The degradation rate index was defined and used for In addition to the nano-TiO2, the other test materials
the effect of photocatalytic pavement oil pollution, involved mainly include the following:
which was calculated by the following formula (10):
C0 − C1
Degradation rate (%) = × 100%, (10)
C0 2.2.2.1 Surface modifiers
where C0 is the contaminant concentration in water without The surface modifiers can effectively prevent agglomera-
photocatalysis (mg/L) and C1 is the contaminant concen- tion between particles and improve the photocatalytic
tration in water under photocatalytic conditions (mg/L). activity of the nano-TiO2. The silane coupling agent was
chosen as the surface modifier of the material in the test,
and its main technical parameters are shown in Table 3.
2.2 Test materials
2.2.1 Nano-TiO2 technical parameters 2.2.2.2 Deionized water
The deionized water can be used as a solvent to prepare
In this study, the commercially available VK-TG01 nano- the test material and to rinse the residual oil of the
TiO2 was chosen as the photocatalytic substrate, and its specimen in the test. The main technical parameters of
main technical parameters are shown in Table 2. the selected deionized water are shown in Table 4.
Nanomaterials are prone to spontaneous agglomera-
tion during transportation and storage and transformed
into secondary particles with large particle size, which
2.2.2.3 Carbon tetrachloride
may lead to a significant decrease in the photocatalytic
activity of the material. Therefore, it is necessary to The carbon tetrachloride selected in this study is an
perform surface modification to effectively prevent environmentally friendly reagent used in conjunction
interparticle agglomeration and improve their photo- with the infrared oil detector, and its main technical
catalytic activity. parameters are shown in Table 5.926 Qing’e Wang et al.
Table 4: Main technical parameters of deionized water
Conductivity (µS/cm) 1 μm particle number (units/mL) Bacteria number (units/mL) Characteristics
≤2.0 ≤500 ≤100 Colorless
Tasteless
Table 5: Main technical parameters of carbon tetrachloride (CCl4)
Content Moisture Density (20°C, g/mL) Evaporation residue Acidity (H+, mmol/100 g) Characteristics
≥99.5% ≤0.02% 1.592–1.598 ≤0.001% ≤0.005 Colorless transparent
Table 6: Main technical parameters of hydrochloric acid
Content (HCl) Scorched residue Relative density (water = 1) pH Characteristics
36–38% ≤0.0005% 1.2 2–3 Colorless transparent
Table 7: Main technical parameters of simulated oil stains
SAE rating Viscosity index Pour point (°C) Flashpoint (°C) Density (15°C, kg/mL)
20W-40 116 −27 223 0.89
Table 8: Main technical parameters of anhydrous sodium sulfate
Content (Na2SO4) Scorched residue Relative density (g/cm3) pH (25°C, 50 g/L) Characteristics
≥99.0% ≤0.2% 2.68 5.0–8.0 Colorless transparent crystal
2.2.2.4 Hydrochloric acid
The hydrochloric acid was mainly used to acidify the Table 9: Main technical parameters of sodium chloride
collected aqueous solution, and the main technical
parameters of the analytically pure hydrochloric acid Content Loss on Density pH (25°C, Characteristics
(NaCl) drying (g/cm3) 50 g/L)
used in this test are shown in Table 6.
≥99.5% ≤0.5% 2.165 5.0–8.0 Colorless crystal
2.2.2.5 Lubricants
2.2.2.7 Sodium chloride
Since the lubricant spilled by motor vehicles is one of the
main sources of oil stains on the road, a commercial The sodium chloride was mainly used to reduce the
lubricant was chosen to simulate oil stains in this test, solubility of oil in water to facilitate extraction in the test,
and its main technical parameters are shown in Table 7. and its main technical parameters are shown in Table 9.
2.2.2.6 Anhydrous sodium sulfate 2.3 Investigation for optimizing working
The anhydrous sodium sulfate was mainly used for the conditions of the test
dewatering of carbon tetrachloride extraction solution in
the test, and its main technical parameters are shown in The effect of the nano-TiO2 photocatalytic degradation
Table 8. for the oil pollution is influenced by various conditions,Lab experiment on the Nano-TiO2 photocatalytic degradation effect 927
Table 10: Experimental schemes for working conditions optimization
Evaluation parameters Reference group
Nano-TiO2 usage (g/m ) 2
0, 4.4, 8.8, 13.3, 17.7, 22.1, 26.5, 31.0, 35.4, 39.8, 44.2 Nano-TiO2 usage is 4.4 g/m2, 26.5 g/m2
Ambient temperature (°C) 5, 15, 25, 35, 45 Luminous intensity is 30 W/m2
Luminous intensity (W/m2) 0, 5, 10, 15, 20, 25, 30, 35, 40, 45 Test temperature is 25°C
Response time (h) 0.25, 0.5, 0.75, 1, 1.25, 1.5, 2, 2.5, 3, 4, 6, 8 Response time is 3 h
80 80
70 70
Degradation rate(%)
Degradation rate(%)
60
60
50
50 4.4 g/m²
40
30 40
26.5 g/m²
20 30
10 20
0
0 10 20 30 40 50 10
Material usage (g/m2) 0
0 10 20 30 40 50
(a)
Light intensity (W/m2)
(a)
80 70
70 60
Degradation rate(%)
Degradation rate(%)
60
50
50 4.4 g/m²
40
40 26.5 g/m²
30 30
20 20
10
10
0
0 10 20 30 40 50 0
Material usage (g/m2) 0 10 20 30 40 50
(b) Light intensity (W/m2)
(b)
Figure 3: Degradation rate test results for different amounts of
photocatalytic materials, (a) petroleum, (b) COD. Figure 4: Test results of degradation rates under different light
intensities, (a) petroleum, (b) COD.
such as road surface condition, the amount of oil
pollution/nano-TiO2 and its ratio, ambient temperature, different conditions are shown in Table 10. The reference
light intensity, and light time [43]. Therefore, the group indicated that those parameters were kept un-
sensitivity analysis of the relevant parameters was changed when other test conditions were changed to
carried out in this experimental study. conduct the sensitivity test. The test results are shown in
Different road surface conditions have different Figures 3–6.
degrees of dissolution or leakage for oil pollution, which
may affect the determination of the degradation effect for
oil pollution. Therefore, in order to eliminate the influence 2.3.1 Impact of nano-TiO2 amount
of different road surface conditions, a 12 cm diameter
glass dish substrate was used for the initial test. To evaluate the effect of different nano-TiO2 amounts on
In order to find the optimum test condition for the the degradation effect, a total of 11 groups of tests were
nano-TiO2 usage, the ambient temperature, the luminous conducted in this study as shown in Table 10. Among
intensity and response time, 11 different levels of nano- them, the test group with 0 g/m2 of nano-TiO2 was used
TiO2 amount, 5 different ambient temperatures, 10 levels as a blank control group. The corresponding results of
of different luminous intensities and 12 different response the degradation rates of petroleum and COD from the
time levels were evaluated; the evaluating levels of experimental analysis are shown in Figure 3(a) and (b).928 Qing’e Wang et al.
80 It can be seen from Figure 3 that when the amount of
70 nano-TiO2 coated on the specimen was less than 22.1 g/m2,
the more the amount of nano-TiO2, the better the degrada-
Degradation rate (%)
60
50 tion effect on simulated oil pollution; when the amount was
4.4 g/m²
40 26.5 g/m²
more than 22.1 g/m2, the degradation rate did not show any
30 significant change. However, from the perspective of
20 practical engineering application, the amount of nano-
10 TiO2 per unit area should not be too much, otherwise, it will
0
affect the road performance such as the skid resistance [44].
0 10 20 30 40 50
Temperature (°C)
(a)
70 2.3.2 Impact of lighting intensity
60
In order to evaluate the influence of different light
Degradation rate (%)
50 4.4 g/m²
intensities on the degradation effect, ten groups of
40 26.5 g/m²
different lighting intensity levels were conducted in this
30 study, as shown in Table 10. Among them, the test group
20 with a nano-TiO2 dosage of 0 g/m2 was used as a blank
10 control group. The corresponding results of the degrada-
tion rates of petroleum and COD obtained from experi-
0
0 10 20 30 40 50 mental analysis are shown in Figure 4(a) and (b).
Temperature (°C) It can be seen from Figure 4 that under conditions of
(b) different amounts of nano-TiO2, the increase in illumina-
tion intensity has a significant effect on the simulated oil
Figure 5: Test results of degradation rates under different ambient
temperatures, (a) petroleum, (b) COD. pollution degradation when the illumination intensity
was within a lower certain range; when the illumination
intensity was increased to a certain extent (for example,
when the illumination intensity is 30 W/m2 or above),
the increase in illumination intensity had little effect on
80 the degradation rate of simulated oil pollution.
70
Degradation rate(%)
60
50 4.4g/m²
40 26.5g/m²
2.3.3 Impact of test temperature
30
20 In order to evaluate the influence of different test
10 temperatures on the degradation effect, five groups of tests
0
0 1 2 3 4 5 6 7 8 9
were conducted in this study as shown in Table 10. Among
Test time (h) them, the test group with a nano-TiO2 dosage of 0 g/m2 was
(a)
used as a blank control group. The corresponding results of
90
the degradation rates of petroleum and COD obtained from
Degradation rate(%)
80
70
test analysis are shown in Figure 5(a) and (b).
60 Figure 5 shows that within a certain test temperature
50 range, an increase in temperature can accelerate the
40
4.4g/m² photocatalytic degradation reaction, but when the
30
20
26.5g/m² temperature reached a certain level (up to 25°C in this
10 test), the reaction temperature did not have a significant
0
0 1 2 3 4 5 6 7 8 9 effect on the photocatalytic activity of material. The main
Test time (h) reason is that most of the photocatalytic redox reactions
(b)
are accompanied by endothermic or exothermic pro-
Figure 6: Test results of degradation rates under different reaction cesses, which could cause certain influence of test
times, (a) petroleum, (b) COD. temperature on the degradation effect, and the influenceLab experiment on the Nano-TiO2 photocatalytic degradation effect 929
Table 11: Results of Marshall tests under best bitumen aggregate ratio
Asphalt Density Air voids Voids in mineral Voids filled with Marshall Flow
content (%) (g/cm3) VV (%) aggregate, VMA (%) asphalt, VFA (%) stability (KN) value (mm)
5.2 2.431 5.0 16.1 67.2 16.3 2.73
is relatively obvious especially under the low tempera- different from the previous simulation in glass dishes;
ture condition. However, the main factor affecting the the main reason was that the asphalt corrosion could
effect of nano-TiO2 photocatalytic degradation was increase the amount of pavement oil pollution during
still the electron–hole pairs excited by light, and the the test process, thus affecting the determination of
increase in temperature will not affect the number of degradation effect. Therefore, in the lab simulation study
electron–hole pairs that can be generated. of asphalt pavement, the key point is how to determine
the parameter C0 in the aforementioned equation (10).
2.3.4 Impact of reaction time
In order to evaluate the influence of different reaction 3.1 Preparation of basal specimens and
times on the degradation effect, a total of 12 groups of coatings
tests were conducted in this study as shown in Table 10.
Among them, the test group with 0 g/m2 of nano-TiO2 In this test, the styrene butadiene styrene modified asphalt
was used as a blank control group. The corresponding with strong resistance to oil corrosion was used [45,46]. The
results of the degradation rates of petroleum and COD asphalt mixture was designed as dense-graded asphalt
obtained from the experimental analysis are shown in mixture AC-13C, and the aggregate of limestone material was
Figure 6(a) and (b). used. The results of the specimen tests are shown in Table 11.
From Figure 6, it can be seen that the longer the reaction Rutting plate specimens were compacted according
time, the better the degradation effect of the nano-TiO2 on to the national standard, and the specimens were cut
the simulated oil pollution under different dosages of nano- into 10 cm × 10 cm squares after it was formed, and the
TiO2; when a certain reaction critical time was reached, the surface of the specimens was used as a substrate
photocatalytic degradation rate was stable; the result has preparing for coating [47,48].
shown that the critical time was reached faster with the
increase in nano-TiO2 amount. The result has shown that
the critical reaction time was 3–6 h.
Therefore, based on the above analysis, 26.5 g/m2 of 3.2 Treatment and analysis of asphalt
simulated oil contamination per unit area was used (i.e., pavement erosion
0.3 g of oil contamination dropped onto the specimen
surface), and 3,000 mL of water was used for rinsing the The oil stains on asphalt pavement could cause corro-
specimen. The luminous intensity was 30 W/m2, the sion and thus affect the oil photocatalytic degradation
optimum test temperature was 25°C, and the selected test result; therefore, how to deal with this problem and
response time was 3 h. The optimized test conditions are how to select the working conditions of the blank control
shown in Table 10. group in the test is the key to the simulation test method
of nano-TiO2 photocatalytic degradation of oil pollution
on asphalt pavement.
Degradation tests of the blank control group under
3 Simulation test for different working conditions were carried out, and the
petroleum and COD concentration at different times under
photocatalytic degradation of oil an oil amount of 30 g/m2 and a flushing water amount of
asphalt pavement 3,000 mL were compared, and the test result is shown in
Figure 7. The working condition of T–G was the control
When oil contamination occurs on road asphalt pave- group with a nano-TiO2 coating of 0 g/m2, a light intensity
ment, the conditions of field road surface were quite of 30 W/m2, and a test temperature of 25°C on the glass930 Qing’e Wang et al.
Flushing water degradation(mg/L) 60
145
T-G petroleum
140 50
Degradation rate (%)
COD
135 T-A-1
130 40
T-A-2
125
T-A-3 30
120
115 20
110
105 10
100
0
95
0 1 2 3 4 5 6
0 5 10 15 20 25 30 35
Light intensity (W/m2)
Test time (h)
(a) Figure 8: Oil degradation rate of asphalt pavement under different
light intensities.
145
Flushing water degradation(mg/L)
140 T-G
135 T-A-1
Therefore, when conducting the nano-TiO2 photocata-
130
T-A-2
125 lytic degradation test of asphalt pavement oil pollution,
T-A-3 the working condition T-A-3 could be referred to as the
120
115 test conditions for the blank control group. The condi-
110
tion of T-A-3 was the nano-TiO2 amount of 5 g/m2, the
105
test temperature of 25°C, and the reaction time of 3 h for
100
95
test analysis; the impact of light intensity of 5, 10, 15, 20,
0 1 2 3 4 5 6 25, and 30 W/m2; and the results of the degradation rates
Test time (h) for petroleum and COD are shown in Figure 8.
(b)
Figure 7: Test results of degradation test in the blank control group,
(a) petroleum, (b) COD.
4 Simulated method of
substrate; working condition of T-A-1 was the test with a
nano-TiO2 coating of 0 g/m2, a light intensity of 30 W/m2,
photocatalytic degradation for
and a test temperature of 25°C on the asphalt substrate; oil pollution on cement
working condition of T-A-2 was the test with a nano-TiO2
coating of 30 W/m2, a light intensity of 30 W/m2, and a test
pavement
temperature of 25°C on the asphalt substrate; and working
In the case of oil pollution on cement pavement, the field
condition of T-A-3 was the test with a nano-TiO2 coating
conditions for road surface were quite different from the
dosage of 5 g/m2, a light intensity of 0 W/m2, and a test
previous simulated working conditions of glass dish, and
temperature of 25°C on the asphalt mixture base.
the cement concrete pavement has obvious oil leakage on
It can be seen from Figure 7(a) and (b) that the
its surface due to the porous properties, which could cause
phenomenon for asphalt corrosion is obvious compared
the oil leakage to be included in the degradation amount
with the glass dish substrate under the action of the oil.
and could not reflect the actual degradation effect when
Therefore, it is important to reasonably evaluate the
the nano-TiO2 photocatalytic degradation test was con-
corrosion in the photocatalytic degradation test of oil on
ducted. Therefore, the determination of the parameter C0
asphalt pavement. The test results of the working
in equation (10) was also a key consideration in the lab
condition T-A-1 and T-A-2 were close to each other,
simulate study for cement pavements.
which indicated that the light intensity has little influence
on the asphalt dissolution degree without photocatalytic
materials. The coated material in working condition T-A-3
had a certain barrier effect on the contact between asphalt 4.1 Preparations of substrates and coatings
and oil, and the degree of asphalt dissolution was smaller
than that in working conditions T-A-1 and T-A-2, which The typical #42.5 Portland cement was used in this test;
was closer to the actual pavement condition. the limestone crushed stone with the particle size ofLab experiment on the Nano-TiO2 photocatalytic degradation effect 931
4.75–26.5 mm was chosen as the coarse aggregate with 300
Flushing water concentration(mg/L)
T-G
the water–cement ratio of 0.36, and natural river sand 250 T-C-1
was used as the fine aggregate to prepare for the test T-C-2
200
specimens. T-C-3
In the lab simulated test study of cement concrete 150
pavements, cement concrete specimens with dimensions
100
of 10 cm × 10 cm × 10 cm were prepared, and the nano-
TiO2 was loaded on their surfaces by external penetra- 50
tion for simulating cement concrete pavements coated 0
with nano-TiO2. 0 2 4 6 8 10 12 14 16
Test time (h)
(a)
300
T-G
Flushing water concentration(mg/L)
4.2 Treatment and analysis of the cement 250 T-C-1
pavement oil leakage problems 200
T-C-2
T-C-3
150
The problem of oil leakage on cement pavements during
degradation tests could affect the nano-TiO2 photocata- 100
lytic degradation test result of the pavement oil pollu-
50
tion; therefore, how to deal with this problem and how
to select the working conditions of the blank control 0
0 2 4 6 8 10 12 14 16
group in the test were also key to the simulation for oil
Test time (h)
photocatalytic degradation on cement pavement. (b)
The degradation test of the blank control group was
carried out to compare the petroleum concentration and Figure 9: Test results of degradation test in the blank control group,
(a) petroleum, (b) COD.
COD changes under the condition of 30 g/m2 of oil amount,
and the test result is shown in Figure 9. The base condition
for working condition T-G was a glass dish substrate, a of leakage. Therefore, during the nano-TiO2 photocata-
nano-TiO2 coating dosage of 0 g/m2, a light intensity of lytic degradation test for the oil pollution of the cement
30 W/m2, a test temperature of 25°C; the base condition for pavement, the saturated leakage amount is deducted
working condition T-C-1 was a cement pavement substrate, from the test, and the specimens are subjected to 3 h of
a nano-TiO2 coating dosage of 0 g/m2, a light intensity of leakage as a blank control group. The basic working
30 W/m2, a test temperature of 25°C; the base conditions for condition is the nano-TiO2 amount of 5 g/m2; the light
working conditions T-C-2 and T-C-3 were the same as those intensity of 5, 10, 15, 20, 25, 30, and 35 W/m2; the test
for working condition T-C-1, except that the initial oil temperature of 25°C; and the reaction time of 3 h for the
contamination of the substrate under the two conditions test analysis, and the results of degradation rates for the
was 60 and 90 g/m2, respectively. petroleum and COD are shown in Figure 10.
It can be seen from Figure 9(a) and (b) that
compared with the glass dish substrate, the cement 35
pavement substrate had a significant oil leakage 30 petroleum
phenomenon, which indicated that it should be reason- COD
Degradation rate (%)
25
ably considered the oil leakage when conducting the
20
nano-TiO2 photocatalytic degradation test of cement
15
pavement oil pollution. The test results under working
10
conditions of T-C-1, T-C-2, and T-C-3 showed that the
cement concrete substrate had a saturation capacity of 5
oil leakage from the pavement, and no further leakage 0
0 5 10 15 20 25 30 35 40
could occur after the saturation capacity was reached.
Light intensity (W/m2)
During the oil pollution degradation of the cement
pavement, the reduction in the amount of oil pollution Figure 10: Degradation rate of oil on cement pavement at different
comes from the amount of degradation and the amount light intensities.932 Qing’e Wang et al.
5 Conclusions nanocomposites. Appl Clay Sci. 2006;32(1–2):99–110. doi:
10.1016/j.clay.2005.09.007.
In this study, aiming at the treatment of oil pollution for [7] Carneiro JO, Azevedo S, Teixeira V, Fernandes F, Freitas E,
Silva H, et al. Development of photocatalytic asphalt
pavements in road operation, the lab testing and
mixtures by the deposition and volumetric incorporation of
evaluation methods for the degradation of oil pollution TiO2 nanoparticles. Constr Build Mater. 2013;38:594–601.
from road surfaces through nano-TiO2 were conducted, doi: 10.1016/j.conbuildmat.2012.09.005.
the following conclusions can be drawn: [8] Liang H, Wang Z, Liao L, Chen L, Li Z, Feng J. High performance
(1) A lab test method for the determination of the effect photocatalysts: montmorillonite supported-nano TiO2 com-
posites. Opt - Int J Light Electron Opt. 2017;136:44–51.
of photocatalytic degradation for oil pollution on the
doi: 10.1016/j.ijleo.2017.02.018.
road surface by nano-TiO2 was proposed, and the [9] Yu HN, Dai W, Qian GP, Gong XB, Zhou DY, Li X, et al. The NOx
standard working conditions of the test method were degradation performance of Nano-TiO2 coating for asphalt
determined by optimizing the test conditions of pavement. Nanomaterials. 2020;10(5):897. doi: 10.3390/
ambient temperature, light intensity, and illumina- nano10050897.
[10] Khitab A, Ahmad S, Munir MJ, Kazmi SMS, Arshad T,
tion time on the glass substrate.
Khushnood RA. Synthesis and applications of nano titania
(2) As the oil corrosion of asphalt greatly impacts the
particles: a review. Rev Adv Mater Sci. 2018;53(1):90–105.
test result oil degradation on asphalt pavement, a doi: 10.1515/rams-2018-0007.
test method was proposed in this research which is [11] Gannavarapu KP, Thakkar M, Veerapaga S, Wei L,
able to eliminate that by reasonably selecting the Dandamudi RB, Mitra S. Novel diatom-FeOx composite as
working conditions of the blank control group for highly active catalyst in photodegradation of Rhodamine-6G.
Nanotechnol Rev. 2018;7(3):247–55. doi: 10.1515/ntrev-
the test.
2017-0218.
(3) As the oil leakage greatly affects the photocatalytic [12] Liu R, Xue XX, Yang H, Jiang T, Dong XW. Progress on the
degradation test result of the oil pollution on cement application of photocatalysis oxidation in environmental
concrete pavement, a method was proposed to protection. Energy Environ Prot. 2004;18(4):5–8.
eliminate the oil leakage impact by reasonably doi: 10.3969/j.issn.1006-8759.2004.04.002.
selecting the working conditions of the blank and [13] Yu BC, Wu HT, Zhang WZ. Application of nano-photocatalysts
in environmental protection. Pet Technol. 2005;4(5):491–5.
control group for the test.
doi: 10.3321/j.issn:1000-8144.2005.05.020.
[14] Heller A. Abstracts of the First International Conference on
TiO2 Photocatalytic Purification and Treatment of Water and
Conflict of interest: The authors declare no conflict of
Air. London, Ontario, Canada; 1992. 17.
interest regarding the publication of this paper. [15] Berry RJ, Mueller MR. Photocatalytic decomposition of crude
oils licks using TiO2 on a floating substrate. Microchem J.
1994;50(1):28–32. doi: 10.1006/mchj.1994.1054.
[16] Zhang P, Ling YF, Wang J, Shi Y. Bending resistance of PVA
References fiber reinforced cementitious composites containing nano-
SiO2. Nanotechnol Rev. 2019;8(1):690–8. doi: 10.1515/ntrev-
[1] He ZM, Xiang D, Liu YX, Gao QF, Bian HB. Deformation 2019-0060.
behavior of coarse-grained soil as an embankment filler under [17] King SM, Leaf PA, Olson AC, Ray PZ, Tarr MA. Photolytic and
cyclic loading. Adv Civ Eng. 2020;3:1–13. doi: 10.1155/2020/ photocatalytic degradation of surface oil from the deepwater
4629105. horizon spill. Chemosphere. 2014;95:415–22. doi: 10.1016/
[2] Hasan MM, Rahman ASMA, Tarefder RA. Investigation of j.chemosphere.2013.09.060.
accuracy of pavement mechanistic empirical prediction [18] Yang ZY, Hollebone BP, Zhang G, Brown CE, Yang C, Lambert P,
performance by incorporating Level 1 inputs. J Traffic Transp et al. Chemical fate of photodegraded diluted bitumen in
Eng (Engl Ed). 2020;7(2):259–68. seawater. Int Oil Spill Conf Proc. 2017;2017(1):2286–305.
[3] Wang QE, Zeng L, Chen HH, Qian GP. Research on Water- doi: 10.7901/2169-3358-2017.1.2286.
Environmental Emergency Management in Expressway Area. [19] Ziolli RL, Jardim WF. Photochemical transformations of water-
China Communications Press Co., Ltd; 2019. soluble fraction (WSF) of crude oil in marine waters. A
[4] Plati C, Pomoni M, Georgouli K. Quantification of skid comparison between photolysis and accelerated degradation
resistance seasonal variation in asphalt pavements. J Traffic with TiO2 using GC-MS and UVF. J Photochem Photobiol A
Transp Eng (Engl Ed). 2020;7(2):237–48. Chem. 2003;155:243–52. doi: 10.1016/S1010-6030(02)00397-0.
[5] Qian C, Zhao L, Fu D, Li L, Wang R. Photocatalytic oxidation of [20] Kim LH, Zoh KD, Cho H. Solar photocatalytic degradation of
nitrogen oxides by nano-TiO2 immobilised on road surface groundwater contaminated with petroleum hydrocarbons.
materials. J Chin Ceram Soc. 2005;33(4):422–7. doi: 10.1111/ Environ Prog. 2006;25(2):99–109. doi: 10.1002/ep.10124.
j.1744-7909.2005.00184.x. [21] Alexandre V. TiO2 Reactivation in photocatalytic destruction of
[6] Kun R, Mogyorosi K, Dekany I. Synthesis and structural and gaseous diethyl sulfide in a coil reactor. Appl Catal B.
photocatalytic properties of TiO2/montmorillonite 2003;44(1):25–40. doi: 10.1016/s0926-3373(03)00007-9.Lab experiment on the Nano-TiO2 photocatalytic degradation effect 933
[22] Muggli DS, Falconer JL. Role of lattice oxygen in photocatalytic [36] You Z, Mills-Beale J, Foley JM, Roy S, Goh SW. Nanoclay-
oxidation on TiO2. J Catal. 2000;191(2):318–25. doi: 10.1006/ modified asphalt materials: preparation and characterization.
jcat.2000.2821. Constr Build Mater. 2011;25(2):1072–8. doi: 10.1016/
[23] Typek J, Guskos N, Zolnierkiewicz G, Pilarska M, Guskos A, j.conbuildmat.2010.06.070.
Kusiak-Nejman E, et al. Magnetic properties of TiO2/graphitic [37] Shi X, Goh SW, Akin M, Stevens S, You Z. Exploring the
carbon nanocomposites. Rev Adv Mater Sci. interactions of chloride deicer solutions with nanomodified
2019;58(1):107–22. doi: 10.1515/rams-2019-0009. and micromodified asphalt mixtures using artificial neural
[24] Skiba NV. Mechanism of stress-driven grain boundary networks. J Mater Civ Eng. 2012;24(7):805–15. doi: 10.1061/
migration in nanotwinned materials. Rev Adv Mater Sci. (ASCE)MT.1943-5533.0000452.
2018;55(1):21–5. doi: 10.1515/rams-2018-0024. [38] Qian G, Yu H, Gong X, Zhao L. Impact of nano-TiO2 on the NO2
[25] Hassan M, Mohammad L, Cooper S, Dylla H. Evaluation of nano- degradation and rheological performance of asphalt pave-
titanium dioxide additive on asphalt binder aging properties. ment. Constr Build Mater. 2019;218:53–63. doi: 10.1016/
Transp Res Rec. 2011;2207:11–5. doi: 10.3141/2207-02. j.conbuildmat.2019.05.075.
[26] Chen M, Liu Y. NOX removal from vehicle emissions by [39] Yousefian R, Emadoddin E, Baharnezhad S Manufacturing of
functionality surface of asphalt road. J Hazard Mater. the aluminum metal-matrix composite reinforced with micro-
2010;174:375–9. doi: 10.1016/j.jhazmat.2009.09.062. and nanoparticles of TiO2 through accumulative roll bonding
[27] Ai XF, Chen M. The decontamination of vehicle emissions NOx process (Arb). Rev Adv Mater Sci. 2018;55(1):1–11.
through functionality surface of concrete road. Adv Mater Res. doi: 10.1515/rams-2018-0022.
2011;255–60:2930–3. doi: 10.4028/www.scientific.net/ [40] Krylova KA, Babicheva RI, Zhou K, Bubenchikov AM,
AMR.255-260.2930. Ekomasov EG, Dmitriev SV. The effect of crystallographic
[28] Chen M, Baglee D, Chu JW, Du DF, Guo XR. Photocatalytic orientation on the deformation mechanisms of nial nanofilms
oxidation of NOx under visible light on asphalt-pavement under tension. Rev Adv Mater Sci. 2018;57(1):26–34.
surface. J Mater Civ Eng. 2017;29(9):1. ISSN 0899-1561. doi: 10.1515/rams-2018-0044.
doi: 10.1061/(ASCE)MT.1943-5533.0001972. [41] Zhang Z, An Y. Nanotechnology for the oil and gas
[29] Tseng YH, Kuo CH. Photocatalytic degradation of dye and NOx industry – an overview of recent progress. Nanotechnol Rev.
using visible-light-responsive carbon-containing TiO2. 2018;7(4):341–53. doi: 10.1515/ntrev-2018-0061.
Catal Today. 2011;174(1):114–20. doi: 10.1016/ [42] Qian GP, Huang SX, Qin ZB, Li YQ, Ju SJ, Su ZH, et al. (2015).
j.cattod.2011.02.011. Gas-Solid Phase Photocatalytic Reaction Effect Detection
[30] Lei M, Chen Z, Lu H, Yu K. Recent progress in shape memory Device and Method with Controllable Variationof Influence
polymer composites: methods, properties, applications and Factors. Patent 2013 1 0017395.1.2015-05-20.
prospects. Nanotechnol Rev. 2019;8(1):327–51. doi: 10.1515/ [43] Qian GP, Zheng K, Zheng W, Zuo RF. Experimental study on
ntrev-2019-0031. photocatalytic degradation of road surface oil pollution.
[31] Zhang P, Li Q, Wang J, Shi Y, Ling Y. Effect of PVA fiber on Environ Sci Technol. 2015;38:172–6.
durability of cementitious composite containing nano-SiO2. [44] Zhou D. The research on NOx degradation performance of
Nanotechnol Rev. 2019;8(1):116–27. doi: 10.1515/ntrev- asphalt pavement coating by nanometer-TiO2. Hunan, China:
2019-0011. Department of Road Engineering, Changsha University of
[32] Ossai CI, Raghavan N. Nanostructure and nanomaterial char- Science and Technology; 2014.
acterization, growth mechanisms, and applications. Nanotechnol [45] Wang J, Wang XP, Zheng HX, Li JS. Study on the influence of
Rev. 2017;7(2):209–31. doi: 10.1515/ntrev-2017-0156. vehicle leakage on asphalt pavement and countermeasures.
[33] Dehouche N, Kaci M, Mouillet V. The effects of mixing rate on Technol Dev Enterp. 2010;29(15):87–9, 98. doi:
morphology and physical properties of bitumen/organo- CNKI:SUN:QYJK.0.2010-15-043.
modified montmorillonite nanocomposites. Constr Build [46] Vo HV, Park DW, Seo JW, Le THM. Effects of asphalt
Mater. 2016;114:76–86. doi: 10.1016/ types and aging on healing performance of asphalt mixtures
j.conbuildmat.2016.03.151. using induction heating method. J Traffic Transp Eng (Engl Ed).
[34] Ghasemi M, Marandi SM, Tahmooresi M, Kamali RJ, 2020;7(2):227–36. doi: 10.1016/j.jtte.2018.10.009.
Mousavian RT. Modification of stone matrix asphalt with nano- [47] Technical Specification for Construction of Highway Asphalt
SiO2. J Basic Appl Sci Res. 2012;2(2):1338–44. Pavement. Beijing, Ministry of Transport of the People’s
[35] Goli A, Ziari H, Amini A. Influence of carbon nanotubes on Republic of China. JTG F40-2004, 2004.
performance properties and storage stability of SBS modified [48] Ministry of Transport of the People’s Republic of China.
asphalt binders. J Mater Civ Eng. 2017;29(8):04017070. Standard Test Methods of Bitumen and Bituminous Mixtures
doi: 10.1061/(asce)mt.1943-5533.0001910. for Highway Engineering: JTG E20-2011, 2011.You can also read