LABOUR MARKET INTELLIGENCE PACK - JANUARY 2021 - West of England Combined Authority
←
→
Page content transcription
If your browser does not render page correctly, please read the page content below
LABOUR MARKET INTELLIGENCE
PACK

                         JANUARY 2021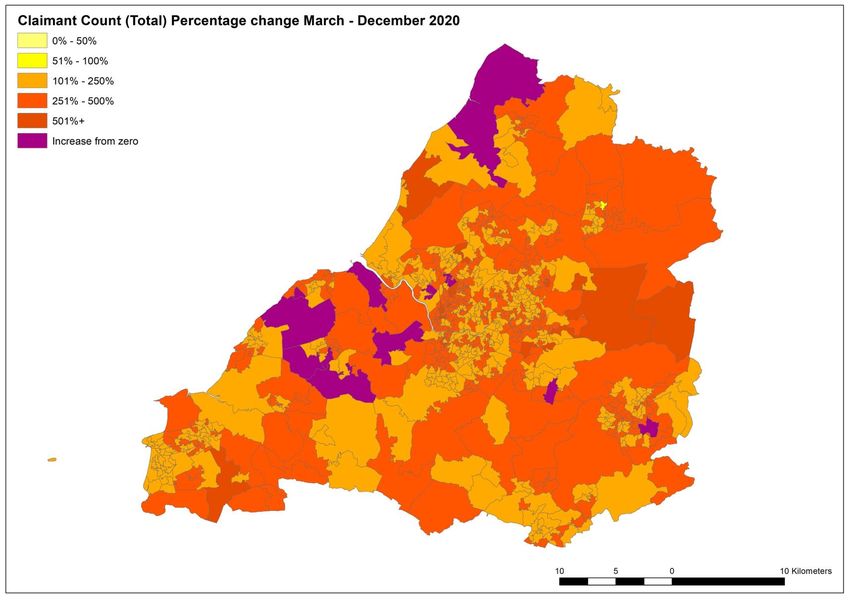
Introduction
This document collates evidence about the labour market
in the West of England, highlighting the current challenges
posed by the COVID pandemic as well as identifying longer-
term issues. The analysis looks at the characteristics and    Contents
spatial distribution of the labour force, and business and
employer demand. It covers both short and long term           This document is split into the
Labour Market Intelligence and provides interpretation        following sections:
around the available data.

Geography                                                     Section                Page
The document refers to the West of England region. This is    Business Environment   4
taken to mean the West of England Local Enterprise
Partnership area, which is made up of four unitary
authorities:                                                  Unemployment,          12
                                                              Employment and
▪ Bath and North East Somerset                                Redundancy
▪ Bristol
                                                              Current Labour         23
▪ North Somerset                                              Market Demand
▪ South Gloucestershire

                                                                                                2
Summary
This section summarises results from the rest of the report.

Business Environment                                                        Current Labour Market Demand
▪     The West of England has a broad sector base with a variety of         ▪ Job posting data indicates that levels in December were slightly
      businesses based in the region.
                                                                              below those seen pre-pandemic, with a fall seen in November,
▪     The West of England has some specialist industries that make up a       although December 2020 postings were up 85.30% on the year low of
      larger proportion of employment than the UK average, such as            April 2020. There has been a shift in the type of jobs advertised. Gains
      Civil Engineering, Education and Knowledge Creation, Creative,          in recent months were partly driven by strong increases in postings in
      Financial and Legal Services, and Digital. The impact of the            both the IT and human health and social care sector.
      economic downturn caused by the COVID pandemic is expected to
      vary between sectors.                                                 ▪ The most frequently demanded jobs advertised December 2020
                                                                              were: Programmers and software development professionals (790),
Unemployment, Employment and Redundancy                                       Nurse (493), Care workers and home carers (427), Managers and
                                                                              proprietors in other services (358) and Sales related occupations (290).
▪     As of December 2020 5.0% of working age population in the West
      of England were claiming unemployment benefits (36,840
      residents). This is broadly in line with levels seen in October and   ▪ Thematic areas of skills demand:
      November 2020.                                                        (1) Science, Technology, Engineering and Mathematics (STEM) subjects –
                                                                                these are the basis of many technological jobs
▪     The Labour Force Survey confirms unemployment is rising in the        (2) Digital/ technology skills – these are applicable both within the
      South West region, with males and females seeing similar increases
      in rates between the Jan – March and Sept -Nov time period. Males         important and resilient IT, creative and digital sectors, as well as in
      saw consistently higher rates of unemployment both nationally. The        a variety of other jobs.
      region saw a lower unemployment rate than England as a whole, at
                                                                            (3) Specific vocations – training for specific jobs currently in demand
      4.2% regionally compared to 5.3% nationally.
                                                                                (based on evidence), for example warehouse operatives and HGV
                                                                                drivers, care workers, teachers and nurses.

    Sources: See corresponding later sections.                                                                                                       3
BUSINESS
ENVIRONMENT

Businesses in the West of
England
Business concentration                                                                  Business size
There are 46,275 businesses in the West of England. That                                Individuals in the Labour Market are often unaware that
is 400 businesses per 10,000 residents. This is below the                               78% of businesses in the West of England have fewer than five
UK average and in the middle of comparator areas.                                       employees. The results below are similar to those for the UK
                                                                                        overall (78.5%)
Number of businesses per 10,000 people (2020)
                                                                                        Employee size of businesses in the West of England (2019)

                                London                                          593

        Cambridgeshire and Peterborough                                   432

                                     UK                               412

                        West of England                              400

                    Greater Manchester                              369

                          West Midlands                       311

                   Sheffield City Region                    280

                   Liverpool City Region                    277

                            Tees Valley                    261

                                                                                                                                                                        5
                                           Source: ONS Annual Population Survey via NOMIS; Office for National Statistics (ONS) Business; Activity, Size and Location
Volume employers in the region
The West of England has some volume employers with over 1,000 employees, including:

                                                                                      6
Employment by sector
In 2019, the largest employing           Employment by sector (% of total) (2019)
sectors within the West of
England LEP were:

•    Wholesale and retail trade;
     repair of motor vehicles and
     motorcycles (14% of all jobs
     in the region)

•    Human health and social
     work activities (13% of all
     jobs in the region)

•    Professional, Scientific and
     Technical Activities (11% of
     all jobs in the region)

Source: ONS Business Register and Employment Survey via NOMIS                       7
Regional Specialisms & Growth Areas
 The West of England has some specialist industries, which employ more
 people in the region proportionally than the national average. The                             Sector Specialism       National jobs growth %
 adjacent table highlights the sectors where we have employment
 specialisms, alongside whether these sectors are growing or shrinking             Vehicle and Defence Technology                +2%
 nationally. This helps us understand where there are growth
 opportunities, and where there may be a future skills demand; or if a             Civil Engineering                             +6%
 current specialism is at risk due to industry contraction. This is
 particularly relevant during the current pandemic where COVID has                 Utility                                       -3%
 altered or accelerated certain trends.
                                                                                   Education and Knowledge Creation               0%
 Key points:
                                                                                   Government                                    +4%
 •    Civil Engineering is a strength and is growing nationally, as is creative.
      Both are strong contributors to GVA.
                                                                                   Local Environmental Services                  +6%
 •    The West of England has fewer people in professional services than
      the UK average, although London skews this data and it is still a            Creative                                      +4%
      significant contributor to the region’s GVA.
                                                                                   Property Development                          -1%
 •    Given its engineering specialisms, the West of England could have
      opportunities in both Precision Technology and Maritime sectors,             Construction Products and Services            -1%
      which it currently has a below average number of employees in.
                                                                                   Financial and Legal Services                  -8%
 For more information, see appendix ‘Regional Specialisms’

Source: EMSI ‘Strength Finder’ Tool, based on ONS ASHE and BRES Data                                                                    8
Wages in specialist areas
National jobs Difference to West of
Most of the West of England LEP’s specialist growth % (2018- Average Wage (West of England Average Full-
industries pay more than the regional average,
Sector Specialism 2019) England, 2019) time Wage (£31,183)
reflecting their highly skilled nature and
competitiveness. Vehicle and Defence
Technology 2% £41,196 24%
Only Government and Creative have an average
Civil Engineering 6% £38,094 18%
salary lower than that of the regional average.
Utility -3% £45,500 31%
Creative’s reliance on freelancer workers could Education and
potentially mean this underestimates wages in the Knowledge Creation 0% £31,411 1%
sector – it is likely that with these included, the
average wage would be higher. Government 4% £29,110 -7%
Local Environmental
Services 6% £31,481 1%
Creative 4% £30,872 -1%
Property Development -1% £31,611 1%
Construction Products
and Services -1% £37,857 18%
Financial and Legal
Services -8% £36,591 15%
Source: EMSI ‘Strength Finder’ Tool, based on ONS ASHE and BRES Data 9Future Trends: Pre-pandemic Predictions
Shape of the UK Labour Market 2017 – 2027
Working Futures provides a comprehensive and detailed model of the UK labour market and skills needs. It projects the future size and shape of the labour
market by considering employment prospects by industry, occupation, qualification level, gender and employment status.
Areas of growth Areas of Decline Impact of COVID
Sectoral trends in employment • Business Services including • Distribution • Areas of growth are still considered
professional and scientific • Manufacturing accurate
• Health & Social Care • Finance and Insurance • Distribution and construction are no
• Construction longer likely to decline in the short
• Public Admin term, due to policy and demand
changes
Occupational trends • Caring and professional service • Secretarial Occupations • Growth in caring and professional
• Corporate managers and • Plant, Process and Machine service is likely accelerated
directors Operatives • Declining areas could experience
• Business and public service • Skilled Metal and Electronic accelerated decline, although the
associate professionals Trades future of manufacturing remains
uncertain
Replacement Demand – natural Replacement demand amongst all • In the immediate future,
churn and movement within occupational groups is expected to replacement demand is expected to
sectors. generate 7 times more job be less strong than predicted
opportunities than growth • Economic downturn and extensive
uncertainty make it less likely for
individuals to leave their work and
seek new employment
10
Source: Working Futures 2017 - 2027Impact of COVID and recovery by sector
▪ Recovery has occurred in all sectors, though output in most remains down on February’s level.
▪ After the deepest initial fall, accommodation and food recovered strongly until August, fell again in October and November.
▪ Arts, entertainment and recreation and other services both continue to see depressed output.
National monthly GVA change for various sectors from February 2020
120
100
80
60
40
Accomodation & food
20
0
2020 FEB 2020 MAY 2020 AUG 2020 NOV
Wholesale, retail & motors Other services Accomodation & food Financial & insurance
Arts, entertainment & recreation Manufacturing Construction Baseline
Source: ONS GDP estimates, November 2020 11UNEMPLOYMENT, EMPLOYMENT AND REDUNDANCY
Claimant Count
                                                                             Percentage of Working Age Residents Claiming Unemployment
As of December 2020 5.0% of working age population in the
West of England were claiming unemployment benefits
                                                                                                  Related Benefits
                                                                  7.0
(36,840 residents). This is broadly in line with levels seen in
October and November 2020.
                                                                  6.0
There are now 21,065 more claimants in the West of England
than there were in February 2020, before the effects of the
pandemic hit.
                                                                  5.0

The rate in the West of England remains below the national
rate of 6.4% for December 2020. Bristol has the highest rate of
                                                                  4.0
claimants within the LEP, at 6.2% of the working age
population.

                                                                  3.0
December 2020                 Count     % of working age

B&NES                           5,000                   4.0
                                                                  2.0

Bristol                        19,615                   6.2

N.Som                           5,680                   4.6       1.0

S.Glos                          6,540                   3.7
                                                                  0.0
West of England                36,840                   5.0         September December March 2019 June 2019 September December March 2020 June 2020 September
                                                                       2018       2018                           2019     2019                         2020
England                     2,234,335                   6.4            Bath and North East Somerset      Bristol, City of                 North Somerset
                                                                       South Gloucestershire             West of England                  England

                                                                                                                                                         13
Labour Force Survey Unemployment
The Labour Force Survey (LFS) provides estimates on
unemployment in line with ILO definitions, which can provide a
more robust picture of unemployment than the claimant count. It Labour Force Survey: Percentage Unemployment Rate
is only available at South West level. 6
The LFS unemployment rate has been steadily rising since the
start of the COVID pandemic both nationally and in the South
West. 5
The SW region rate was consistently lower than the national rate for
the two ears before COVID, and was 0.8 percentage points lower in
4
January to March 2020. This gap has closed since the pandemic, but
widened again in the September – November period.
Male and female rates have increased similarly between Jan- March 3
and September – November, with increases of 1.0 and 0.8 percentage
points respectively.
South South South
England England England West West West 2
Date male female total male female total
Mar -May 4.3 4.1 4.2 4.0 3.4 3.7
2020
Apr - Jun 4.4 4.0 4.2 4.5 3.3 4.0 1
2020
May -Jul 4.6 4.1 4.4 4.7 3.7 4.2
2020
Jun -Aug 5.1 4.1 4.6 5.3 3.4 4.4 0
2020 Jun 2018-Aug Oct 2018-Dec Feb 2019-Apr Jun 2019-Aug Oct 2019-Dec Feb 2020-Apr Jun 2020-Aug
Jul -Sep 5.4 4.5 4.9 5.3 3.3 4.3 2018 2018 2019 2019 2019 2020 2020
2020 England male England female England total
Aug -Oct 5.5 4.8 5.2 5.5 3.6 4.6 South West male South West female South West total
2020
Sep -Nov 5.6 5.0 5.3 4.8 3.6 4.2 14
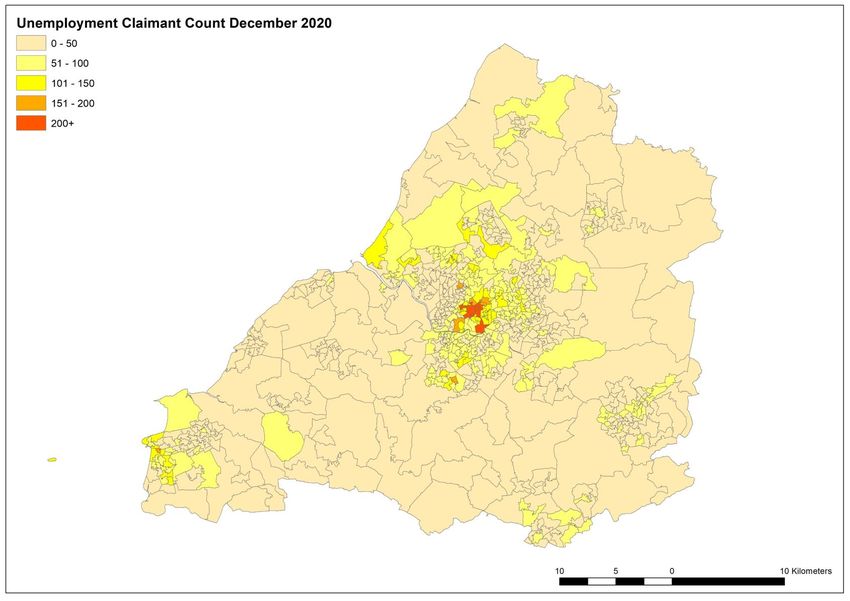
2020 Source: ONS, Labour Force SurveyUnemployment remains highest in areas with high
unemployment pre-covid
15All areas have seen a rise in the number of
claimants
16Indices of Multiple Deprivation –
employment and education
Indices of multiple deprivation (IMD) are widely-used datasets within Employment
the UK to classify the relative deprivation (essentially a measure of
LSOAs in top
poverty) of small areas. Multiple indices of deprivation are provided, Local Authority LSOAs in top 20%
10%
reflecting types of deprivation, which can compiled into a single score
of deprivation.
Bath and North East Somerset 5 1
The employment and education indices are particularly interesting from a
Bristol, City of 65 33
labour market perspective.
North Somerset 20 13
Employment South Gloucestershire 4 0
Every local authority in the West of England LEP has some lower super
output areas that fall in the top 20% most deprived nationally, in terms of
Education
employment deprivation. Bristol has the significant majority, although
North Somerset also has a relatively high number. LSOAs in top LSOAs in top
Local Authority
20% 10%
Education
Every local authority in the West of England LEP has some lower super Bath and North East Somerset 11 7
output areas that fall in the top 20% and top 10% most deprived Bristol, City of 59 40
nationally, in terms of education deprivation. Bristol has the significant North Somerset 12 7
majority at both levels.
South Gloucestershire 18 6
Deprivation by ward, showing how many LSOAs fall into the most
deprived by ward level, is available in the appendix.
Source: Indices of Multiple Deprivation , how these indices are calculated can be found
here
17Salaries over time
Salaries in the West of England LEP are slightly higher than
the national average. In 2020 the West of England average Median Earnings, £ per annum
salary was £26,662 for all workers, 2.3% higher than the national 29,000
average.
28,000
For full-time workers, the average salary was £32,442, and for
part time it was £11,790.
27,000
Full-time working males earned, on average, £7,413 a year
more than full-time working females. 26,000
Males in the West of England LEP also earned slightly more
25,000
than the national average (3.1%). This is was true for females
also, but to a lesser extent (0.7%)
24,000
23,000
Median Salary West of
England LEP, Difference
22,000
Date to National Average Female Male
2014 1.5% 1.2% 2.0%
21,000
2015 3.7% 1.5% 3.0%
2016 1.3% -0.3% 3.2% 20,000
2014 2015 2016 2017 2018 2019 2020
2017 -2.4% -3.2% 1.9%
West of England LEP Bath and North East Somerset
2018 -0.8% -0.1% 1.3%
Bristol, City of North Somerset
2019 0.1% 0.0% 1.5%
South Gloucestershire England
2020 2.3% -0.9% 1.4%
18
Source: ONS, ASHEZero-hours contracts
The number of people in zero hours contacts increased in the South West
region between the April-June 2019 and April-June 2020, from 83,000 to
93,000*. This is broadly in line with increases at a UK level.
Percentage or people on 0 hours contacts, April to June
These numbers equate to 3.6% of female and 2.8% of males working in 0
hour contracts. 6.0
In terms of age, 16-24 year olds are the most likely to work on 0 hours
5.0
contracts, comprising of 9.9% of those employed in this age group.
Such employees are vulnerable during recessions as employers can 4.0
more easily reduce these employees hours to 0.
*Rounded to nearest thousand due to sample size 3.0
2020 2.0
In employment on
a zero-hours Percentage of
contract people on a zero- 1.0
- (thousands) hours contract
A-E Production, including
agriculture 47 4.4 0.0
F Construction 32 3.1
G Wholesale and retail 119 11.3
I Accommodation and food 237 22.6
J-M Information, finance,
professional 56 5.3
N Admin and support services 65 6.2
O Public admin 20 1.9
2019 2020
P Education 101 9.6
Q Health and social work 207 19.7
R,S,T+H Transport, arts, other
Source: ONS Zero-hour contract analysis, based on LFS
services 167 15.9 19
Total 1,052 100.0Furlough ▪ 13.7% of the UK workforce were estimated to remain on furlough leave through the Coronavirus Job Retention Scheme (CJRS), based on the most recent ONS Business Impact of Coronavirus Survey, reflecting the dates between 14 to 27 December 2020. This period coincided with the introduction of tier 4 restrictions for certain areas. ▪ As of 31 December 2020, 60,800 West of England employees were estimated to be on furlough, representing around 11% of those eligible. ▪ Recent Government analysis estimates that 90% of employees who left the CJRS in the UK between April and July this year were still on their original payroll in August. The below table shows the percentage of employees remaining on their original payroll for different sectors in the UK. Source: HMRC Coronavirus statistics, CRJS statistics: secondary analysis, ONS Business insights and impact on the UK economy (14 Jan) 20
Self Employed Income Support
Scheme – Tranche 2
The SEISS supports self-employed individuals and is run in tranches,
with windows within which individuals can apply for grants. Due to                                                    Claim by sector, South West
the way data is received, it is only possible to conduct sector
analyses on individual tranches of the SEISS. This analysis looks at
tranche 2, for which claims were accepted between the                                                             Unknown and other
17/08/2020 and 19/10/2020.                                                       Wholesale and retail trade; repair of motor vehicles…

As of 30 October, 2,034,000 claims had been made to the SEISS                                             Transportation and storage
tranche 2. 39,700 of these were in the West of England LEP.                                                     Real estate activities
Claims by sector is available at a South West level.                         Public administration and defence; compulsory social…

Construction is the largest sector in terms of both number of                         Professional, scientific and technical activities
claims and the total value of claims. The South West construction                                             Other service activities
sector contributed slightly less to the total number of claims than
the England average (31% of claims compared to 35% of claims).                                                          Manufacturing
                                                                                                     Information and communication
That said, in terms in the total financial value of claims, the South
West construction sector contributed more than the England                                   Human health and social work activities
average (42% of total value of claims compared to 38%).
                                                                                                    Financial and insurance activities
Other sectors with a high number of claims are:                                                                             Education

▪   Administrative and support service activities                                                                        Construction

▪   Other services                                                                               Arts, entertainment and recreation
                                                                                                     Agriculture, forestry and fishing
▪   Transport and storage
                                                                                        Administrative and support service activities
▪   Wholesale and retail trade, repair of motor vehicles                                  Accommodation and food service activities
Many claims are not categorised by sector and fall into Unknown                                                                           0%   5%     10%     15%    20%    25%     30%    35%   40%
and other, which reflects the broad nature of self-employed work.
                                                                                                         England propotion of total claims          SW proportion of total claims
    Source: HMRC Self Employed Income Support Scheme Statistics, November 2020
                                                                                                      Data up to 30/10/2021
                                                                                                      Covers only Tranche 2 claims
                                                                                                                                                                                          21
Self Employed Income Support
Scheme by gender
Number of claims and average claim value, by gender
Males make up a greater proportion of Self Employed Income Support £
Claims
Scheme (SEISS) tranche 2 claimants than females – for the West of
England LEP, males comprise of 68.7% of claims to the October
September 2020. 14,000 3,500
This is likely to be driven by the sectors males are more likely to work
12,000 3,000
in, such as construction, which also operates with a high volume of self-
employed people.
10,000 2,500
The average claim made to the scheme is also higher for males than
females. The greatest difference is in South Gloucestershire, which
has the highest average male claim and lowest average female claim, 8,000 2,000
£3,100 and £2,000 respectively.
6,000 1,500
Average Number of Average 4,000 1,000
Number of claim claims claim
LA claims male male female female
2,000 500
Bristol, City of (UA) 12,100 £2,700 5,000 £2,000
0 0
Bath and North East Bristol, City of (UA) Bath and North East North Somerset UA South Gloucestershire
Somerset UA 4,100 £2,900 2,200 £2,100 Somerset UA UA
North Somerset UA 4,600 £2,900 2,400 £2,100
Number of claims male Number of claims female Average claim male Average claim female
South Gloucestershire UA 6,500 £3,100 2,800 £2,000
Data up to 30/10/2021 Source: ONS Self Employed Income Support Scheme Statistics, November 2020
22
Tranche 2 onlyCURRENT LABOUR MARKET DEMAND
Job postings
▪ According to burning-glass analysis tool, there were 12,840 unique                       Job Postings Over Time (West of England)
  job postings advertised in the West of England in December 2020,            18000
  up 85.30% on the year low of April 2020,suggesting recovery in              16000
  terms of available jobs. This is slightly below the levels seen
                                                                              14000
  before the pandemic.
                                                                              12000

▪ The impact of changes in number of jobs available as a result of            10000

  lockdown measures and social distancing became visible in April,             8000
  with significantly fewer jobs advertised. This has risen in last few         6000
  months and is now broadly in line with pre-crises levels.                    4000

                                                                               2000
▪ Comparing the type of jobs advertised by industry, the recovery
                                                                                  0
  has in part been driven by increases in the number of postings in
  IT jobs, as well as human health and social care. Moderate
  recoveries have also been seen in most sectors, although many
  are not yet at pre-pandemic levels.                                                 Top Occupations in December 2020 (West of England)
                                                                              ▪   Programmers and software development professionals (790)
   Job postings levels and associated analytics are highly sensitive to the   ▪   Nurse (493)
   web-scraping tool used. Sensitivity analysis has been undertaken and,
   although levels differ between tools, trends over time are similar –       ▪   Care workers and home carers (427)
   analysing trends rather than totals is therefore advised.                  ▪   Managers and proprietors in other services (358)
                                                                              ▪   Sales related occupations (290)

Source: Labour Insight (BurningGlass)                                                                                                    24
Remote working
Remote working has slowly being growing as in the last few years, in line with economic predictions of a more digitally connected
workforce. This trend has been accelerated by COVID. The graph below shows job postings from West of England LEP based employers
that are remote roles (excluding recruitment agencies, as they may post remote jobs from other regions). This growth has largely been
driven by Professional Service Occupations, including computer programmers, sales professionals and finance.
West of England Job postings including word 'remote'
1,200
1,000
800
600
400
200
0
25
Source: Burning GlassSkills demand
• IT skills feature in the top ‘hard skill’ demands from job adverts. Skills demanded (December 2020) % of postings
These skills are transferable and are useful in both the IT
industry itself, as well as in other industries. Customer Service 14.3%
Teamwork / Collaboration 14.0%
• Financial skills (budgeting and accounting) and healthcare
related skills are also frequently demanded. Other business Budgeting 10.4%
related skills are also frequently demanded, such as business Teaching 10.0%
development, project management and stakeholder
management. Project Management 8.7%
Sales 7.4%
• Customer service and teamwork / collaboration are the most
frequently demanded skill, at 14.3% and 14.0% of adverts Accounting 5.2%
respectively. Software Development 5.1%
• The skills that feature most frequently align with some of the Business Development 4.9%
more resilient sectors to the COVID economic downturn, such Customer Contact 4.8%
as ‘Information and Communication’ , ‘Energy Production’ and
‘Finance and Insurance. Cleaning 4.7%
Stakeholder Management 4.5%
• ‘Soft’ and general employability skills are frequently required
in vacancies. This highlights their importance for those out of Software Engineering 4.4%
work Key Performance Indicators (KPIs) 4.4%
• Many skills fall somewhere in the middle between hard and
soft. For example, Project Management is a frequently sought Working With Patient And/Or Condition: Mental Health 4.3%
after skill, which draws on a combination of soft skills and hard,
subject specific knowledge. Microsoft C# 4.3%
JavaScript 4.2%
• Note: Web-scraping data (Labour Insight) gives us an indication
of skills demand from job adverts. Given that jobs with higher Python 3.8%
turnover (for example, hospitality) recruit more often due to Administrative Support 3.8%
churn in roles, this should be treated indicatively only.
SQL 3.7%
* Out of a total of 12,840 postings
Source: Burning Glass 26Transferrable and commonly sought
Skills
From the evidence available, demand appears to be Top Occupations Advertised
strong for individuals with technology skills, as well as
skills in finance and business.
Occupational Family Job Postings
Many more traditional, more vocational roles also
experience demand, such as those in healthcare,
teaching assistants and education professionals and Software Developer / Engineer 705
carers. Key areas of high-demand skills include:
(1) STEM subjects – these are the basis of many Registered General Nurse (RGN) 387
technological jobs.
(2) Digital/technology skills – these are applicable both Project Manager 316
within the important and resilient IT, creative and
digital sectors, as well as in a variety of other jobs
such as finance and investment roles. Office / Administrative Assistant 295
(3) Specific vocations – training for specific jobs
currently in demand (based on evidence), for Caregiver / Personal Care Aide 230
example warehouse operatives and HGV drivers,
care workers, teachers and nurses.
Teaching Assistant 200
Care assistant 195
Source: Emsi Economic Modelling
27Apprenticeships
Adverts with the word ‘apprenticeship’ experienced a spike in postings leading up to July in the years 2017, 2018 and 2019, in line with
the end of the academic year. In 2020, we have seen the opposite happen, with a downward trend in postings. This has started to
reverse in the months since August, with increases in postings seen every month since.
Sector groups have highlighted the difficulties they are facing regarding keeping on current apprentices, hiring new ones, and the trade
offs between both.
(Note – totals are not comparable to other job postings slides, as a different software is used to obtain apprenticeship postings).
28
Source: Emsi Economic ModellingAPPENDIX
Regional Specialisms
                                                                                                        Location                GVA      National
The West of England has some specialist                                          Sector                 Quotient   % of GVA   Quotient   Change %
industries, which employ more people
                                                                   Vehicle and Defence Technology         1.75      2.79%       1.73       2%
proportionally than the national average, as show
by the Location Quotient (LQ). For example,                        Civil Engineering                      1.45      4.89%       1.30       6%
Vehicle and Defence Technology has an LQ of 1.75,                  Utility                                1.4       1.61%       0.78       -3%
meaning this industry is 1.75 larger than the UK                   Education and Knowledge Creation       1.38      2.74%       1.04       0%
average for an area of the same size.                              Government                             1.36      6.00%       1.36       4%
Looking at this alongside the proportion of GVA                    Local Environmental Services           1.21      0.71%       1.20       6%
these industries deliver, we can see some areas of                 Creative                               1.19      1.72%       0.71       4%
specialisation that deliver a significant proportion               Property Development                   1.14      6.38%       0.84       -1%
of the GVA, for example:
                                                                   Construction Products and Services     1.14      0.21%       1.01       -1%
•   Civil Engineering                                              Financial and Legal Services           1.1       9.80%       0.97       -8%
                                                                   Printing and Publishing                1.08      1.14%       1.15       -7%
•   Education and Knowledge Creation
                                                                   Digital                                1.07      4.98%       0.93       -6%
•   Creative                                                       Health and Care                        1.07      8.44%       1.00       2%
•   Financial and Legal Services                                   Sports and Leisure                     1.05      1.15%       0.65       3%
                                                                   Metalworking Technology                1.04      0.56%       1.32       4%
•   Digital
                                                                   Passenger Transport                    1.03      0.64%       1.09       -1%
                                                                   Food and Beverage                      1.02      4.89%       0.87       2%
                                                                   Automotive Services                    1.01      1.85%       0.96       -2%
                                                                                                                                         30
Source: EMSI ‘Strength Finder’ Tool, based on ONS ASHE and BRES Data
Employment Rate – Time Series
• The employment rate has remained broadly stable since
March 2017.
Percentage of West of England LEP residents aged 16-64
• Males have a consistently higher employment rate than currently employed
females, but the gap has decreased in size since March 2017. 84
• The impact of COVID does not appear to be showing in the 82
employment rates. This is possibly due to sample size and
the fact that it is a ‘year to date’ measure so could flatten
80
trends.
78
Male 16-
Date (12 months to) Residents 16-64 64 Female 16-64
Apr 2016-Mar 2017 78 80.7 75.2 76
Jul 2016-Jun 2017 78.2 81.2 75.3
Oct 2016-Sep 2017 78.5 81.7 75.3 74
Jan 2017-Dec 2017 78.6 82.1 75.1
Apr 2017-Mar 2018 78.1 81.5 74.6
72
Jul 2017-Jun 2018 78.9 82.2 75.5
Oct 2017-Sep 2018 78.4 81.1 75.6
Jan 2018-Dec 2018 79.1 81.6 76.5 70
Apr 2018-Mar 2019 79.5 82.5 76.4
Jul 2018-Jun 2019 79.4 82 76.7
Oct 2018-Sep 2019 79.7 82.3 77
Jan 2019-Dec 2019 78.8 81.3 76.3
Apr 2019-Mar 2020 79 80.7 77.2 Residents 16-64 Male 16-64 Female 16-64
Jul 2019-Jun 2020 78.6 80.9 76.2
Oct 2019-Sep 2020 78.7 80.7 76.6
Source: ONS Annual Population Survey
31Claimants Aged 16-24
As of December 2020 there were 7,405 claimants aged
between 16—24; 4.8% of the population in that age Percentage of residents 16-24 claiming unemployment related
cohort.
benefits
This is broadly in line with the rates in October and 8.0
November 2020, however, represents an increase of 161%
from March 2020 - equating to an additional 4,565 young 7.0
claimants.
All four unitary authorities in the West of England have seen 6.0
a spike in the number of young claimants; ranging from 3.3%
of the cohort in Bath and North East Somerset to 6.4% in 5.0
North Somerset
4.0
Despite the sharp increase in ‘young’ claimants, the rate in
the West of England and the four unitary authority remains
3.0
below the national rate of 7.2%.
December 2020 Count % of age group 2.0
B&NES 1,065
3.3
1.0
Bristol 3,760
5.2
N.Som 1,155 0.0
6.4 July 2018 November March 2019 July 2019 November March 2020 July 2020 November
S.Glos 1,425 2018 2019 2020
4.8
West of England 7,405
4.8 B&NES Bristol North Somerset South Gloucestershire West of England England
England 429,185
7.2
32Claimants Aged 50+
As of December 2020 there were 7,740 claimants aged
50+; 3.9% of the population in that age cohort. Percentage of residents 50+ claiming unemployment related
benefits
This is broadly in line with the rates seen since May 2020, 6.0
however represents an increase of 117% ‘older’ claimants
since March 2020, equating to an additional 4,165 people.
5.0
All four unitary authorities in the West of England have seen
a spike in the number of ‘older’ claimants; ranging from 2.6%
of the cohort South Gloucestershire to 5.4% in Bristol.
4.0
The rate of ‘older’ claimants in the West of England remains
below the national rate of 5.0%; however the rate in Bristol
exceeds the national rate.
3.0
December 2020 Count % of age group
2.0
B&NES 1,215 3.5
Bristol 3,575 5.4
1.0
N.Som 1,505 3.4
S.Glos 1,445 2.6
0.0
July 2018 November March 2019 July 2019 November March 2020 July 2020 November
West of England 7,740 3.9 2018 2019 2020
B&NES Bristol North Somerset South Gloucestershire West of England England
England 532,030 5.0
33Employment Rate
• In the year to September 2020, the employment rate for the
Employed Rate
West of England was 78.7%; higher than the national rate at Group
76.0%. All - aged 50+ 179,500 44.1
• Working age males had an employment rate of 80.7%, 4.1 All - aged 16-24 84,500 61.0
percentage points greater than the rate for working age
females. All - aged 16-64 584,800 78.7
• COVID is expected to reduce the employment rate, but the
Males - aged 50+ 91,900 47.4
sample size of the Annual Population Survey as well as its
‘year to date’ measurement of the data is thought to be
stopping this showing significantly at a regional level Males - aged 16-24 47,100 60.0
• Time series analysis and local authority analysis available in Males - aged 16-64 306,300 80.7
the appendix
Females - aged 50+ 87,600 41.2
Female - aged 16-24 37,400 62.2
Females - aged 16-64 278,500 76.6
Source: ONS Annual Population Survey 2021 34Employment Rate – Oct 2019- Sept
2020
West of Bath and North South
Group England LEP East Somerset Bristol, City of Gloucestershire England
Employment rate - aged 50+ 44.1 43.3 45.8 44.3 42.7
Employment rate - aged 16-24 61.0 60.6 55.0 65.7 53.1
Employment rate males - aged 50+ 47.4 48.3 48.1 47.0 47.0
Employment rate males - aged 16-24 60.0 63.1 55.4 59.5 52.8
Employment rate females - aged 50+ 41.2 38.6 43.5 41.9 38.8
Employment rate females - aged 16-24 62.2 58.0 54.4 72.7 53.4
Employment rate - aged 16-64 78.7 79.7 75.8 81.6 76.0
Employment rate males - aged 16-64 80.7 84.5 76.8 82.6 79.5
Employment rate females - aged 16-64 76.6 74.8 74.6 80.5 72.4
Source: ONS Annual Population Survey;
Note: All data relates covers the 12 month period up to September 2020
35Indices of Multiple Deprivation –
education deprivation
Local Authority District name (2019) Ward LSOA in Ward 20% LSOA in Ward 10%
Bath and North East Somerset Combe Down 1 1
Bath and North East Somerset Keynsham North 1 0
Bath and North East Somerset Keynsham South 1 0
Bath and North East Somerset Peasedown 1 1
Bath and North East Somerset Radstock 1 0
Bath and North East Somerset Southdown 1 1
Bath and North East Somerset Twerton 4 4
Bath and North East Somerset Westfield 1 0
Bristol, City of Ashley 2 0
Bristol, City of Filwood 9 7
Bristol, City of Frome Vale 1 1
Bristol, City of Hartcliffe and Withywood 12 12
Bristol, City of Henbury and Brentry 3 2
Bristol, City of Hengrove and Whitchurch Park 5 2
Bristol, City of Hillfields 3 1
Bristol, City of Horfield 1 0
Bristol, City of Knowle 3 3
Bristol, City of Lawrence Hill 7 5
Bristol, City of Lockleaze 2 2
Bristol, City of Southmead 5 3
36Indices of Multiple Deprivation –
education deprivation cont.
Local Authority District name (2019) Ward LSOA in Ward 20% LSOA in Ward 10%
Bristol, City of St George Central 2 0
Bristol, City of Stockwood 2 2
Bristol, City of Stoke Bishop 1 0
Bristol, City of Windmill Hill 1 0
North Somerset Weston-super-Mare Central 2 1
North Somerset Weston-super-Mare Mid Worle 1 0
North Somerset Weston-super-Mare Milton 2 0
North Somerset Weston-super-Mare South 6 6
North Somerset Weston-super-Mare Winterstoke 1 0
South Gloucestershire Dodington 1 0
South Gloucestershire Emersons Green 1 0
South Gloucestershire Kings Chase 2 1
South Gloucestershire Oldland Common 1 0
South Gloucestershire Parkwall 2 2
South Gloucestershire Patchway 3 1
South Gloucestershire Rodway 3 0
South Gloucestershire Staple Hill 2 1
South Gloucestershire Thornbury South and Alveston 1 0
South Gloucestershire Yate Central 1 0
South Gloucestershire Yate North 1 1
37Indices of Multiple Deprivation –
employment deprivation
LSOA in
Local Authority District name (2019) Ward LSOA in Ward 20% Ward 10%
Bath and North East Somerset Combe Down 1 0
Bath and North East Somerset Southdown 1 0
Bath and North East Somerset Twerton 3 1
Bristol, City of Ashley 2 0
Bristol, City of Avonmouth and Lawrence Weston 5 2
Bristol, City of Bishopsworth 1 0
Bristol, City of Brislington East 2 0
Bristol, City of Brislington West 1 1
Bristol, City of Central 2 2
Bristol, City of Easton 1 0
Bristol, City of Eastville 2 0
Bristol, City of Filwood 7 4
Bristol, City of Frome Vale 2 1
Bristol, City of Hartcliffe and Withywood 11 9
Bristol, City of Henbury and Brentry 2 1
Bristol, City of Hengrove and Whitchurch Park 3 1
Bristol, City of Hillfields 2 1
38Indices of Multiple Deprivation –
employment deprivation cont.
Local Authority District name (2019) Ward LSOA in Ward 20% LSOA in Ward 10%
Bristol, City of Horfield 1 0
Bristol, City of Knowle 2 2
Bristol, City of Lawrence Hill 7 6
Bristol, City of Lockleaze 2 0
Bristol, City of Southmead 4 1
Bristol, City of Southville 1 0
Bristol, City of St George Central 2 0
Bristol, City of Stockwood 2 2
Bristol, City of Stoke Bishop 1 0
Weston-super-Mare
North Somerset Central 6 5
Weston-super-Mare
North Somerset Hillside 2 2
Weston-super-Mare Mid
North Somerset Worle 1 0
Weston-super-Mare
North Somerset Milton 3 0
Weston-super-Mare
North Somerset North Worle 1 0
Weston-super-Mare
North Somerset South 7 6
South Gloucestershire Kings Chase 1 0
South Gloucestershire Patchway 1 0
South Gloucestershire Staple Hill 2 0
39You can also read