Lake Rotorua Treated Wastewater Discharge: Environmental Effects Study Draft Report - Rotorua Te ...
←
→
Page content transcription
If your browser does not render page correctly, please read the page content below
Lake Rotorua Treated Wastewater
Discharge: Environmental Effects Study
             Draft Report

                           2015

                   ERI Report XX

 Draft client report prepared for Rotorua Lakes Council
 By Jonathan Abell1, Chris McBride2, David Hamilton2
                   1. Ecofish Research Ltd.
            2. Environmental Research Institute
            Faculty of Science and Engineering
          University of Waikato, Private Bag 3105
              Hamilton 3240, New Zealand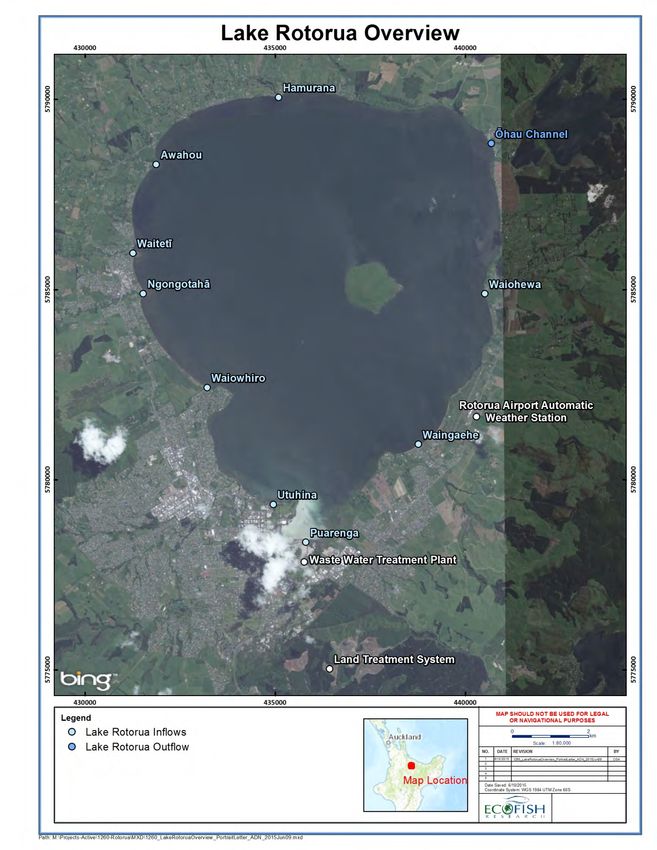
Lake Rotorua Treated Wastewater Discharge: Environmental Effects Study                        Page i

Cite report as:
Abell, J. M., McBride, C. M., Hamilton, D. P. 2015. Lake Rotorua Wastewater Discharge
Environmental Effects Study. Draft client report prepared for discussion at the Rotorua Project
Strategy Group Technical Advisory Group Meeting 16 June 2015. Environmental Research Institute
Report No. XX, The University of Waikato, Hamilton.

Cover: View eastwards across Lake Rotorua.

Reviewed by:                                                   Approved for release by

Research Officer                                               Research Manager
Environmental Research Institute                               Environmental Research Institute
University of Waikato                                          University of Waikato
Lake Rotorua Treated Wastewater Discharge: Environmental Effects Study   Page ii

                                    EXECUTIVE SUMMARY
                                        [To be completed.]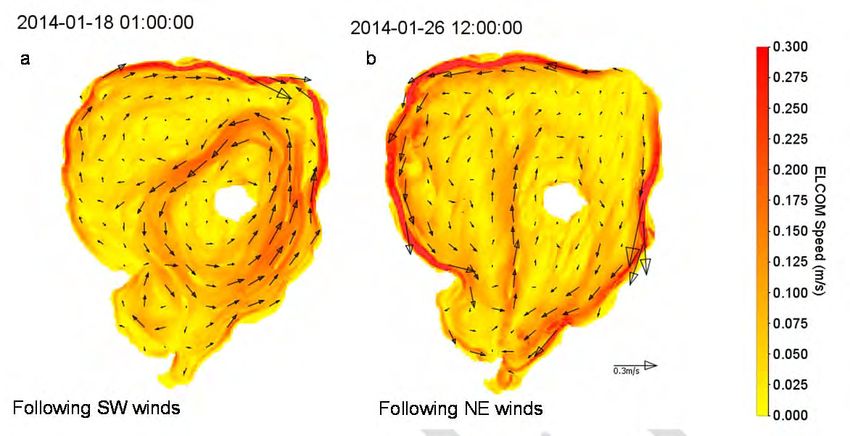
Lake Rotorua Treated Wastewater Discharge: Environmental Effects Study                                                                                                                                     Page iii

                                                                           TABLE OF CONTENTS
EXECUTIVE SUMMARY ......................................................................................................... II
LIST OF FIGURES ..................................................................................................................... V
LIST OF TABLES ................................................................................................................... VIII
LIST OF MAPS........................................................................................................................... XI
LIST OF APPENDICES ............................................................................................................ XI
1.            INTRODUCTION ......................................................................................................... 12
2.            BACKGROUND AND OBJECTIVES ........................................................................ 13
     2.1. LAKE ROTORUA................................................................................................................ 13
       2.1.1. Background ............................................................................................................... 13
       2.1.2. Wastewater discharge in the lake catchment ............................................................ 16
       2.1.3. Proposed options ...................................................................................................... 17
       2.1.4. Objectives of this study ............................................................................................. 20
3.            METHODS ..................................................................................................................... 21
     3.1.  OVERVIEW ........................................................................................................................ 21
     3.2.  MASS BALANCE CALCULATIONS TO ESTIMATE IN–STREAM NUTRIENT LOADS AND
     CONCENTRATIONS ...................................................................................................................... 21
       3.2.1. Treated wastewater nutrient loads............................................................................ 21
       3.2.2. Puarenga Stream background nutrient loads ........................................................... 22
3.2.2.1.      Discharge ...........................................................................................................................................................................................22
3.2.2.2.      Nutrient concentrations...................................................................................................................................................................23
3.2.2.3.      Calculations to estimate in–stream loads and concentrations....................................................................................................24
       3.2.3. Comparison of concentrations with values designated in the NPS 2014 to assess in–
       stream effects on Ecosystem Health ....................................................................................... 25
     3.3. ONE–DIMENSIONAL LAKE MODELLING ............................................................................. 27
       3.3.1. Model selection ......................................................................................................... 27
       3.3.2. Model overview ......................................................................................................... 28
       3.3.3. Model simulation, calibration and validation periods ............................................. 30
       3.3.4. Model configuration.................................................................................................. 31
3.3.4.1.      Bathymetry.........................................................................................................................................................................................32
3.3.4.2.      Meteorological input data ................................................................................................................................................................32
3.3.4.3.      Hydrologic input data ......................................................................................................................................................................32
3.3.4.4.      Inflow water quality ..........................................................................................................................................................................34
        Temperature and dissolved oxygen ........................................................................................ 34
        Nutrient and suspended sediment concentrations .................................................................. 35
3.3.4.5.      Alum dosing ......................................................................................................................................................................................40
        3.3.5.         Model scenarios ........................................................................................................ 41
3.3.5.1.      Baseline and wastewater discharge .................................................................................................................................................41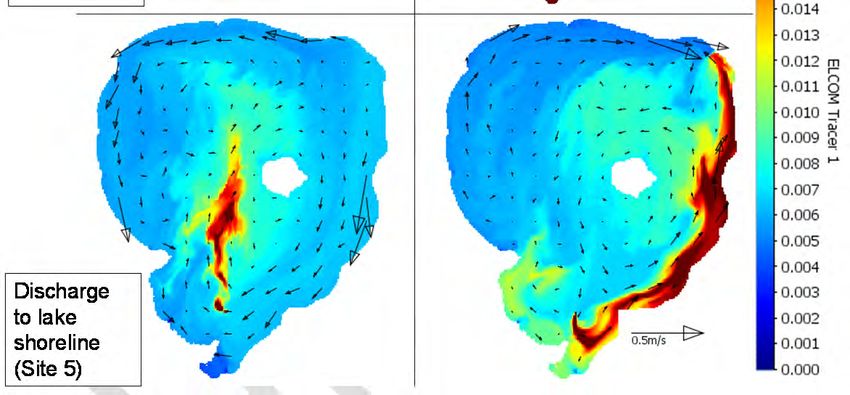
Lake Rotorua Treated Wastewater Discharge: Environmental Effects Study                                                                                                                                          Page iv

3.3.5.2.     Removal of LTS loads and alum dosing .......................................................................................................................................43
3.3.5.3.     Additional scenarios .........................................................................................................................................................................45
       3.3.6. Comparison of scenarios .......................................................................................... 45
     3.4. THREE–DIMENSIONAL LAKE MODELLING.......................................................................... 47
       3.4.1. Model selection ......................................................................................................... 47
       3.4.2. Model overview ......................................................................................................... 47
       3.4.3. Model simulation periods and validation ................................................................. 47
       3.4.4. Model configuration.................................................................................................. 47
       3.4.5. Model scenarios ........................................................................................................ 51
       3.4.1. Comparison of scenarios .......................................................................................... 52
4.           RESULTS ....................................................................................................................... 53
     4.1.  MASS BALANCE CALCULATIONS TO ESTIMATE IN–STREAM NUTRIENT LOADS AND
     CONCENTRATIONS ...................................................................................................................... 53
       4.1.1. Treated wastewater nutrient loads to the Puarenga Stream .................................... 53
       4.1.2. Comparison of concentrations with values designated in the NPS 2014 to assess in–
       stream effects on Ecosystem Health ....................................................................................... 56
4.1.2.1.     Nitrate nitrogen (toxicity) ................................................................................................................................................................56
4.1.2.2.     Ammonium nitrogen (toxicity) .......................................................................................................................................................57
4.1.2.3.     Dissolved oxygen ..............................................................................................................................................................................59
4.1.2.4.     E. coli ...................................................................................................................................................................................................60
4.1.2.5.     Periphyton .........................................................................................................................................................................................62
       4.1.3.         One–dimensional lake water quality modelling ....................................................... 62
       4.1.4.         Calibration and validation........................................................................................ 62
4.1.4.1.     Overview ............................................................................................................................................................................................62
4.1.4.2.     Water level .........................................................................................................................................................................................62
4.1.4.1.     Temperature and dissolved oxygen................................................................................................................................................62
4.1.4.2.     Chlorophyll a and nutrients.............................................................................................................................................................64
4.1.4.3.     TLI3.....................................................................................................................................................................................................66
       4.1.5. Modelled external loads............................................................................................ 68
       4.1.6. Simulated TLI3 for scenarios .................................................................................... 69
       4.1.7. Predicted nutrient limitation status of phytoplankton .............................................. 73
       4.1.8. Comparison of concentrations with values designated in the NPS 2014 to assess in–
       lake effects on Ecosystem Health ........................................................................................... 74
     4.2. THREE–DIMENSIONAL HYDRODYNAMIC MODELLING ........................................................ 74
       4.2.1. Validation of simulated temperature at monitoring buoy ......................................... 74
       4.2.2. Simulated tracer concentrations ............................................................................... 75
5.           DISCUSSION ................................................................................................................. 82
REFERENCES............................................................................................................................ 84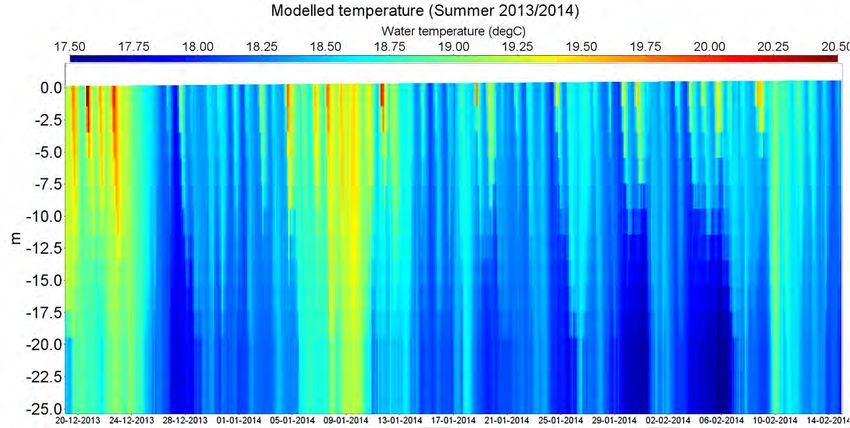
Lake Rotorua Treated Wastewater Discharge: Environmental Effects Study                                                                                  Page v

                                                               LIST OF FIGURES
Figure 1    Annual Trophic Level Index of Lake Rotorua. Data for 2002–2012 are based on
    surface water samples only and thus values may differ slightly from by those used for BoPRC
    monitoring. Sources: 2002–2012 data (Abell et al. 2012); 2013 datum (Rotorua Te Arawa Lakes
    Programme 2014); 2014 datum (http://www.rotorualakes.co.nz/lake_rotorua_facts, accessed 29
    May 2015). .................................................................................................................................................16
Figure 2    Puarenga Stream mean daily discharge, 2007–2014. The dashed blue line denotes the
    mean discharge of treated wastewater for reference. ..........................................................................23
Figure 3     Conceptual diagrams of the cycling of nitrogen (A) and phosphorus (B) within the
    water quality model (CAEDYM). DONL, labile dissolved organic nitrogen; PONL, labile
    particulate organic nitrogen; DOPL, labile dissolved organic phosphorus; POPL, labile
    particulate organic phosphorus. .............................................................................................................30
Figure 4    Relationship between percentage reductions to dissolved reactive phosphorus (PO4–P)
    concentrations and mean monthly aluminium dose in the Puarenga Stream. Data provided by
    BoPRC. 40
Figure 5 Water temperatures assigned to treated wastewater ................................................................43
Figure 6 Hourly mean meteorological data for the summer 2013/14 modelling period. ..................49
Figure 7 Hourly mean meteorological data for the winter 2014 modelling period. ...........................50
Figure 8   Summary of hourly wind measurements at Rotorua Airport Automatic Weather Station,
    2007–2014. ................................................................................................................................................52
Figure 9     Total nitrogen (TN) and dissolved inorganic nitrogen (DIN) loads in the Puarenga
    Stream that correspond to baseline and wastewater discharge scenarios, 2007–2014. Loads for
    each option include baseline loads for the Puarenga Stream. Boxplots show distributions of daily
    loads: notches denote median values; boxes denote 25th and 75th percentiles; whiskers extend up
    to 1.5 times the inter–quartile range. .....................................................................................................54
Figure 10 Total phosphorus (TP) and phosphate–phosphorus (PO4–P) loads in the Puarenga
    Stream that correspond to baseline and wastewater discharge scenarios, 2007–2014. Loads for
    each option include baseline loads for the Puarenga Stream Boxplots show distributions of daily
    loads: notches denote median values; boxes denote 25th and 75th percentiles; whiskers extend
    up to 1.5 times the inter–quartile range. Plots show loads before attenuation of baseline loads
    due to alum dosing. ..................................................................................................................................55
Figure 11 Estimated mean daily nitrate nitrogen concentrations in the Puarenga Stream for
    baseline conditions and following addition of treated wastewater. Dashed lines denote annual
    median values that correspond to Attribute States defined in the National Policy Statement for
    Freshwater Management 2014................................................................................................................56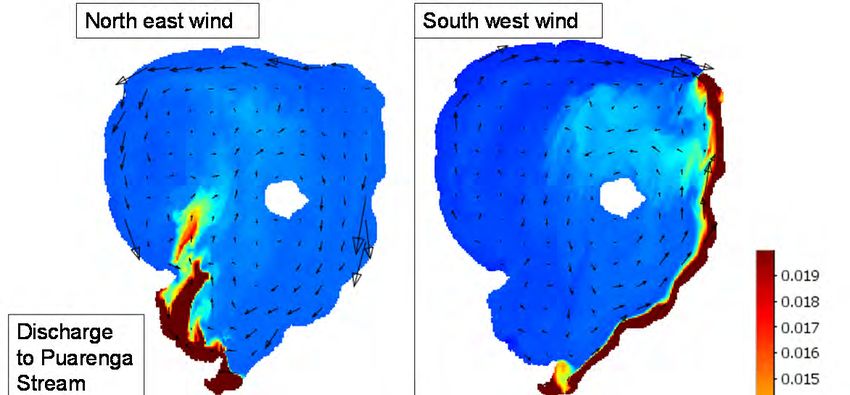
Lake Rotorua Treated Wastewater Discharge: Environmental Effects Study                                                                               Page vi

Figure 12 Estimated mean daily ammonium nitrogen concentrations in the Puarenga Stream for
    baseline conditions and following addition of treated wastewater. Dashed lines denote annual
    median values that correspond to Attribute States defined in the National Policy Statement for
    Freshwater Management 2014................................................................................................................58
Figure 13 Monthly measurements of dissolved oxygen concentration in the lower Puarenga
    Stream collected during November–April by BoPRC (circles), compared with estimated
    concentrations following addition of anoxic wastewater (diamonds). Dashed lines denote 1–day
    minimum values that correspond to Attribute States defined in the National Policy Statement
    for Freshwater Management 2014. ........................................................................................................60
Figure 14 Monthly measurements of E. coli concentration in the lower Puarenga Stream collected
    BoPRC. Dashed lines denote values (defined as both annual median and annual 95th percentile)
    that correspond to Attribute States defined in the National Policy Statement for Freshwater
    Management 2014. ...................................................................................................................................61
Figure 15           Modelled and measured water levels during the 1–D modelling study period ................63
Figure 16 Comparisons of measured (circles) and modelled (line) surface concentrations of
    dissolved oxygen (DO) and temperature. .............................................................................................63
Figure 17     Comparisons of measured (circles) and modelled (line) surface concentrations of
    chlorophyll a and phosphorus fractions. ..............................................................................................64
Figure 18     Comparisons of measured (circles) and modelled (line) surface water nitrogen
    concentrations. ..........................................................................................................................................65
Figure 19 Comparison of modelled and measured annual TLI3. The dashed red line denotes the
    TLI3–adjusted target for Lake Rotorua. ................................................................................................67
Figure 20 Summary of external phosphorus loads used as forcing data in baseline model
    simulations. Puarenga Stream loads do not reflect attenuation by alum. Vertical lines denote
    between–year variations. .........................................................................................................................68
Figure 21 Summary of external nitrogen loads used as forcing data in baseline model simulations.
    Vertical lines denote between–year variations. ....................................................................................69
Figure 22 Change in eight–year mean annual TLI3 for each 1–D scenario (Table 19) relative to the
    baseline simulation (no wastewater added)...........................................................................................71
Figure 23 Nitrogen and phosphorus limitation functions corresponding to the baseline scenario
    with (1D_0) and without (1D_0 - alum) alum dosing effects simulated. ........................................73
Figure 24 Simulated water temperatures at lake monitoring buoy site during summer 2013/2014
    modelling period, 19 December 2013 to 14 February 2014. .............................................................75
Figure 25 Simulated water column average water speed and velocity vectors for two dates in
    Summer 2014. a. 18 January, following a 72–hour period of continuous SW winds, with a mean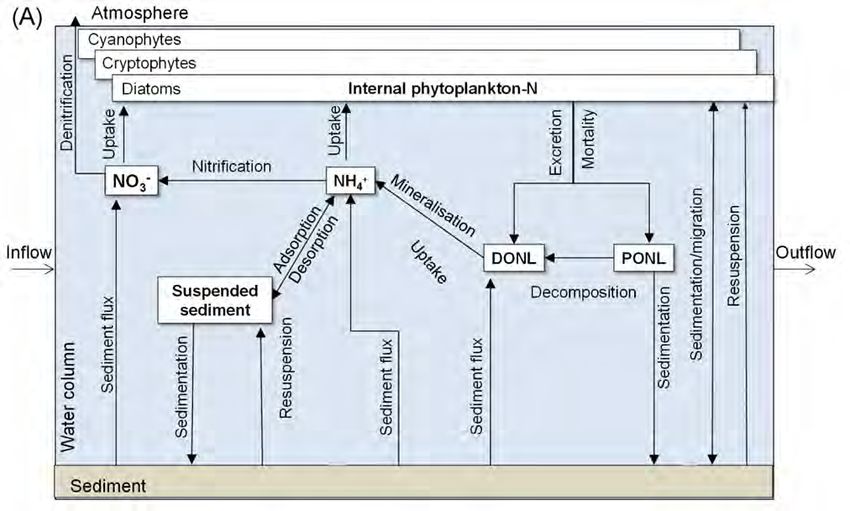
Lake Rotorua Treated Wastewater Discharge: Environmental Effects Study Page vii
hourly speed of 6.2 m/s (maximum = 12.2 m/s). b. 26 January, following a 48–hour period of
continuous NE winds, with a mean hourly speed of 5.6 m/s (maximum = 8.3 m/s; Figure 6)..76
Figure 26 Comparison of simulated tracer concentrations for scenarios of consistent SW (a) and
NE (b) winds during summer. The conservative tracer was assigned a concentration of 10 units,
included in a discharge from a point at the Puarenga Stream mouth. Thus, dark red shading
shows a water column average concentration of ≥ 0.2% treated wastewater. Plots are six weeks
after the simulation started......................................................................................................................78
Figure 27 Comparison of simulated tracer concentrations for scenarios of consistent SW (a) and
NE (b) winds during summer. The conservative tracer was assigned a concentration of 10 units,
included in a discharge from a point 5 km north of the Puarenga Stream mouth. Thus, dark red
shading shows a water column average concentration of ≥ 0.2% treated wastewater. Plots are
six weeks after the simulation started. ...................................................................................................78
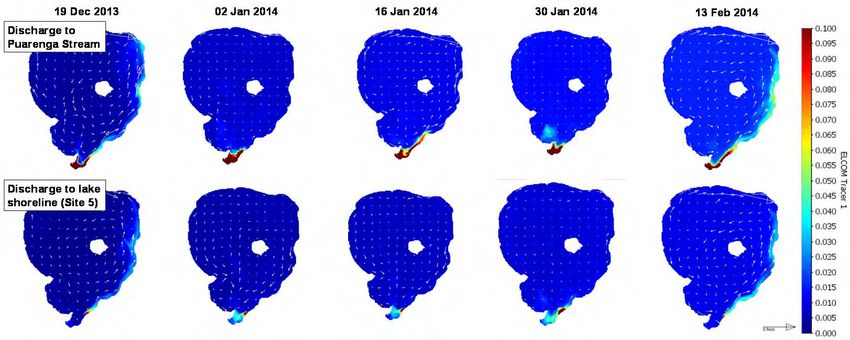
Figure 28 Comparison of simulated tracer concentrations for scenarios of discharge to the
Puarenga Stream and Lake Rotorua shoreline (Site 5; Map 2) during summer 2013/2014. Plots
are at two–week intervals, commencing two–weeks after the simulation started. The
conservative tracer was assigned a concentration of 10 units, thus dark red shows a water
column average concentration of 1% treated wastewater. .................................................................80
Figure 29 Comparison of simulated tracer concentrations for scenarios of discharge to the
Puarenga Stream and the lake (Site 6; Map 2) during summer 2013/2014 with consistent wind
forcing (4 m/s) from the NE or SW. Images are water column average concentrations one
month after the simulation started. The conservative tracer was assigned a concentration of 10
units, thus dark red shows a water column average concentration of 0.2% treated wastewater. .81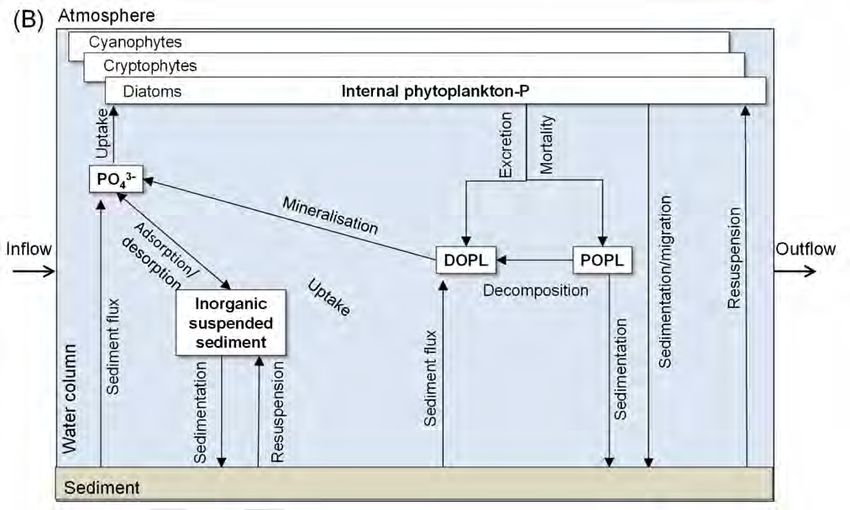
Lake Rotorua Treated Wastewater Discharge: Environmental Effects Study                   Page viii

                                          LIST OF TABLES
Table 1    Proposed tertiary treatment options. Adapted from Table 1.1 in Mott MacDonald (2014).
           18
Table 2 Predicted final treated wastewater composition associated with each tertiary treatment
    option. Adapted from Table 9.1 in Mott MacDonald (2014).                                22
Table 3 Proportion of time (%) when discharge measurements are not available for the Puarenga
    Stream.                                                                                23
Table 4 Summary of methods used to derive baseline hourly mean nutrient concentrations in the
    Puarenga Stream for the period 2007–2014.                                              24
Table 5 Nitrate nitrogen concentrations (mg N/L) corresponding to River Ecosystem Health
    Attribute States designated in the National Policy Statement for Freshwater Management in
    relation to nitrate toxicity (New Zealand Government 2014).                           26
Table 6 Ammoniacal nitrogen concentrations (mg N/L) corresponding to River Ecosystem
    Health Attribute States designated in the National Policy Statement for Freshwater Management
    in relation to ammonia toxicity (New Zealand Government 2014).                             26
Table 7 Dissolved oxygen concentrations corresponding to River Ecosystem Health Attribute
    States designated in the National Policy Statement for Freshwater Management in relation to
    ammonia toxicity (New Zealand Government 2014).                                          27
Table 8 E. coli concentrations corresponding to River Ecosystem Health Attribute States
    designated in the National Policy Statement for Freshwater Management in relation to ammonia
    toxicity (New Zealand Government 2014).                                                  27
Table 9    Model performance statistics                                                        31
Table 10     Summary of how discharge was configured for the inflows and outflow.              34
Table 11     Methods to assign nutrient concentrations to major stream inflows. See glossary for
    definitions of abbreviations.                                                             36
Table 12     Methods to assign nutrient concentrations to minor stream inflows. See glossary for
    definitions of abbreviations.                                                             37
Table 13   Summary of nutrient concentrations assigned to inflows represented in the 1–D model,
    2007–2014.                                                                              39
Table 14     Scenarios simulated using the 1–D model                                           42
Table 15     Summary of mean annual Puarenga Stream nutrient loads for the 1–D model scenarios.
             43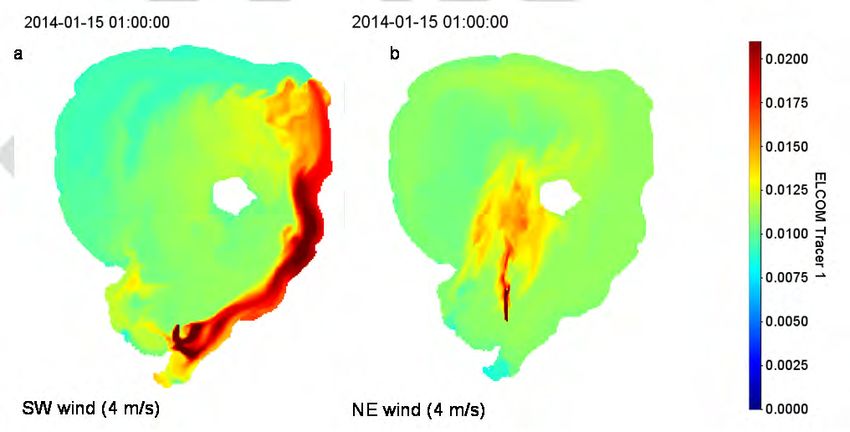
Lake Rotorua Treated Wastewater Discharge: Environmental Effects Study                       Page ix

Table 16     Chlorophyll a concentrations (μg/L) corresponding to Lake Ecosystem Health
    Attribute States designated in the National Policy Statement for Freshwater Management (New
    Zealand Government 2014).                                                                46
Table 17     Total nitrogen concentrations (μg/L) corresponding to Lake Ecosystem Health
    Attribute States designated in the National Policy Statement for Freshwater Management (New
    Zealand Government 2014).                                                                46
Table 18     Total phosphorus concentrations (μg/L) corresponding to Lake Ecosystem Health
    Attribute States designated in the National Policy Statement for Freshwater Management (New
    Zealand Government 2014)                                                                 46
Table 19     Scenarios simulated with the 3–D model                                              51
Table 20     Summary of annual nutrient loads corresponding to the six treatment options.        53
Table 21     Treatment option nutrient loads as a proportion of the external nutrient reduction
    target for Lake Rotorua catchment by 2029 (BoPRC 2009)                                   53
Table 22     Statistics for nitrate nitrogen concentrations based on: month water quality monitoring
    in the Puarenga Stream (2007–2014); estimated concentrations in the Puarenga Stream following
    addition of treated wastewater (2007–2014), and; Attribute States defined in the National Policy
    Statement for Freshwater Management 2014.                                                     57
Table 23    Statistics for ammonium nitrogen concentrations based on: month water quality
    monitoring in the Puarenga Stream (2007–2014); estimated concentrations in the Puarenga
    Stream following addition of treated wastewater (2007–2014), and; Attribute States defined in
    the National Policy Statement for Freshwater Management 2014.                             58
Table 24     E. coli concentrations in the lower Puarenga Stream measured by BoPRC and associated
    Attribute States, as defined in the National Policy Statement for Freshwater Management 2014.
             61
Table 25    Summary of E. coli concentrations following treatment with the current membrane
    bioreactor (K. Brian, pers. comm. 2015b).                                            61
Table 26     Model performance statistics for calibration (2007–2010) and validation (2011–2014)
    periods (chlorophyll a and nutrients).                                                    66
Table 27     Summary of model performance for simulation of annual TLI3.                         67
Table 28    Summary of predicted TLI3 values. Each value is the mean of eight annual TLI3 values
    for 2007–2014.                                                                            70
Table 29     Percentage change in annual TLI3 for each 1–D scenario (Table 19) relative to the
    baseline simulation (no wastewater added) for individual years.                         72
Lake Rotorua Treated Wastewater Discharge: Environmental Effects Study Page x
Table 30 Median surface water concentrations of chlorophyll a, total phosphorus and total
nitrogen for each 1–D scenario (Table 19) for the period 2007–2014, with corresponding
Attribute States based on the National Policy Statement for Freshwater Management 2014. 74Lake Rotorua Treated Wastewater Discharge: Environmental Effects Study Page xi
LIST OF MAPS
Map 1 .................................................................................................................................................................15
Map 2 .................................................................................................................................................................19
LIST OF APPENDICESLake Rotorua Wastewater Discharge: Environmental Effects Study Page 12 1. INTRODUCTION The Environmental Research Institute, University of Waikato led an environmental effects study of proposed options for discharging treated wastewater to Lake Rotorua, Bay of Plenty. The study is intended to inform a decision–making process to resolve how treated municipal wastewater should be discharged after 2019, when irrigation operations at the Land Treatment System in the Whakarewarewa Forest are scheduled to cease. The process is being led by a Project Steering Committee appointed by the Rotorua Lakes Council. Based on the outcomes of this decision making process, the Steering Committee will recommend a preferred disposal option to Rotorua Lakes Council that will be subject to a separate Assessment of Environmental Effects following preliminary design (RLC 2014). The environmental effects study involved undertaking mass balance calculations and environmental modelling to examine water quality effects associated with the proposed options for treated wastewater discharge. The proposed options included either discharge directly to the lake, or to the lower reach of the Puarenga Stream. As such, potential effects to both of these receiving waters were considered.
Lake Rotorua Wastewater Discharge: Environmental Effects Study                                  Page 13

2. BACKGROUND AND OBJECTIVES

2.1. Lake Rotorua
            2.1.1. Background
Lake Rotorua (Map 1) is nationally iconic and represents an important resource for Rotorua,
supporting a range of recreational opportunities that attract tourists to the region. The lake is highly
valued by Māori, and the lake is of particularly high cultural significance to Te Arawa who are the
legal owners of the lake bed.
The lake is large (≈ 80 km2) and volcanically–formed. As a consequence of its relatively shallow
depth (mean depth ≈ 10 m), the lake is polymictic and only stratifies continuously for periods of up
to a few weeks during calm conditions in summer months (November–March). Since the 1960s,
Lake Rotorua has experienced water quality problems associated with eutrophication (Fish 1969;
Rutherford 1984; Rutherford et al. 1989; Burns 2009). This is the process of increased productivity
caused by excessive inputs of nutrients that promote growth of plants, including both
phytoplankton (microscopic plants suspended in the water column) and macrophytes (larger aquatic
plants). The primary nutrients of concern are nitrogen and phosphorus. Symptoms of
eutrophication include: reduced water clarity; depleted dissolved oxygen concentrations in bottom
waters; unsightly blooms of cyanobacteria that may produce toxins; odours, and; extirpation of
species that are adapted to less productive waters (Carpenter et al. 1998). The primary metric used by
Bay of Plenty Regional Council (BoPRC) to monitor trophic status is the Trophic Level Index (TLI),
which integrates annual mean measurements of Secchi depth and concentrations of total nitrogen,
total phosphorus and chlorophyll a (Burns et al. 1999).
In response to public dissatisfaction with water quality, Lake Rotorua has been identified as a
national priority for restoration (Parliamentary Commissioner for the Environment 2006). In 2008,
the Ministry for the Environment committed NZ$72.1 million towards improving water quality in
Lake Rotorua and three other priority lakes. This funding was subsequently matched by BoPRC and
Rotorua Lakes Council (RLC). The Lakes Rotorua and Rotoiti Action Plan (BoPRC 2009) outlines
actions to achieve the Lake Rotorua water quality objective of an annual TLI of 4.2, which
corresponds to the lower end of the eutrophic range (4–5; Burns et al. 1999). A range of actions is
underway and an improvement in water quality has occurred in recent years relative to the early– and
mid–2000s (Figure 1), which were characterised by frequent blooms of cyanobacteria during
summer and autumn (Abell et al. 2012; Hamilton et al., 2015). As a result, annual TLI since 2011 has
either been achieved or been very close to the target (Figure 1). This improvement has occurred in
association with operations to dose aluminium sulphate (alum) near the mouths of the Utuhina and
Puarenga streams, two major stream inflows to the lake. Aluminium ions in alum chemically bind
with phosphate, removing it from the water column and thereby reducing the amount of
phosphorus that is available for primary production. Dosing has been undertaken on a near–daily
basis since operations began in the Utuhina Stream in mid–2006, with dosing also undertaken in the
Puarenga Stream since 2010. Recent modelling work has shown that the TLI target would have been
Lake Rotorua Wastewater Discharge: Environmental Effects Study Page 14 exceeded in recent years without the application of alum (Hamilton et al. 2015). Furthermore, this work indicates that alum is not only reducing dissolved reactive phosphorus concentrations in the inflows, but is also causing further phosphorus flocculation in the lake as excess alum is transported downstream of the dosing plant.
Lake Rotorua Wastewater Discharge: Environmental Effects Study   Page 15

           Map 1
Lake Rotorua Wastewater Discharge: Environmental Effects Study Page 16
5.5
5
TLI
4.5
TLI target = 4.2
4
3.5
2002 2003 2004 2005 2006 2007 2008 2009 2010 2011 2012 2013 2014
Figure 1 Annual Trophic Level Index of Lake Rotorua. Data for 2002–2012 are based on
surface water samples only and thus values may differ slightly from by those used for
BoPRC monitoring. Sources: 2002–2012 data (Abell et al. 2012); 2013 datum
(Rotorua Te Arawa Lakes Programme 2014); 2014 datum
(http://www.rotorualakes.co.nz/lake_rotorua_facts, accessed 29 May 2015).
2.1.2. Wastewater discharge in the lake catchment
Prior to the 1990s, municipal wastewater was discharged to the lake, contributing a significant source
of nitrogen and phosphorus. Sewage–derived inputs were attributed to periods of water quality
decline in the 1970s and 1980s (Rutherford 1984; Rutherford et al. 1989), with sewage inputs
contributing to accumulation of nutrients (particularly phosphorus) in the bed sediments, in
association with inputs from other sources such as farmland. These accumulated nutrients
contribute to internal loading as they are recycled within the water column, particularly during
stratified periods in the summer (White et al., 1978; Burger et al., 2007). The magnitude of such
internal loads of nitrogen and phosphorus is comparable to external loads from the lake catchment
(Burger et al., 2007).
In 1991, discharge of treated municipal wastewater from Rotorua Wastewater Treatment Plant
(WWTP) to the lake ceased. Instead, spray–irrigation of treated wastewater commenced at the Land
Treatment System (LTS), located in the Whakarewarewa Forest to the south of the lake (Map 1).
The forest is in the Waipa Stream catchment, which is a tributary of the Puarenga Stream. Rotorua
Lakes Council currently has a Resource Consent to discharge 30 tonnes of nitrogen and three tonnes
of phosphorus per annum via the LTS. Monitoring of the Waipa Stream shows that nitrogen loads
frequently exceed the consent limit by a moderate amount, while phosphorus loads are typically well
within the limit. Mean five-year loads for 2007–2011 were 35 t N/y and 1.7 t P/y (A. Lowe, pers.
comm. 2013). Monitoring of the Puarenga Stream 2 km upstream of the lake since 1992 shows thatLake Rotorua Wastewater Discharge: Environmental Effects Study Page 17
dissolved inorganic nitrogen concentrations steadily increased over a period of approximately 10
years since operations began at the LTS, with current concentrations (~0.95 mg N/L) approximately
2.5–fold greater than those measured in 1992–1993. Compared with nitrogen, base flow phosphorus
concentrations have remained relatively consistent in the Puarenga Stream, and have not exhibited a
marked increase in response to the LTS operations.
2.1.3. Proposed options
The current Resource Consent for the LTS expires in 2021 and Rotorua Lakes Council (RLC) are
examining the use of an alternative wastewater disposal system. The proposed system involves
various options of discharging treated wastewater directly to receiving waters (Mott Macdonald
2014). The options involve permutations of different:
1) enhancements to wastewater treatment;
2) wastewater discharge locations;
3) discharge arrangements.
Six options for enhanced wastewater treatment are proposed. The options involve varying grades of
treatment to enhance the removal of nitrogen and phosphorus from the wastewater relative to
current treatment performance (Table 1).
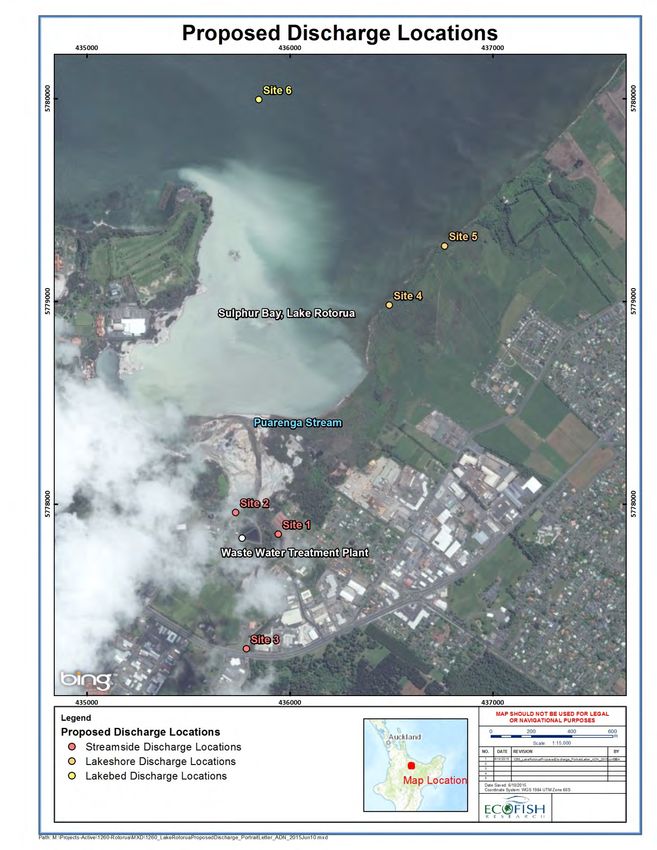
The potential treated wastewater discharge locations are:
1) in the lower reach of the Puarenga Stream;
2) along the shore of Lake Rotorua close to the mouth of the Puarenga Stream;
3) on the bed of the lake.
Six potential locations for discharge to either the Puarenga Stream or the lake shore have been
identified (Map 2). No specific location has been identified for the option of lake bed discharge.
The potential discharge arrangements under consideration are:
1) rock passage to direct discharge;
2) wetland;
3) rapid infiltration beds (RIB);
4) riparian/gabions;
5) pond.Lake Rotorua Wastewater Discharge: Environmental Effects Study Page 18
Table 1 Proposed tertiary treatment options. Adapted from Table 1.1 in Mott
MacDonald (2014).
Option Description Sub-options Details
1 Base option - Upgrades to current tertiary treatment by
addition of: flow balancing, P removal with
chemical addition (alum) and UV disinfection.
2 Base option + basic filtration i. Disk filter Addition of filtration to remove solids,
ii. Sand filter including particulate N and P.
iii. Membrane filter
3 Base Option + filtration + i. Denitrifying sand filter Addition of filtration to remove solids, in
denitrifying filter/bed ii. Sand filter + addition to final denitrification step to convert
denitrifying carbon bed dissolved inorganic N to atmospheric N gas.Lake Rotorua Wastewater Discharge: Environmental Effects Study Page 19
Map 2Lake Rotorua Wastewater Discharge: Environmental Effects Study Page 20
2.1.4. Objectives of this study
The aim of this study is to assess the effects of the proposed wastewater discharge options on the
water quality of Lake Rotorua and the lower reach of the Puarenga Stream. Specifically, the study
examines:
the potential instream ecological effects of discharging treated wastewater to the lower
reaches of the Puarenga Stream;
the potential effects of the proposed options on the trophic status of Lake Rotorua over
multiple years;
how mixing processes may affect how treated wastewater is transported and dispersed
throughout the lake, depending on the discharge location.Lake Rotorua Wastewater Discharge: Environmental Effects Study Page 21
3. METHODS
3.1. Overview
Three main techniques were used to inform the assessment:
1) Mass balance calculations. Nutrient loads were estimated for the treatment options. These were
compared with estimated background loads in the Puarenga Stream to quantify how loads in
the stream are expected to change, and to inform assessment of potential in–stream effects
of nutrient enrichment. Estimated loads were subsequently used as forcing data to ‘drive’
the water quality model introduced below.
2) One–dimensional (1–D) lake modelling. A numerical model was configured to simulate the water
quality effects of discharging treated wastewater, relative to a baseline period that represents
current conditions. The lake was conceptualised as a single vertical profile in the model, i.e.,
vertical differences in water quality were modelled but horizontal variations were not. This
1–D assumption permitted lake processes to be sufficiently simplified so that potential
effects on lake trophic status over time scales of multiple years could be examined.
3) Three–dimensional (3–D) lake modelling. A 3–D hydrological model was configured to examine
the mixing processes that control how simulated treated wastewater inputs are transported
within the lake.
3.2. Mass balance calculations to estimate in–stream nutrient loads and concentrations
3.2.1. Treated wastewater nutrient loads
The nutrient loads associated with each proposed treatment option were calculated based on
information provided by Mott Macdonald (2014; Table 2). The predicted composition of the
wastewater reflects upgrades to current tertiary treatment processes at the WWTP that will result in a
range of improvements to the final wastewater quality. Predictions of treated wastewater
composition are based on a ‘combined’ stream that integrates outputs from both the Bardenpho and
membrane bioreactor systems. Details of any temporal variability in either wastewater discharge or
composition were not provided, and therefore the assessment was based on the assumption that
wastewater composition remains constant.Lake Rotorua Wastewater Discharge: Environmental Effects Study Page 22
Table 2 Predicted final treated wastewater composition associated with each tertiary
treatment option. Adapted from Table 9.1 in Mott MacDonald (2014).
Option Sub-option Discharge (ML/d) Final effluent composition (mg/L)
TP DRP PP TN PON DON NO3-N NH4-N
Option 1 (base option) 23.81 0.72 0.10 0.62 5.44 1.07 1.09 2.99 0.29
Option 2 (base + basic i. Disc filter 23.81 0.37 0.10 0.27 4.86 0.49 1.09 2.99 0.29
filtration) ii. Sand filter 23.81 0.20 0.10 0.10 4.62 0.25 1.09 2.99 0.29
iii. Membrane filter 23.81 0.10 0.10 0.00 4.37 0.00 1.09 2.99 0.29
Option 3 (base + basic i. Denitrifying sand filter 23.81 0.20 0.10 0.10 2.63 0.25 1.09 1.00 0.29
filtration + denitrifying ii. Sand filter + 23.81 0.20 0.10 0.10 3.63 0.25 1.09 2.00 0.29
filtration) denitrifying carbon bed
3.2.2. Puarenga Stream background nutrient loads
Nutrient loads in the Puarenga Stream were estimated for the baseline period of 2007 through 2014.
Reasons for selection of this baseline period are discussed in Section 3.3.3 below.
3.2.2.1. Discharge
Discharge data for the Puarenga Stream were provided by BoPRC. Data for the period 2007
through 2010 were collected at the FRI gauge situated 2.1 km upstream of Lake Rotorua. Data for
the period 2011 through 2014 were collected at the SH 30 gauge situated 0.8 km further
downstream. There are no tributaries between the gauges and the data from the two sites were
considered directly comparable. Discharge was recorded every 15 minutes (see BoPRC 2007 for
quality assurance details). Measured data were available for 98.2% of the monitoring period (Table
3). All gaps in the record were filled using the following linear relationship (r2 = 0.75, RMSE = 0.62
m3/s):
1.01 ∙ 1.1301
where QPuarenga is mean hourly discharge (m3/s) in the Puarenga Stream and QUtuhina is mean hourly
discharge (m3/s) in the Utuhina Stream, measured at the Depot Street gauge. Data are shown in
Figure 2.Lake Rotorua Wastewater Discharge: Environmental Effects Study Page 23
Table 3 Proportion of time (%) when discharge measurements are not available for
the Puarenga Stream.
Year % Gaps > 1 day
2007 2.3 ~3 days (July), ~2 days (September)
2008 11.5 ~27 days (July), ~4 days (September)
2009 0.1
2010 0.0
2011 0.0
2012 5.5 ~15 days (July/August)
2013 0.0
2014 0.0
20
Mean daily discharge (m /s)
3
15
10
5
2007 2008 2009 2010 2011 2012 2013 2014 2015
Figure 2 Puarenga Stream mean daily discharge, 2007–2014. The dashed blue line
denotes the mean discharge of treated wastewater for reference.
3.2.2.2. Nutrient concentrations
Water quality data used to estimate baseline nutrient loads were primarily obtained from BoPRC.
These data are based on monthly grab samples collected at the FRI gauge (now inactive) during
2007 through 2014. Additional data collected following storm events (Abell et al. 2013) were used to
derive relationships between discharge and concentrations of nutrient fractions that are correlated
with discharge.
Table 4 summarises the methods used to estimate baseline hourly mean nutrient concentrations.
Linear interpolation of monthly measurements was used to estimate daily concentrations of nitrate,
ammonium and dissolved reactive phosphorus. This was deemed suitable as concentrations ofLake Rotorua Wastewater Discharge: Environmental Effects Study Page 24
dissolved nutrient fractions are generally invariant with discharge in the Puarenga Stream.
Concentrations of nitrate are a partial exception as they typically exhibit decreases during high
discharge (dilution effect), although these are generally balanced by subsequent ‘pulses’ of elevated
concentrations that are of approximate equal magnitude to the prior decreases.
For periods of hourly mean discharge > 3.0 m3/s, concentrations of both particulate phosphorus
and the non–dissolved inorganic nitrogen (DIN) fraction (i.e., TN-DIN) were estimated using linear
(log10–log10 space) relationships between concentration and discharge. Such relationships were
weaker for discharge < 3.0 m3/s, and thus linear interpolation was used to estimate concentrations
of these analytes for these periods. The sum of total dissolved phosphorus minus dissolved reactive
phosphorus was assumed to be zero (i.e., dissolved organic phosphorus was assumed to be
negligible).
Table 4 Summary of methods used to derive baseline hourly mean nutrient
concentrations in the Puarenga Stream for the period 2007–2014.
Analyte Estimation method Notes
PO 4-P Linear interpolation of monthly measurements collected by BoPRC. Missing measurements (n = 3) replaced with the mean of concentrations
measured in that year.
PP Q < 3 m3/s: Linear interpolation of monthly measurements collected by Measured PP was calculated as TP minus PO 4-P.
BoPRC. Relationship was based on data presented in Abell et al . (2013), collected
Q > 3 m3/s: Derived from a linear relationship between log10Q and when dischage was 3.0 to 15.6 m3/s (maximum PP = 0.44 mg/L). Maximum
mean hourly discharge for 2007-2014 was 30.4 m3/s; maximum modelled
log10[PP] with correction for log-transformation bias (Ferguson 1986).
mean hourly [PP] was 0.51 mg/L.
TP By calculation. PO 4-P + PP
NO x-N Linear interpolation of monthly measurements collected by BoPRC. Missing (n = 2) and anomalously low (n = 3) measurements replaced with
the mean of concentrations measured in that year.
NH4-N Linear interpolation of monthly measurements collected by BoPRC. Missing measurements (n = 4) replaced with the mean of concentrations
measured in that year.
(TN-DIN) Q < 3 m3/s: Linear interpolation of monthly measurements collected by This fraction includes dissolved (i.e., filterable) organic nitrogen (DON) and
BoPRC. particulate nitrogen (PN).
Q > 3 m3/s: Derived from a linear relationship between log10Q and
log10[TN-DIN] with correction for log-transformation bias (Ferguson
1986).
DON 0.40 × (TN-DIN) Based on the mean proportion of (TN-DIN) that comprised (TDN-DIN) in
80 samples collected during three storm events (Abell et al . 2013). There was
no correlation between this proportion and Q.
PN 0.60 × (TN-DIN) Based on the mean proportion of (TN-DIN) that comprised (TN-TDN) in 80
samples collected during three storm events (Abell et al . 2013). There was no
correlation between this proportion and Q.
TN By calculation. NO x-N + NH4-N + DON + PN
3.2.2.3. Calculations to estimate in–stream loads and concentrations
Daily nutrient loads in the Puarenga Stream and the various proposed treated wastewater discharges
were calculated as
∙∑ ∙Lake Rotorua Wastewater Discharge: Environmental Effects Study Page 25
where Lx is load (kg/d) of nutrient x, K is a unit conversion factor, is estimated mean
3
concentration (mg/L) of nutrient x during hour i, and Qi is mean discharge (m /s) for hour i. Daily
loads were summed to calculate annual loads (t/y).
Loads for individual treatment options were compared with the nutrient reduction targets that have
been set for Lake Rotorua (BoPRC 2009), in addition to the baseline loads in the Puarenga Stream
to place the loads in context of downstream waters.
Daily mean nutrient concentrations that corresponded to combined Puarenga Stream and
wastewater loads were estimated by dividing combined loads by the combined discharge. Thus,
these estimated concentrations do not reflect any non–conservative processes such as uptake by
plants or denitrification. The potential for such processes to influence nutrient concentrations in the
Puarenga Stream downstream of the proposed stream discharge locations is limited given the short
length (and thus residence time) of this reach (Map 2).
3.2.3. Comparison of concentrations with values designated in the NPS 2014 to assess
in–stream effects on Ecosystem Health
The National Policy Statement for Freshwater Management 2014 (New Zealand Government 2014)
designates values for a range of attributes that correspond to different Ecosystem Health Attribute
States. Attribute States range from A (high ecosystem health) to D (low ecosystem health). Values
corresponding to the ‘National Bottom Line’ have also been defined, which correspond to the
minimum acceptable state that has been set by the government. Separate values have been defined
for different aquatic ecosystems types. For rivers, values have been defined for the following
attributes: nitrate (with respect to toxicity effects), ammonium (with respect to toxicity effects),
dissolved oxygen, E. coli and periphyton.
Potential effects of the proposed options in relation to nitrate, ammonium and dissolved oxygen
concentrations were assessed quantitatively by comparing baseline concentrations in the Puarenga
Stream with estimated concentrations following addition of separate wastewater discharges
corresponding to the six treatment options (Table 2). These differences were then considered in the
context of Ecosystem Health Attribute State values for these analytes, which are reproduced in
Table 5, Table 6 and Table 7. For nitrate and ammonium, these assessments were based on the time
series of daily mean concentration data that were derived for each modelling scenario (described
further in Section 3.3.4.4 below). For dissolved oxygen, the assessment was based on comparing
monthly measurements collected by BoPRC in the lower Puarenga Stream with concentrations that
were estimated for corresponding days for a scenario of anoxic wastewater discharge (i.e., a worst
case scenario). Concentrations for this scenario were estimated using daily mean discharge data for
the Puarenga Stream (Figure 2) and assuming conservation of mass. Degassing due to temperature
effects was not considered.
Potential effects of the proposed options in relation to E. coli concentrations were assessed semi–
quantitatively by determining the corresponding Ecosystem Health Attribute States (see Table 8) forLake Rotorua Wastewater Discharge: Environmental Effects Study Page 26
each year in the baseline period using data collected by BoPRC, and considering these in the context
of likely effluent composition.
Potential effects of the proposed options in relation to periphyton were assessed qualitatively, based
on consideration of potential increases to nutrient concentrations and consequent implications for
bottom–up effects on periphyton.
Table 5 Nitrate nitrogen concentrations (mg N/L) corresponding to River Ecosystem
Health Attribute States designated in the National Policy Statement for
Freshwater Management in relation to nitrate toxicity (New Zealand
Government 2014).
Attribute state Numeric attribute state Narrative attribute state
Annual median Annual 95th percentile
A ≤ 1.0 ≤ 1.5 High conservation value system. Unlikely to be effects even on sensitive species.
B > 1.0 and ≤ 2.4 >1.5 and ≤ 3.5 Some growth effect on up to 5% of species.
C > 2.4 and ≤ 6.9 > 3.5 and ≤ 9.8 Growth effects on up to 20% of species (mainly sensitive species such as fish).
National bottom line 6.9 9.8 No acute effects.
Impacts on growth of multiple species, and starts approaching acute impact level
D > 6.9 > 9.8
(i.e. risk of death) for sensitive species at higher concentrations (> 20 mg N/L).
Table 6 Ammoniacal nitrogen concentrations (mg N/L) corresponding to River
Ecosystem Health Attribute States designated in the National Policy
Statement for Freshwater Management in relation to ammonia toxicity (New
Zealand Government 2014).
Attribute state Numeric attribute state Narrative attribute state
Annual median Annual 95th percentile
A ≤ 0.03 ≤ 0.05 High conservation value system. Unlikely to be effects even on sensitive species.
B > 0.03 and ≤ 0.24 >0.05 and ≤ 0.40 Some growth effect on up to 5% of species.
C > 0.24 and ≤ 1.3 > 0.40 and ≤ 2.20 Growth effects on up to 20% of species (mainly sensitive species such as fish).
National bottom line 1.3 2.2 No acute effects.
Impacts on growth of multiple species, and starts approaching acute impact level
D > 1.30 > 2.20
(i.e. risk of death) for sensitive species at higher concentrations (> 20 mg N/L).Lake Rotorua Wastewater Discharge: Environmental Effects Study Page 27
Table 7 Dissolved oxygen concentrations corresponding to River Ecosystem Health
Attribute States designated in the National Policy Statement for Freshwater
Management in relation to ammonia toxicity (New Zealand Government
2014).
Attribute state Numeric attribute state Narrative attribute state
7-day mean minimum (1 Nov to 30 April) 1-day minimum (1 Nov to 30 April)
No stress caused by low dissolved oxygen on any aquatic organisms that are
A ≥ 8.0 ≥ 7.5
present at matched reference (near-pristine) sites.
Occasional minor stress on sensitive organisms caused by short periods (a few
B ≥ 7.0 and ≤ 8.0 ≥ 5.0 and < 7.5 hours each day) of lower dissolved oxygen. Risk of reduced abundance of
sensitive fish and macroinvertebrate species.
C ≥ 5.0 and ≤ 7.0 ≥ 4.0 and < 5.0 Moderate stress on a number of aquatic organisms caused by dissolved oxygen
levels exceeding preference levels for periods of several hours each day. Risk of
National bottom line 5.0 4.0
sensitive fish and macroinvertebrate species being lost.
Significant, persistent stress on a range of aquatic organisms caused by dissolved
D < 5.0 < 4.0 oxygen exceeding tolerance levels. Likelihood of local extinctions of keystone
species and loss of ecological integrity.
Table 8 E. coli concentrations corresponding to River Ecosystem Health Attribute
States designated in the National Policy Statement for Freshwater
Management in relation to ammonia toxicity (New Zealand Government
2014).
Attribute state Numeric attribute state Narrative attribute state
7-day mean minimum (1 Nov Statistic
to 30 April; /100 mL)
People are exposed to a very low risk of infection (less than 0.1% risk) from
Annual median contact with water during activities with occasional immersion and some
A ≤ 260 ingestion of water (such as wading and boating).
People are exposed to a low risk of infection (up to 1% risk) when undertaking
95th percentile
activities likely to involve full immersion.
People are exposed to a low risk of infection (less than 1% risk) from contact with
Annual median water during activities with occasional immersion and some ingestion of water
(such as wading and boating).
B > 260 ≤ 540
People are exposed to a moderate risk of infection (less than 5% risk) when
95th percentile undertaking activities likely to involve full immersion. 540 / 100 mL is the
minimum acceptable state for activities likely to involve full immersion.
People are exposed to a moderate risk of infection (less than 5% risk) from
C > 540 ≤ 1000 Annual median
contact with water during activities with occasional immersion and some
ingestion of water (such as wading and boating). People are exposed to a high risk
of infection (greater than 5% risk) from contact with water during activities likely
National Bottom Line 1000 Annual median
to involve immersion
People are exposed to a high risk of infection (greater than 5% risk) from contact
D > 1000 Annual median with water during activities with occasional immersion and some ingestion of
water (such as wading and boating).
3.3. One–dimensional lake modelling
3.3.1. Model selection
The 1–D model DYRESM–CAEDYM was selected. The model comprises a hydrodynamic model
(DYRESM1) that is coupled to a water quality model (CAEDYM2). DYRESM predicts the vertical
1 DYnamic REservoir Simulation ModelYou can also read