LANCASTER COUNTY & CITY - City of Lancaster, PA
←
→
Page content transcription
If your browser does not render page correctly, please read the page content below
LANCASTER COUNTY & CITY

     2021                   Analysis of Impediments to Fair Housing Choice

City of Lancaster                       Lancaster County Redevelopment Authority
120 N. Duke Street                      28 Penn Square, Suite 200
Lancaster, PA 17602                     Lancaster, PA 17603
www.cityoflancasterpa.com               www.lchra.com
717.299.4743                            717.394.0793

                                   Draft – February 2021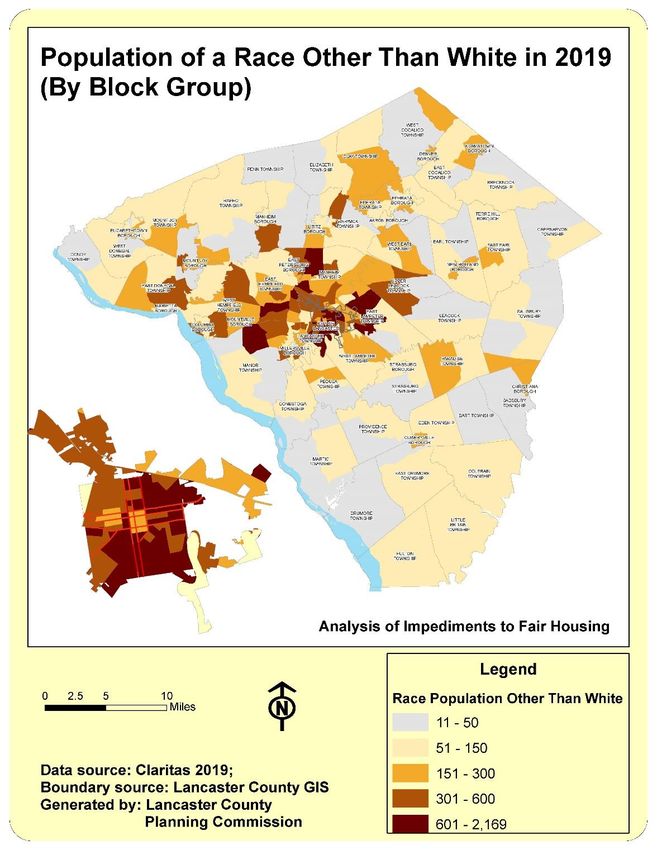
Analysis of Impediments to Fair Housing Choice
                    Lancaster County and City of Lancaster, Pennsylvania
                                     Table of Contents

I.     Introduction to the Analysis of Impediments to Fair Housing Choice ..................... 1
        A. Methodology ................................................................................................... 2
        B. Development of the Plan................................................................................. 3
        C. Definitions ....................................................................................................... 5
II.    Data Analysis ........................................................................................................... 7
       A. Background information ................................................................................... 7
          1. Overview of Lancaster County and City of Lancaster ................................. 7
          2. Demographics Data................................................................................... 12
              a. Population ........................................................................................... 12
              b. Households and Families .................................................................... 13
              c. Age Distribution .................................................................................. 15
              d. Religion................................................................................................ 17
              e. National Origin and Linguistic Isolation .............................................. 17
              f. Race and Ethnicity............................................................................... 19
              g. Persons with Disabilities ..................................................................... 24
              h. Income ................................................................................................ 27
              i. Employment ........................................................................................ 34
          3. Housing Data ............................................................................................. 37
              a. Tenure ................................................................................................. 37
              b. Type of Housing .................................................................................. 39
              c. Age of Housing .................................................................................... 39
              d. Cost Burden......................................................................................... 40
              e. Cost of Housing ................................................................................... 45
              f. Vacancy ............................................................................................... 46
              g. Subsidized/Assisted Housing .............................................................. 47
III.   Evaluation of Current Fair Housing Legal Status................................................... 51
       A. Existence of Fair Housing Complaints ............................................................. 51
       B. Public Sector ................................................................................................... 52
          1. Funding ..................................................................................................... 52
          2. Planning, Zoning and Building Codes ........................................................ 53
          3. Property Taxes .......................................................................................... 55
          4. Affirmative Marketing Policy .................................................................... 57
          5. Public Transportation................................................................................ 57
          6. Policies Affecting the Location of Subsidized Housing ............................. 58
          7. Accessibility of Residential Housing Stock ................................................ 58

                                                                   1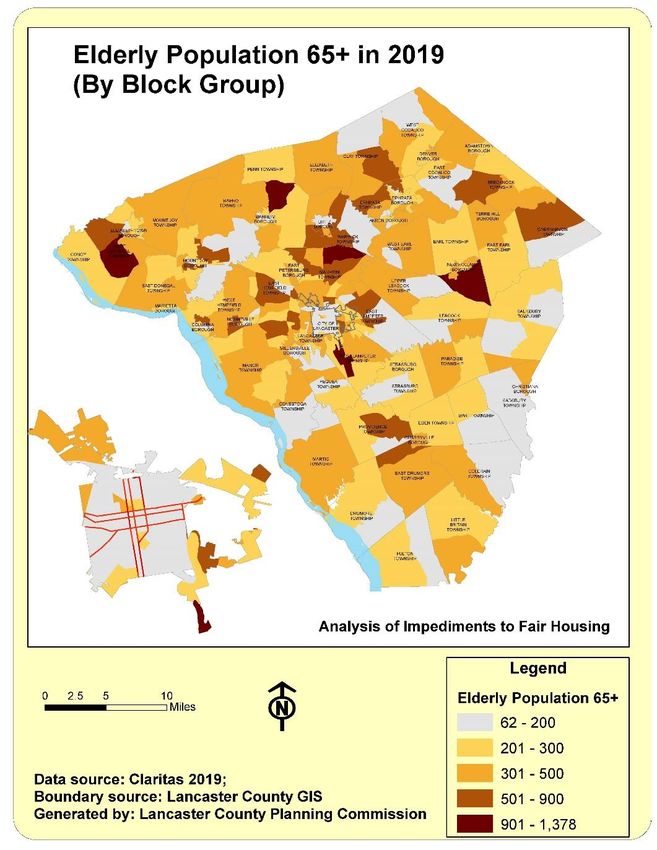
C. Private Sector .................................................................................................. 59
             1. Real Estate Practices ................................................................................. 59
             2. Advertising – Newspaper and Social Media ............................................. 60
             3. Private Financing ....................................................................................... 60
             4. Foreclosures .............................................................................................. 61
          D. Identification of Impediments to Fair Housing Choice ................................... 61
          E. Assessment of Current Fair Housing Program and Activities ......................... 65

Figures
          Figure 1.            Pennsylvania Counties .................................................................... 7
          Figure 2.            Municipalities in Lancaster County ................................................. 8
          Figure 3.            Major Transportation Routes in Lancaster County ........................ 9
          Figure 4.            Lancaster City Census Tracts ......................................................... 10
          Figure 5.            Census Tracts in Lancaster County ............................................... 11
          Figure 6.            Concentration of the Elderly Population ...................................... 16
          Figure 7.            Population of a Race Other Than White in 2019 .......................... 21
          Figure 8.            Hispanic Population in 2019 in Lancaster County ........................ 23
          Figure 9.            Families Below Poverty Level in 2019 ........................................... 30
          Figure 10            Families Receiving Food Stamps/SNAP Benefits .......................... 33
          Figure 11.           Renter-Occupied Housing Units in 2019 by Municipality ............. 38
          Figure 12.           Map of Subsidized Housing Developments in Lancaster County . 47

Tables

          Table 1.             Municipal Population in Lancaster County ................................... 12
          Table 2.             Estimated Households by Household Size for
                               Lancaster County & City................................................................ 14
          Table 3.             2019 Estimated Households by Presence of Own Children ......... 14
          Table 4.             Lancaster County Residents by Age .............................................. 15
          Table 5.             Religious Bodies in Lancaster County by Number of Adherents .. 17
          Table 6.             Limited English-Speaking Households .......................................... 18
          Table 7.             Racial Breakdown in Lancaster County ......................................... 19
          Table 8.             Racial Breakdown in the City of Lancaster.................................... 19
          Table 9.             Disability Type by Age in Lancaster County .................................. 26
          Table 10.            Median Family Income by Race ................................................... 27
          Table 11.            Estimated 2019 Median Household Income by Race ................... 28
          Table 12.            Percent Change in Median Family Income by Race ..................... 28
          Table 13.            2019 Income Limits for Lancaster County .................................... 28
          Table 14.            2018 Free and Reduced Cost Lunch Programs
                               in Lancaster County ...................................................................... 31
          Table 15.            Companies with the Top Ten Largest Number of Employees ...... 35

                                                                    2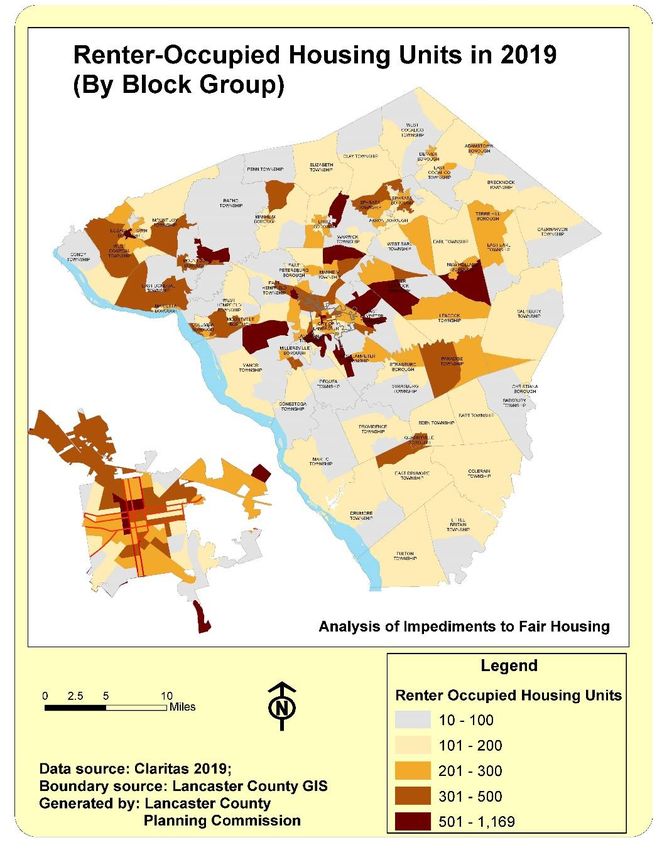
Table 16.   2018 High Priority Occupations for Lancaster County.................. 35
Table 17.   Wages for Specific Occupations in Lancaster County ................... 36
Table 18.   Housing Tenure by Race/Ethnicity for Lancaster County & City .. 37
Table 19.   Units in Structures in Lancaster County........................................ 39
Table 20.   Year Housing Units were Built in Lancaster County ..................... 39
Table 21.   Demographics of Households with Severe Housing
            Cost Burden................................................................................... 41
Table 22.   Demographics of Households with Disproportionate
            Housing Needs in County .............................................................. 43
Table 23.   Demographics of Households with Disproportionate
            Housing Needs in City ................................................................... 44
Table 24.   Affordable Rental Housing Units ................................................. 45
Table 25.   Housing Wage ............................................................................... 46
Table 26.   Fiscal Year 2020 Fair Market Rents .............................................. 46
Table 27.   Vacancy Status in Lancaster County ............................................. 46
Table 28.   City of Lancaster Public Housing Developments .......................... 49
Table 29.   Selected Subsidized Developments by Racial Composition ......... 49
Table 30.   Lancaster County Housing Authority Program Participants ......... 50
Table 31.   Publicly Supported Accessible Housing Units .............................. 59
Table 32.   2013 Impediments and Progress to Date ..................................... 65
Table 33.   2021-2025 Impediments to Fair Housing .................................... 72

                                                3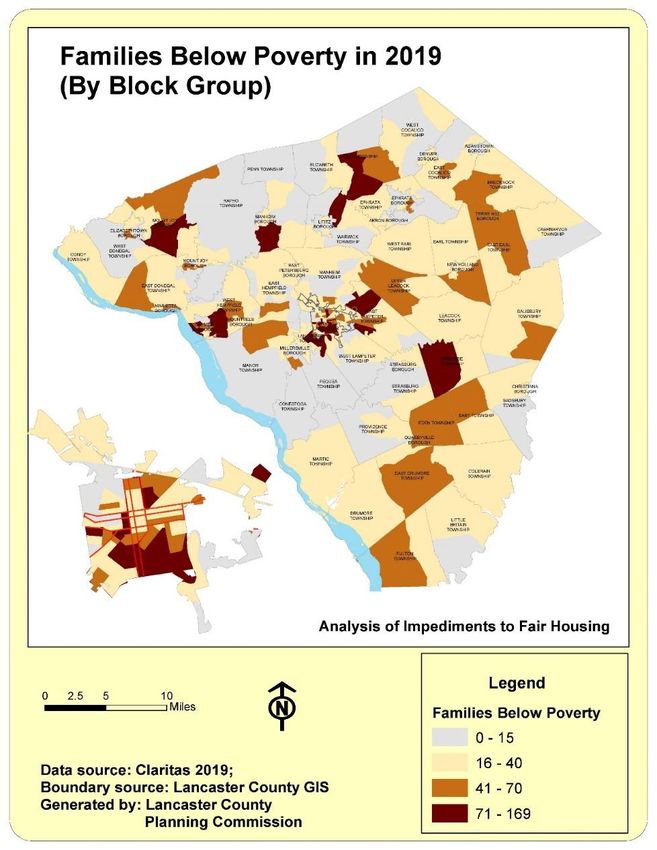
I.   Introduction to the Analysis of Impediments to Fair Housing Choice
     The Fair Housing Act of 1968 mandates that the U.S. Department of Housing and Urban
     Development (HUD) “affirmatively further fair housing” through its funded programs. HUD in
     turn requires funding recipients (such as the City of Lancaster and the County of Lancaster) to
     conduct fair housing planning to take proactive steps that will reduce discrimination in housing
     markets and lead to better living conditions for minority groups and vulnerable populations.

     HUD mandates that each jurisdiction receiving HUD funds must complete an Analysis of
     Impediments to Fair Housing (AI) to analyze a series of fair housing issues, identify contributing
     factors and impediments and most importantly, identify meaningful actions to create a more
     integrated community with improved access to opportunity for all.

     In 2016, HUD launched a new approach to identify fair housing challenges, called the
     Assessment of Fair Housing (AFH). This approach encouraged communities to embrace a more
     comprehensive planning process, focusing on economic, as well as housing barriers. In January
     2018, HUD suspended the AFH requirements, reverting to the AI approach. This was done to
     give communities more time to adjust to the new AFH format.

     This Analysis of Impediments (AI) is an update of Lancaster City and Lancaster County’s Plan
     published most recently in 2013. The purpose of the AI is for Lancaster County (County) and the
     City of Lancaster (City) to evaluate the housing characteristics, to identify blatant or defacto
     impediments to fair housing choice. It will also establish a strategy for the expansion of fair
     housing opportunities throughout the county and city.

     Lancaster County and the City of Lancaster are proceeding with a multi-jurisdictional AI that
     includes many aspects of the AFH process. The overall goal of this approach is to help
     communities improve economic conditions for all residents.

     The Housing and Community Development Act of 1974, the National Affordable Housing Act, as
     amended, along with the McKinney-Vento Homeless Assistance Act, as amended, govern the
     administration of Community Development Block Grant Program (CDBG), HOME Investment
     Partnership Program (HOME), and Emergency Solutions Grant (ESG) and require participating
     jurisdictions to certify that they will affirmatively further fair housing. This means the
     jurisdictions will:
         1. Conduct an analysis of impediments to fair housing choice,
         2. Take appropriate actions to overcome the effects of impediments identified through
             that analysis, and
         3. Maintain records reflecting the analysis and actions.

     An AI is a review of impediments or barriers that impede fair housing choice and will provide a
     basis for fair housing planning, provide essential information to housing stakeholders and assist
     in building public support for fair housing efforts.

                                                  1
The legislative basis for HUD’s review of fair housing practices in communities that receive
  federal funds is the Civil Rights Act of 1968. An amendment to Title VIII of the Civil Rights Act
  was later passed; this amendment, known as the Fair Housing Act of 1988, expanded the scope
  of coverage of the law to include, as protected classes, families with children and persons with
  disabilities.

  The Fair Housing Act covers most housing. However, in some circumstances, the Act exempts
  the following:
      1. Owner-occupied buildings with not more than four units,
      2. Single family housing sold or rented without the use of a broker, and
      3. Housing operated by organizations or private clubs that limit occupancy to members.

  Impediments to fair housing choice are defined as any actions, omissions, or decisions taken
  because of race, color, religion, gender, disability, familial status, or national origin that restrict
  housing choice or the availability of housing choice.

A. Methodology

  HUD requires that an AI include:
  1. An analysis of demographic, income, housing and employment data;
  2. An evaluation of the fair housing complaints filed in the jurisdiction;
  3. A discussion of impediments, if any, in:
         a. The sale or rental of housing
         b. Provision of brokerage services
         c. Financing
         d. Public policies
         e. Administrative policies for housing and community development activities that
            affect fair housing resources;
         f. Assessment of current fair housing resources; and
         g. Conclusions and recommendations.

  The AI utilizes publicly available data from several sources, including:
         1. Census and other demographic data;
         2. Consolidated Plan and associated planning documents;
         3. Fair housing complaint data from HUD;
         4. Information from Lancaster Housing Opportunity Partnership’s (LHOP) Housing
              Equity and Equality Institute (HEEI);
         5. Internet resources; and
         6. local resources.

  In addition to the identification of impediments, jurisdictions are required to develop methods
  to address the issues that limit the ability of residents to rent or own housing, regardless of
  their inclusion in a protected class.

                                                 2
Fair housing choice is defined as the “ability of persons, regardless of race, color, religion,
  gender, national origin, familial status, or handicap, of similar income levels to have available to
  them the same housing choices.” The AI encompasses the following five areas:

         1. The sale or rental of dwellings (public or private),
         2. The provision of housing brokerage services,
         3. The provision of financing assistance for dwellings,
         4. Public policies and actions affecting the approval of sites or other building
            requirements used in the approval process for the construction of publicly assisted
            housing, and,
         5. The administrative policies concerning community development and housing
            activities, which affect opportunities for minority households to select housing
            inside or outside areas of minority concentration.

  In a Final Rule, effective March 5, 2012, HUD implemented a policy to ensure that its core
  programs are open to all eligible individuals and families regardless of sexual orientation,
  gender identity, or marital status. HUD implemented this policy in reaction to evidence that
  lesbian, gay, bisexual and transgender (LGBT) individuals and families are being arbitrarily
  excluded from housing opportunities in the private sector. This final rule prohibits
  discrimination against these groups by any housing provider receiving HUD funding and those
  who are insured by the Federal Housing Administration, including lenders.

  The Pennsylvania Human Relations Act, as amended, prohibits housing discrimination based on
  race, color, sex, religion, national origin, ancestry, handicap or disability, guide dogs, support
  animals, age (40 and above), pregnancy, familial status (families with children under the age of
  18), use of a guide or support animal due to blindness, deafness, or physical disability or the
  disability of an individual with whom the person is known to have a relationship or association.
  Pennsylvania ‘s law differs primarily in that the age category is lowered to 40 years of age.

B. Development of the Plan

  In partnership with the City, the Redevelopment Authority created an AI Planning Committee
  that guided the development of the AI. It consisted of the following participants:
          • Susannah Thorsen, City of Lancaster
          • Adrian Garcia, Lancaster Housing Opportunity Partnership (now employed at the
             Pennsylvania Human Relations Commission
          • Britany Mellinger, Director, Housing Equity and Equality Institute, Lancaster Housing
             Opportunity Partnership (LHOP)
          • Emma Hamme, Lancaster County Planning Commission (now employed at the City of
             Lancaster)
          • Jo Raff, Community Basics, Inc.
          • Aimee Tyson, Lancaster County Redevelopment Authority

                                               3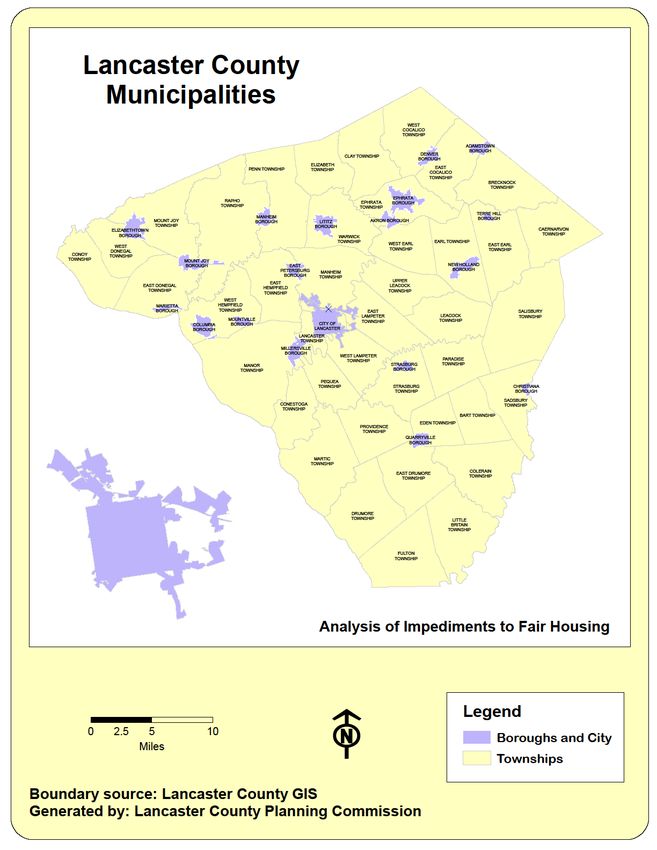
Special thanks to Rose Long of the Lancaster County Planning Commission for providing much
of the data in this report.

The Planning Committee, the Data Collection Committee and the Outreach Committee all
began meeting in the summer of 2019 and worked through early 2020. Then the world changed
due to the COVID-19 pandemic in March 2020. Both the City and the County were focused on
administering the federal CARES funds to address critical crisis needs and the plan was stalled.
Our country is seeing the light at the end of the tunnel with the distribution of vaccines. While
most residents are still seeing the dire impact of the pandemic on their lives, their housing and
their incomes; federal, state and local resources have been distributed to attempt to meet the
need. Eviction moratoriums were put in place by the federal, state and local governments to
keep people in their homes.

Pre-COVID, the Redevelopment Authority and the City of Lancaster completed a comprehensive
review of demographics for the County and the City including but not limited to population,
housing, income and employment. Public policies were also reviewed to determine if a
disparate impact was created for fair housing. The AI Planning Committee analyzed the
demographic information and public policies to finalize the list of impediments to fair housing.
Given the massive upheaval caused by the virus, most of the data collected before the
pandemic is irrelevant. However, it is the best we have. The AI Planning Committee has
attempted to supplement the pre-COVID data with recent information but that too is limited
and not necessarily a predictor of the future housing dynamics.

Citizen Participation

The Outreach Committee met with various social service entities to discuss the issue of
impediments to fair housing at the following dates and locations:

       July 25, 2019 – Columbia Connections
       August 28, 2019 – Together Initiative Network
       September 24, 2019 – Elanco Community Collaboration
       October 7, 2019 – Elizabethtown Area Hub
       October 8, 2019 – Northern Hub
       November 18, 2019 – Homeless Service Provider Network
       November 21, 2019 – Solanco Family Life Network
       December 6, 2019 – Coalition for Sustainable Housing

                                            4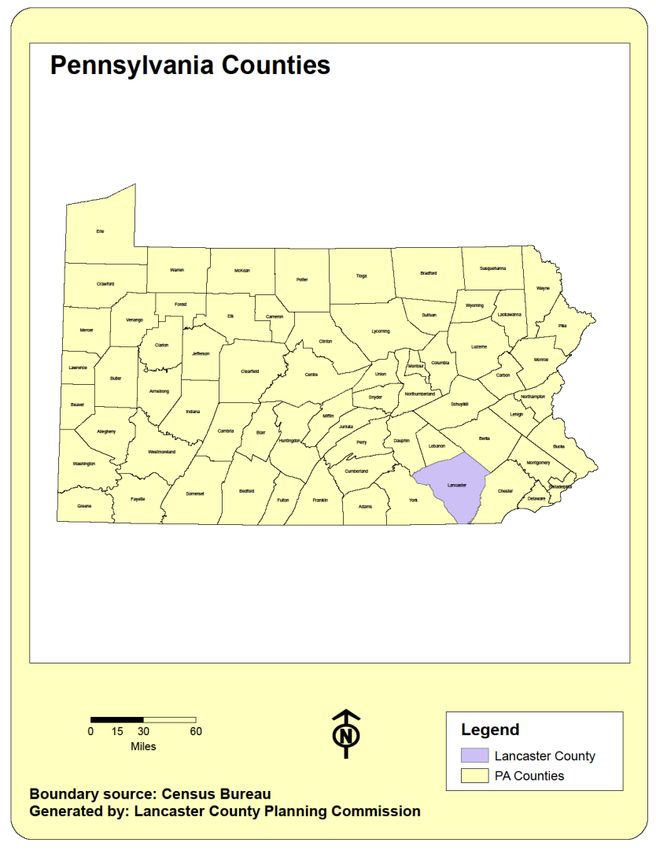
In the Fall of 2019, the Outreach Committee created and distributed a survey for social service
   professionals that work with vulnerable clients to obtain feedback on housing choices. A
   summary of responses is included in the Appendix.

   Comment boxes were set up at libraries and social service agencies to allow citizens to provide
   input on what prevents them from living where they want to live. A summary of comments is
   included in the Appendix.

   The Analysis of impediments to Fair Housing was released on February 12, 2021 along with an
   “Citizen Summary”. The notification of its release was made on www.lchra.com,
   www.cityoflancasterpa.com, partner websites, Facebook pages and the local newspaper (LNP)
   and Lancasteronline.com. The County and City held a virtual public hearing on March 2, 2021.
   A more informal virtual meeting was held on March 4, 2021, 2021 to obtain feedback on the
   plan from the landlords, service providers and general community members. The recorded
   meeting was then posted on Facebook to obtain further comments by those that were unable
   to attend the virtual meeting.

C. Definitions

   1. Consolidated Plan

      The Consolidated Plan is designed to help states and local jurisdictions to assess their
      affordable housing and community development needs and market conditions, and to make
      data-driven, place-based investment decisions. The consolidated planning process serves as
      the framework for a community-wide dialogue to identify housing and community
      development priorities that align and focus funding from three HUD formula block grants
      programs: CDBG, HOME, and ESG.

   2. Cost burdened

      Families that pay more than 30 percent of their income for housing are considered cost
      burdened and may have difficulty affording necessities such as food, clothing,
      transportation, and medical care.

   3. Disability

      Federal laws define a person with a disability as “Any person who has physical or mental
      impairment that substantially limits one or more major life activities; has a record of such
      impairment; or is regarded as having such an impairment.”

                                               5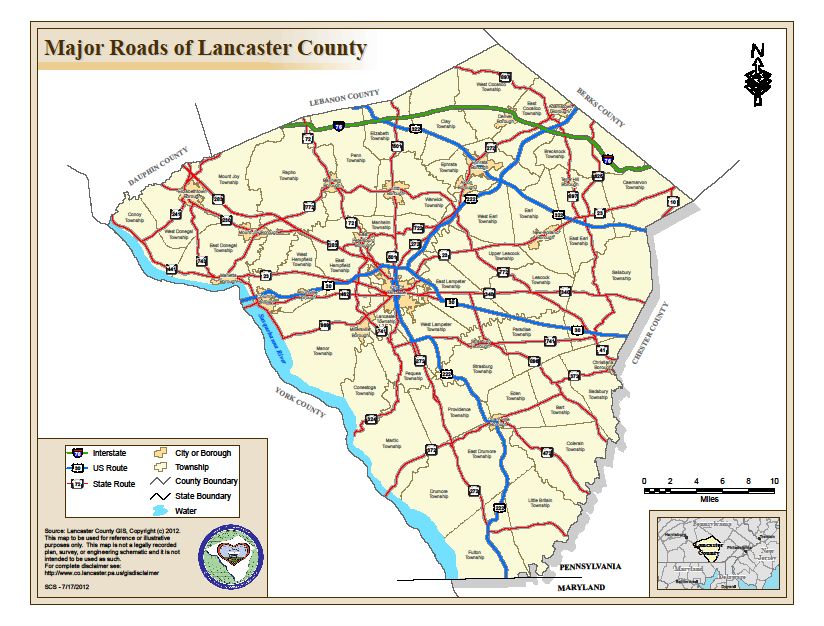
4. Housing Need

   Housing needs are defined as households with any housing problems such as a cost burden
   greater than 30% of income and/or overcrowding and/or without complete kitchen or
   plumbing facilities.

5. Impediments

   Defined as: any actions, omissions, or decisions taken because of color, race religion,
   gender, disability, familial status, or national origin that restrict housing choice or the
   availability of housing choice.

6. Infrastructure

   The term infrastructure refers to the substructure or underlying foundation or network
   used for providing goods and services; especially the basic installations and facilities on
   which the continuance and growth of a community, State, etc. depend. Examples include
   roads, water systems, communications facilities, sewers, sidewalks, cable, wiring, schools,
   power plants, and transportation systems.

7. Protected Class

   Classes of the population that are protected under the Federal Fair Housing Act are: race,
   color, religion, gender, national origin, disability (added in 1988), and familial status (having
   children under 18 in a household, including pregnant women, added in 1988).

8. Publicly Supported Housing

   The monthly cost to the tenants is subsidized by federal state or other programs including
   but not limited to Housing Choice Vouchers, Section 811 Vouchers, etc.

                                             6
II. Data Analysis
A. Background Information – Understanding the social, racial, economic and other
characteristics of a population, as well as how those characteristics change over time, is
crucial to evaluating current and future housing needs. Analyzing demographic trends can
indicate places or people who may not be served by the housing market and who need
assistance or intervention. The goal of data analysis is to inform future strategies to increase
access to housing opportunities by all residents.
1. Overview of Lancaster County and City of Lancaster
Lancaster County is in south central Pennsylvania and is bordered by York, Dauphin,
Lebanon, Berks and Chester counties. The county also borders the State of Maryland to the
south. It is 984 square miles and with the City of Lancaster, forms the Lancaster
Metropolitan Statistical Area (MSA). The city of Lancaster is 7.3 square miles.
Figure 1. Pennsylvania Counties
7Lancaster County is comprised of 60 municipalities; each with their own subdivision, zoning
and comprehensive plans. The 60 municipalities consist of 41 townships, 18 boroughs and
the City of Lancaster. Lancaster County has a mix of urban, suburban and rural areas. The
city of Lancaster is in the center of the county. Most of the suburban development occurs
outside of the city and surrounding boroughs. The perimeter of the count is predominantly
agricultural and rural. The County is well known for its Amish residents that live
predominantly on farms are in the eastern and southern parts of the county.
Figure 2. Municipalities in Lancaster County
8Lancaster County is bisected to the north by the Pennsylvania Turnpike (Interstate 76) and
through the middle by US Route 30 (Lincoln Highway). Route 283 runs through the
northwestern part of the County and Route 322 runs in the northeast. Route 222 runs north
and south through the county. Figure 3 illustrates these and other major travel routes in the
County.
Figure 3. Major Transportation Routes in Lancaster County
Data for the County and City is frequently made available through the Census in geographic
areas called census tracts. Figure 4 is a map of the census tracts in the City.
9Figure 4. Lancaster City Census Tracts
10Figure 5. Census Tracts in Lancaster County
112. Demographic Data
a. Population
The 2013-2017 American Community Survey (ACS) 5-Year Estimates indicate that Lancaster
County’s population is 536,494.
Table 1. Municipal Population in Lancaster County
ACS Percent ACS Percent
Municipality 2010 Estimate Change Municipality 2010 Estimate Change
Adamstown 1,772 2,196 24% Lititz Borough 9,369 9,269 -1%
Borough
Akron Borough 3,876 3,975 3% Little Britain 4,106 4,217 3%
Township
Bart Township 3,094 3,286 6% Manheim 4,858 4,881 0%
Borough
Brecknock 7,199 7,432 3% Manheim 38,133 39,568 4%
Township Township
Caernarvon 4,748 4,794 1% Manor Township 19,612 20,571 5%
Township
Christiana Borough 1,168 954 -49% Marietta 2,588 2,615 1%
Borough
Clay Township 6,308 6,780 7% Martic Township 5,190 5,232 1%
Colerain Township 3,635 3,808 5% Millersville 8,168 8,366 2%
Borough
Columbia Borough 10,400 10,430 0% Mount Joy 7,410 8,071 9%
Borough
Conestoga 3,776 3,866 2% Mount Joy 9,873 10,790 9%
Township Township
Conoy Township 3,194 3,418 7% Mountville 2,802 2,848 2%
Borough
Denver Borough 3,861 3,877 0% New Holland 5,378 5,445 1%
Borough
Drumore Township 2,560 2,631 3% Paradise 5,131 5,513 7%
Township
Earl Township 7,024 7,177 2% Penn Township 8,789 9,337 6%
East Cocalico 10,310 10,460 1% Pequea 4,605 4,752 3%
Township Township
East Donegal 7,755 8,202 6% Providence 6,897 6,991 1%
Township Township
East Drumore 3,791 3,849 2% Quarryville 2,576 2,736 6%
Township Borough
East Earl Township 6,507 6,792 4% Rapho Township 10,422 11,654 12%
East Hempfield 23,522 24,218 3% Sadsbury 3,395 3,483 3%
Township Township
East Lampeter 16,242 16,942 4% Salisbury 11,062 11,385 3%
Township Township
East Petersburg 4,606 4,528 -2% Strasburg 2,809 2,907 3%
Borough Borough
12ACS Percent ACS Percent
Municipality 2010 Estimate Change Municipality 2010 Estimate Change
Eden Township 2,094 2,039 -3% Strasburg 4,182 4,282 2%
Township
Elizabeth Township 3,886 3,963 2% Terre Hill 1,295 1,359 5%
Borough
Elizabethtown 11,545 11,579 0% Upper Leacock 8,708 8,879 2%
Borough Township
Ephrata Borough 13,394 13,785 3% Warwick 17,783 18,474 4%
Township
Ephrata Township 9,400 10,189 8% West Cocalico 7,280 7,412 2%
Township
Fulton Township 3,074 3,159 3% West Donegal 8,260 8,645 5%
Township
Lancaster City 59,322 59,556 0% West Earl 7,868 8,193 4%
Township
Lancaster 16,149 17,038 6% West Hempfield 16,153 16,426 2%
Township Township
Leacock Township 5,220 5,479 5% West Lampeter 15,209 15,791 4%
Township
Source: Census 2010 and 2013-2017 ACS 5-Year Estimates
Relying on percent change by municipality can be misleading. For example, Adamstown
saw a 24% increase in population; however, it was only a net gain of 424 people. Ephrata
Township saw an increase of 789 people and only had a percent increase of 8%.
While the percent change has grown steadily over the past three decade, the numeric
increased remain at approximately 40,000 additional residents per decade.
Claritas, a data resource used by the Lancaster County Planning Commission, projects that
by 2024 the population for Lancaster County will be 561,092 or 2.43% which indicates a
reduction in population growth rates from previous projections. Claritas also projects that
the City of Lancaster will grow by 1.51% in 2024 which is a slowing of growth rates from
previous years.
Interpretation 1: The County and City are growing although at a slower rate than in previous
years. More people required an increased emphasis on education about fair housing and
increased access to persons with questions about fair housing.
b. Households and Families
There were an estimated 198,565 households in Lancaster County according to the 2013-
2017 ACS 5-Year Estimates. The household size is slightly higher than the state at 2.64
persons per household but on par with the United States.
There are 139,173 families in Lancaster County; the average family size is 3.15.
13Table 2. 2019 Estimated Households by Household Size for Lancaster County and City
Lancaster City Lancaster County
Household Size Number Percent Number Percent
1 Person Household 7,356 32.37 50,713 24.67
2 Person households 6,349 27.94 72,912 35.47
3 Person Households 3,515 15.47 32,755 15.93
4 Person Household 2,714 11.94 26,562 12.92
5 Person Household 1,449 6.38 12,368 6.02
6 Person Household 733 3.23 5,428 2.64
7 or more person Household 607 2.67 4,842 2.36
Source: Claritas
Claritas estimates that the average household size in 2019 was 2.6 for the County and 2.55
for the City of Lancaster.
Claritas projects that the number of households in Lancaster County will rise to 211,073 in
2024 which is a 2.67% increase over the estimated number in 2019 of 205,580. Claritas
projects that the number of households in the City of Lancaster will rise to 23,152 in 2024
which is 1.89% higher than the 2019 estimate of 22,723.
Table 3. 2019 Estimated Households by Presence of Own Children
Lancaster City Lancaster County
Number Percent Number Percent
13,112 143,716
Married Couple, own children 2,868 21.87% 46,044 32.04%
Married-Couple, no own children 3,996 30.48% 69,858 48.61%
Male Householder, own children 720 5.49% 4,163 2.90%
Male Householder no own children 677 5.16% 3,941 2.74%
Female Householder, own children 3,143 23.97% 11,339 7.89%
Female householder, no own children 1,708 13.03% 8,371 5.82%
Interpretation 2: It is significant that the 2019 Estimates from Claritas show a significant
difference between the City and the County in the percent of Female Householders with
their own children. Lancaster City is estimated to have 23.97 % of householders headed by
females with their own children while the County shows only 7.89 of the same. Not
surprisingly, there is a significant difference between the percent of married-couple families
with their own children in the City (21.87%) than the County (32.04%). The presence of
14children is a protected class so information and education on this issue may be needed
more in the City than in the County.
c. Age Distribution
Lancaster County has 6.5% of its residents under the age of 5; 23.5 of its population is under
the age of 18. Residents over the age of 65 comprised 17.9% of the population. These
percentages are comparable to the state and nation.
The total percent by category shown below is similar to the percentages shown in the 2010
Census.
Table 4. Lancaster County Residents by Age
Category Age Number Percent Total Percent
Children Under 5 years 35,700 6.7% 6.7%
School Age 5-9 years 36,933 6.9% 20%
10-14 years 34,301 6.4%
15-19 years 36,468 6.8%
Young Adult 20-24 years 35,344 6.6% 31%
25-29 years 35,732 6.7%
30-34 years 32,731 6.7%
35-39 years 30,462 6.1%
40-49 years 30,496 5.7%
Middle Age 45-49 years 32,806 6.1% 26%
50-54 years 36,622 6.8%
55-59 years 36,266 6.8%
60-64 years 32,800 6.1%
Elderly 65-69 years 27,769 5.2% 15%
70-74 years 19,911 3.7%
75-79 years 15,640 2.9%
80-84 years 1,242 2.3%
85+ years 14,271 2.7%
Total 536,494
Source: 2013-2017 ACS 5-Year Estimates
Claritas estimates that the 2019 median age for Lancaster County was 38.67 versus the City
at 33.69 and the 2019 estimated average age for the County was 39.80 versus the City at
35.60. clearly the City residents are generally younger overall. Claritas projects that by
2024 the median age for the City will be 35.3 and the median age for the County will be
38.98 both showing an increasingly aging population.
The map below may be deceiving as the concentrations are generally due to retirement
communities such as Masonic Village and Willow Valley.
15Figure 6. Concentration of the Elderly Population
Interpretation 3: An increase in the older population raises the potential of age
discrimination in housing which is a protected class. Fair housing education may need to be
targeted to this issue to prevent housing discrimination. A high number of older residents
impacts the housing needs related to affordability, accessibility, and the need for health
services.
16d. Religion
The Association of Religion Data Archives shows that as of 2010, the ten largest Religious
Bodies in Lancaster County by Number of Adherents were as follows:
Table 5. Religious Bodies in Lancaster County by Number of Adherents
Religious Body Adherents
Catholic Church 51,292
Non-denominational 43,103
United Methodist 28,676
Amish 26,270
Lutheran 22,429
Mennonite 15,225
Church of the Brethren 8,968
Source: Association of Religion Data Archives, County Membership Report, 2010
The County has a large number of Anabaptist groups which include Amish, Mennonite, and
Brethren due to its historical roots as a center of immigration in the late 1700’s from areas
now known as Germany.
When it comes to discrimination in the rental housing market, it should be noted that the
religion of the landlord is often a determinant in situations of discrimination. Some
landlords feel that renting to an unmarried couple, an unmarried mother with children or
two unmarried individuals in a relationship, etc. is against their religion. Information
should continue to be provided to landlords to make it clearly understood that these forms
of discrimination are illegal.
Interpretation 4: Religion is a protected class for fair housing. Knowing the predominant
types of religions helps to target fair housing education efforts.
e. National Origin and Linguistic Isolation
Housing cannot be refused based on a person’s birthplace, ancestry, nor can housing
providers refuse to access to persons based on their inability to read, write, speak or
understand English. Residents with Limited English Proficiency (LEP) can face obstacles in
finding housing which is why recipients of federal funds must ensure that LEP citizen are
provided access to housing.
According to the 2013-2017 ACS Estimates, Lancaster County has 26,202 residents or 4.8%
of the population that are foreign born. Of the 26,202; 55% are naturalized citizens.
17Lancaster County has a lower percent of foreign-born persons from 2013-2017 (4.8%) than
Pennsylvania (6.6%) or the United States (13.4%).
Table 6. Limited English-Speaking Households
Limited English-
Speaking
Languages Households Households
Spanish 15,443 3,086
Other Indo-European Languages 12,892 2,116
Asian and Pacific Island Languages 2,675 749
Other Languages 1,241 265
Total Households 198,565 6,216
Source: 2013-2017 American Community Survey 5-Year Estimates (S1602)
Claritas estimates that in 2019 the estimated population over age 5 speak mostly English in
the home (83.98% in the County and 63.89% in the City). However, a significant difference
is shown in the percent of residents that speak Spanish at home; 29.74% of City residents
speak Spanish at home while 6.77% of County residents speak Spanish at home. In fact,
the estimates show that more people living in the County speak IndoEuropean Languages
at home than Spanish (7.03% versus 6.77% respectively).
Lancaster County has a significantly higher percent of residents that speak a language other
than English at home at 16.7% compared to Pennsylvania but lower than the percent of
similar persons in the United States (21.3%).
In Lancaster County, the largest percentage of people show an ancestry from Germany,
likely a result of the “Pennsylvania Dutch” influence. In the City of Lancaster, the largest
percentage of people show an ancestry from Other ancestries or unclassified ancestry.
German ancestry in the City is 12.43% compared to 27% in the County.
There are several nonprofit and faith-based organizations that work with refugees from
many different countries to help in their resettlement in Lancaster County and City.
The Lancaster Chamber recently released a report entitled Strengthening the Workforce by
Welcoming Immigrant Contributions: Facts and Strategies. This document discussed the
efforts in the county will the refugee population. Another source of information on
refugees in the County is https://www.dhs.pa.gov/refugeesinpa/Pages/Facts.aspx
Interpretation 5: Significantly more City residents speak Spanish at home than the County as
a whole (29% versus 6.7%). This shows a need for fair housing education targeted in several
languages, most importantly in Spanish.
18f. Race and Ethnicity
According to QuickFacts from the Census.gov, Lancaster County is predominantly White
residents(89.8%) which is slightly higher than the state (81.8%) but significantly higher than
the nation (76.5%). Claritas estimates that in 2019 Lancaster County’s population of White
residents is 85.94% with the population of Black residents estimated to be 4.29%. Other
races and multiple races are all estimated to be less than 5%.
Lancaster County has a significantly lower percent of residents that are Black or African
American that the State or nation. (Lancaster County 5.2%; Pennsylvania 12%; United
States 13.4%)
Lancaster County has a higher percent of Hispanic residents than the State (10.8% versus
7.6%) but less than the nation (18.3%). Claritas estimates that in 2019, 10.93% of the
County population is Hispanic. Claritas estimates that in 2019 Hispanic residents comprise
45.21% of the City’s population.
The racial breakdown in Lancaster County is proportionally similar to the breakdown
indicated in the 2010 Census.
Table 7. Racial Breakdown in Lancaster County
Race Persons Percent
White 475,145 89%
Black or African American 22,900 4%
American Indian and Alaskan Native 826Claritas estimates that the highest percent of Asian residents in originate from Vietnam in
both the City and County.
Of the estimated 536,494 persons residing in Lancaster County 53,792 or 10% are Hispanic
or Latino residents. Of the 59,556 persons living in the City of Lancaster 23,036 or 38% are
Hispanic or Latino residents. In both the County and the City, the majority of Hispanic
residents originate from Puerto Rico (66.81% and 74.06% respectively). The majority of
Hispanic residents in both the County and the City identify their race as with White Alone or
Some Other Race.
20Figure 7. Population of a Race Other Than White in 2019
21Minority Concentrations
HUD defines areas of racial or ethnic concentration as geographic areas where the
percentage of a specific minority or ethnic group is 10 percentage points higher than a
jurisdiction’s overall percentage.
Lancaster City was the only municipality that showed a minority concentration for Blacks or
African Americans. However, if broken down by Census Tracts, there are several more
areas of minority concentration.
There are a handful of census tracts that show a minority concentration:
• The following Census tracts showed proportions greater than 10 percentage points
higher than the County proportion for Blacks or African Americans: 1, 2, 3, 7, 8, 9, 10,
11, 12, 112. Most of these tracts (identified in bold) are in the City of Lancaster.
• Census Tract 118.05 showed a disproportionally high percent of persons identifying
themselves as two or more races (12%).
• Census Tract 135.01 showed a higher than the County proportion for “Some Other
Race.”
• Census tract 147 shows a concentration of 10 percent points higher than the County
proportion at 31% of the tract comprised of Black or African Americans. This tract also
shows a disproportionally high percent of persons described as “Some Other Race” at
18%.
There is little change in the figures by municipality since the data was collected in 2010.
Interpretation 6: The City of Lancaster has a higher concentration of census tracts with
minority concentrations. This shows a need for fair housing education in the City of
Lancaster to ensure that people of color reside predominantly in the City by choice and not
by systematic segregation.
Ethnicity
Hispanics/Latinos represent 11% of the population in Lancaster County. The following
census tracts exceed that percent by more than 10%:
• All Census Tracts in the city of Lancaster (1, 2, 3, 6,7,8,9,11,11,12,14, 118.05 and 147)
• 134
• 135.01
• 141.01
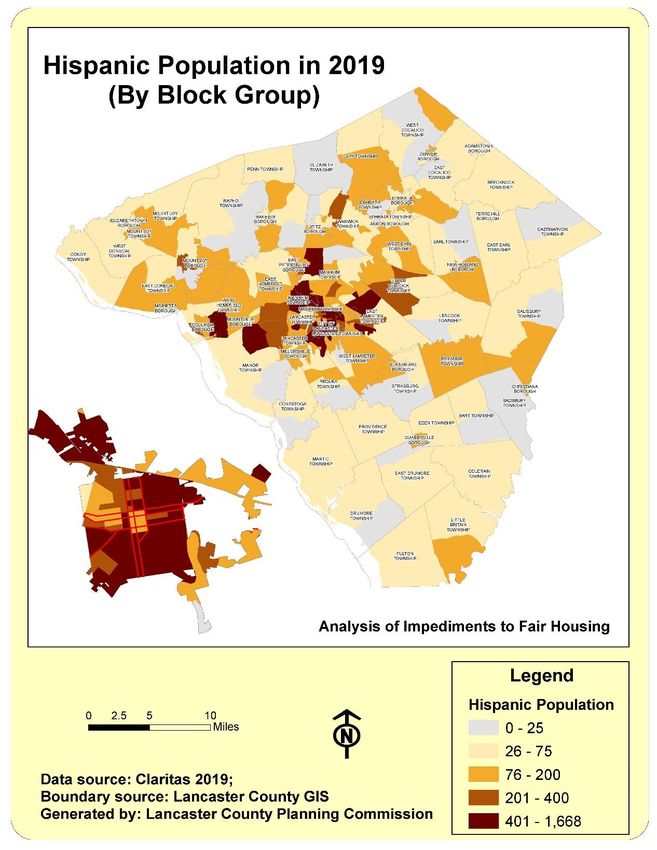
22Figure 8. Hispanic Population in 2019 in Lancaster County By Block Group
Interpretation 7: The majority of Hispanics in Lancaster County are concentrated in the City
of Lancaster. This shows a need for fair housing education in the County to ensure that
Hispanics reside predominantly in the City by choice and not by systematic segregation.
23g. Persons with Disabilities
Persons with disabilities are protected by six (6) standards of accessibility:
• The Fair Housing Act- refers to accessibility in buildings built after March 31, 1991 and
includes four or more units.
• Americans with Disabilities Act (ADA) – refers to ADA standards of accessibility in places
of public accommodation and commercial facilities.
• Uniform Federal Accessibility Standards – refers to accessibility standards for facility
accessibility by people with motor and sensory disabilities for Federal and federally
funded facilities.
• Section 504 (see below)
• Visitability Standards – refers to housing designed so that it can be lived in or visited by
people with disabilities.
• Universal Design – refers to the design of products and environments to be useable by
all people, to the greatest extent possible, without adaptation or specialized design.
Section 504 of the Rehabilitation Act is a national law that protects qualified individuals
from discrimination based on their disability. The nondiscrimination requirements of the
law apply to employers and organizations that receive any federal financial assistance.
Section 504 forbids organizations and employers from excluding or denying individuals with
disabilities an equal opportunity to receive program benefits and services. Individuals with
disabilities have the right to participate in, and have access to, program benefits and
services.
Under Section 504, individuals with disabilities are defined as a person with a physical or
mental impairment which substantially limits one or more major life activities. People who
have a history of or are regarded as having a physical or mental impairment that
substantially limits one or more major life activities are also covered. Major life activities
include care for one’s self, walking, seeing, hearing, speaking, breathing, working,
performing manual tasks, and learning. Some examples of impairments which may
substantially limit major life activities, even with the help of medication or aids/devices are:
AIDS, alcoholism, blindness or visual impairment, cancer, deafness or hearing impairment,
diabetes, drug addiction, heart disease, and mental illness.
The Americans with Disabilities Act gives civil rights protections to individuals with
disabilities like those provided to individuals based on race, color, gender, national original,
age, and religion. It guarantees equal opportunity for individuals with disabilities in public
accommodations, employment, transportation, State and local government services, and
telecommunications.
In addition to accessibility guidelines, the Fair Housing Act also ensures that people with
disabilities have the right to request the reasonable modifications to their dwellings that are
needed to fully use and enjoy their housing. These modifications can create viable housing
options that would be otherwise inaccessible for persons with disabilities.
24According to Census.gov QuickFacts, 8.0 % of Lancaster County residents under the age of
65 have a disability, which is similar to the United States but lower than Pennsylvania
(9.6%).
According to www.disabilitystatistics.org, the 2017 ACS shows that in Pennsylvania, the
overall percent of people with a disability of all ages was 14.2% and that persons with
disabilities ages 21-64 are estimated to have an annual household income of $44,900 in
Pennsylvania. The same source estimates that people with disabilities in Pennsylvania have
a poverty rate of 28%. The 2017 ACS also estimates that the employment rate for persons
with disabilities in Pennsylvania was 37.1%.
In Lancaster County, Pennsylvania, among the civilian noninstitutionalized population in
2013-2017, 11.7% reported a disability according to the ACS. The likelihood of having a
disability varied by age - from 4.4% of people under 18 years old, to 9.5% of people 18 to 64
years old, and to 31.1% of those 65 and over.
25Table 9. Disability Type by Age in Lancaster County
Disability Type Age With a disability Percent
Hearing disability 20,655 3.8%
Under 18 886 .7%
18-64 5,649 1.8%
65+ 14,120 15.6%
Vision 10,524 2%
Under 18 397 .3%
18-64 4,683 1.5%
65+ 5,444 6%
Cognitive 23,308 4.7%
Under 18 4,224 4.6%
18-64 13,144 4.1%
65+ 5,940 6.6%
Ambulatory 28,934 5.8%
Under 18 542 .6%
18-64 12,382 3.9%
65+ 16,010 17.7%
Self-care difficulty 9,536 1.9%
Under 18 931 1%
18-64 4,672 1.5%
65+ 3,933 4.4%
Independent living difficulty 20,771 5.1%
18-64 11,005 3.5%
65+ 9,766 10.8%
Source: 2017 ACS 1-Year Estimates
Interpretation 8: People with disabilities are a protected class under fair housing laws. Most
fair housing complaints are filed by people with disabilities which can be viewed as a
positive situation. It may show that people with disabilities are aware of their rights and are
willing to file complaints when those rights have been violated. However, relaying on the
number of complaints as a sign of the degree of discrimination may not be accurate. It may
be a situation that can be resolved by increased education toward landlords to help them
understand issues such as reasonable accommodation. Focus on education efforts
concerning fair housing and person with disabilities should continue.
26h. Income
The median household income in 2017 dollars 2013-2017 for Lancaster County was $61,492
which is higher than the Pennsylvania median household income of $56,951 and the United
States at $57,652. However, the per capita income in the past 12 months (in 2017 dollars)
for 2013-2017 was $29,280 for Lancaster County which is lower than the Pennsylvania per
capita income for the same period ($31,476) and the United States ($31,177).
According to the 2013-2017 ACS 5-Year Estimates, the municipalities with the three (3)
lowest median household incomes are:
• Lancaster City ($40,805)
• Columbia Borough ($40,982)
• Manheim Borough ($49,871)
According to the same source, the municipalities with the three highest median household
incomes are:
• Elizabeth Township ($80,966)
• Sadsbury Township ($77,321)
• Adamstown Borough ($76759)
The Lancaster County Profile from the PA Center for Workforce & Analysis lists Lancaster
County’s Per Capita Personal Income as $49,207 compared to PA’s Per Capita Person
Income of $53,300.
Table 10. Median Family Income by Race for Lancaster County and City of Lancaster
Race Lancaster County Lancaster City
All Races $68,937 $35,313
White $71,484 $38,491
Black $38,399 $29,557
Asian $70,479 $40,697
Two or More $42,287 $27,500
Source: 2011-2015 ACS Selected Economic Characteristics (DP03)
According to Claritas, the 2019 Estimated Average Household Income for county residents
was $85,434 and for the City was $55,444. Also, according to Claritas, the 2019 Estimated
Median Household Income for county residents was $66,927 and for the City was $42,154.
27Table 11. Estimated 2019 Median Household Income by Single Classification Race
Race Lancaster County Lancaster City
White Alone $69,851 $49,168
Black Alone $40,725 $35,702
American Indian and Alaskan Native $54,669 $48,448
Alone
Asian Alone $77,235 $58,564
Other Race Alone $36,119 $29,157
Two or More Races $54,666 $41,843
Hispanics of Any Race $40,648 $31,896
Source: Claritas
Table 12. Percent Change in Median Family Income by Race since 2006-2010 ACS 5-Year
Estimates
Race Lancaster County Lancaster City
All Races 7% -6%
White 8% -4%
Black -5% -17%
Asian 10% -21%
Two or more 20% 67%
The Median Family Income for Hispanics/Latinos of any race in Lancaster County is $32,206.
Claritas projects that in 2024 the Median household income for City residents will be
$46,247 compared to the estimated amount in 2019 of $42,154. Claritas projects that in
2024 the Median household income for County residents will be $73,439 compared to the
estimated amount in 2019 of $66,927.
Table 13. 2019 Income Limits for Lancaster County Metropolitan Statistical Area Used for
Programs Funded through the US Department of Housing and Urban Development
Number of Persons Very Low Income Low Income (50% of Moderate Income
in Family (30% of MFI) MFI) (80% of MFI)
1 $16,000 $26,700 $42,700
2 $18,300 $30,500 $48,800
3 $20,600 $34,300 $54,900
4 $22,850 $38,100 $60,950
5 $24,700 $41,150 $65,850
6 $26,550 $44,200 $70,750
7 $28,350 $47,250 $75,600
8 $30,200 $50,300 $80,500
28To calculate the income limits for families with more than 8 members, 8% of the four-
person base should be added to the eight-person income limit. For example, the nine-
person limit equals 140 percent (132+8) of the relevant four-person income limit. All
income limits are rounded to the nearest $50.
Source: US Dept. of Housing and Urban Development
Interpretation 9: Members of protected classes tend to have lower incomes which affect
their ability to have fair housing choices. While having a low income is not automatically an
impediment to fair housing choice there is a clear connection.
Lancaster County has a lower percent of persons living in poverty (9.9%) than Pennsylvania
(12.5%) or the United States (12.3%).
Claritas estimates that in 2019 7.01% of families live below the federal poverty line while
22.26% of City families live below the poverty line. Even more compelling is that only 5.24%
of County families with children live below the poverty line while 19.01% of City families
with children live below the poverty line.
According to the 2013-2017 ACS 5-Year Estimates, the census tracts with the highest
population of persons living below poverty level are:
• 1, 2, 3, 5, 7, 8, 9, 10, 11, 14 and 147 (all located within the city of Lancaster)
• 112
• 114
• 136.02
According to the same sources, the municipalities with the highest percent of persons living
below the poverty level are:
• Lancaster City (26%)
• Columbia Borough (20%)
• Millersville Borough (20%)
Other municipalities that have a higher percent of persons living below the poverty line
than the county as a whole (10%) are:
• Colerain Township 11% • Manheim Borough 11%
• Conoy Township 16% • Marietta Borough 16%
• Earl Township 11% • Mount Joy Township 11%
• East Lampeter Township 12% • Mountville Borough 18%
• Eden Township 13% • Paradise Township 17%
• Ephrata Borough 11% • Providence Township 14%
• Fulton Township 11% • Upper Leacock Township 14%
• Lancaster Township 13% • West Earl Township 12%
29Figure 9. Families Below Poverty Level in 2019
30The National School Lunch Program (NSLP) is a federally assisted meal program operating in
public and nonprofit private schools and residential childcare institutions. It provides
nutritionally balanced, low-cost or free lunches to children each school day. Children from
families that are 185% of Poverty Guidelines are eligible for the Reduced School Lunch
Program while children from families that are 130% of Poverty Guidelines are eligible for
the free lunch program.
Table 14 below shows the percentage of students eligible for the Free/Reduced School
Lunch Program in Lancaster County School Districts. Like the population in poverty, the
highest percent for the program was in the City of Lancaster/Lancaster Township and
Columbia.
Table 14. 2018 Free and Reduced Cost Lunch Programs in Lancaster County by School
District
Total Eligible for Eligible for Free/Reduced
School District Enrollment Free lunch Reduced Enrollment
Cocalico 3,072 867 193 34%
Columbia Borough 1,397 1,383 0 99%
Conestoga Valley 4,912 1,510 261 36%
Donegal 2,908 983 142 38%
Eastern Lanc. Co 3,105 1,014 182 38%
Elizabethtown Area 3,571 852 135 27%
Ephrata Area 4,173 1,500 248 42%
Hempfield 7,000 2,194 326 36%
Lampeter Strasburg 3,066 617 92 23%
Lancaster 11,102 11,102 0 100%
Manheim Central 2,127 636 128 36%
Manheim Township 6,168 1,699 263 32%
Penn Manor 5,438 2,051 304 43%
Pequea Valley 1,515 685 92 51%
Solanco 3,052 1,282 174 47%
Warwick 4,001 1,118 148 32%
Total 66,607 29,493 2,688 48.3
Source: National School Lunch Program Reports, U.S. Department of Education
31The 2013-2017 ACS 5-Year Estimates provides information on the number of households in
each municipality that received Food Stamps/SNAP Benefits. The percent of County
Households receiving SNAP benefits was 9%. The following municipalities indicated
percentages higher than 11%:
• Columbia Borough 22% • Lancaster Township 12%
• Ephrata Borough 12% • Marietta Borough 13%
• Fulton Township 13% • Providence Township 12%
• Lancaster City 29% • Quarryville Borough 12%
Interpretation 10: Poverty restricts housing choice. Families and children living in
poverty may hesitate to assert their housing rights for fear of retaliation by the
landlord. With vacancy rates so low and the supply of affordable housing scarce,
poor households are often caught in a vicious cycle of lacking the financial means to
move and feeling that they have no choice but to remain in unsafe housing.
32Figure 10. Households Receiving Food Stamps/SNAP Benefits by Municipality
33i. Employment Data
Lancaster County generally has one of the lowest unemployment rates in the State
due to its diverse economic base.
Occupations and industries in the County
There are five (5) categories of Occupation according to the 2013-2017 ACS 5-Year
Estimates:
• Management, Business, Science and Arts
• Service
• Sales and Office
• Natural Resources, Construction, Maintenance
• Production, Transportation, Material Moving
The highest percent of occupations in Lancaster County are in Management,
Business, Science and Arts (33%) followed by Sales and Office (23%). East Hempfield
Township has the highest percent of persons working in Management, Business,
Science and Arts occupations (45%). Manheim Borough and Millersville Borough are
tie for the highest percent of residents working in Service occupations. Clay
Township and West Hempfield Township are tied for the highest percent of
residents working in Sales and Office occupations. Bart Township has the highest
percentage of persons working in Natural Resources, Construction and Maintenance
(30%). Terre Hill Borough has the highest percentage of persons working in
Production, Transportation, and Material Moving (29%).
Employed persons over the age of 16 in City of Lancaster comprise the following
percentages of occupations:
• 26% Management, Business, Science and Arts
• 23% Service
• 21% Sales and Office
• 7% Natural Resources, Construction, Maintenance
• 23% Production, Transportation, Material Moving
34Table 15. Companies with the Top Ten Largest Number of Employees
Company Name
1. LGH Penn Medicine
2. Mutual Assistance Group
3. Nordstrom Inc
4. Dart Container Corporation
5. County of Lancaster
6. Lancaster School district
7. Masonic Villages
8. Giant Food Stores
9. LSC Communications
10. Federal Government
Source: Quarterly Census of Employment and Wages, Pennsylvania
Department of Labor and Industry, Center for Workforce Information &
Analysis
The unemployment rate in Lancaster County as of October 2019 was 3.5% which is
slightly lower than the unemployment rate for PA at 4.2%.
The mission of the Lancaster County Workforce Investment Board (WIB) is to
coordinate, develop, and maintain an effective and responsive system of programs
and services that integrates the needs of employers for an ample and productive
workforce with the needs of County residents for meaningful work that enhances
their quality of life. The WIB oversees the PA CareerLink of Lancaster County, which
is located at 1016 North Charlotte Street, Lancaster, PA. PA CareerLink is the
connecting link between hundreds of County residents that come to the PA
CareerLink weekly to search for jobs, upgrade their skills, and look for new careers
and County businesses that want to hire them.
The 2018 High Priority Occupations for Lancaster County indicates that the
occupations with the highest number of annual job openings are listed below.
Table 16. 2018 High Priority Occupations for Lancaster County
Number of Annual Average
Occupations Annual Openings Salary
Nursing Assistants 171 $30,740
Registered nurses 146 $63,430
Heavy & Tractor-Trailer Truck Drivers 126 $43,880
Customer Service Representatives 110 $35,750
Licensed Practical & Licensed 105 $45,330
Vocational Nurses
35You can also read