Landscape Factors Associated with Fatalities of Migratory Tree-Roosting Bats at Wind Energy Facilities: An Initial Assessment
←
→
Page content transcription
If your browser does not render page correctly, please read the page content below

Landscape Factors
Associated with
Fatalities of Migratory
Tree-Roosting Bats at
Wind Energy Facilities:
An Initial Assessment

Prepared by:
Kimberly Peters, Ian Evans,
Elizabeth Traiger, Jon Collins,
Cristen Mathews, Amanda Klehr

April 13, 2020

AN AWWI TECHNICAL REPORT

Landscape Factors Associated with Fatalities of Migratory Tree-Roosting Bats at Wind Energy Facilities

Landscape Factors Associated with Fatalities of Migratory Tree-Roosting Bats at
Wind Energy Facilities: An Initial Assessment

Wind Wildlife Research Fund
c/o American Wind Wildlife Institute
1990 K St. NW, Suite 620
Washington, DC 20006

For Release April 13, 2020

The Wind Wildlife Research Fund is an industry-led initiative that pools resources to advance collaborative,
priority research to produce scientifically robust solutions that enable the continued expansion of wind
energy while advancing wildlife conservation. The Fund is managed by the American Wind Wildlife Institute
(AWWI), and independent 501(c)3 organization. Learn more at www.awwi.org/wind-wildlife-research-fund.

Find this document online at www.awwi.org/resources/wwrf-landscape-factors-bats-2019

Acknowledgments
Thank you to the Wind Wildlife Research Fund for funding this research project. Thank you also to data
contributors to the American Wind Wildlife Information Center (AWWIC) and to all of the field teams that
were involved with collecting these data. Finally, thank you to Erin Baerwald for her assistance with study
design, analysis, and reporting as well as the three independent anonymous reviewers for their review and
comment on this report.

Prepared By
Kimberly Peters1, Ian Evans1, Elizabeth Traiger2, Jon Collins3, Cristen Mathews1, Amanda Klehr1
 1
 DNV GL Energy, Project Development & Engineering, Environmental and Permitting Services
 2
 DNV GL Energy, Group Technology & Research, Power and Renewables
 3
 DNV GL Energy, Data Analytics, Renewable Energy Analytics

Suggested Citation Format
Peters, K., I. Evans, E. Traiger, J. Collins, C. Mathews, A. Klehr. 2020. Landscape Factors Associated with
Fatalities of Migratory Tree-Roosting Bats at Wind Energy Facilities: An Initial Assessment. AWWI
Technical Report. Washington, DC. Available at www.awwi.org. © 2020 American Wind Wildlife Institute.
This report is the second product of the Wind Wildlife Research Fund.

April 13, 2020 2
Landscape Factors Associated with Fatalities of Migratory Tree-Roosting Bats at Wind Energy Facilities

Contents
Abstract ................................................................................................................................................................ 7

1 Introduction ....................................................................................................................................................... 7

 1.1 Wind Energy and Migratory Tree-Roosting Bats ..................................................................................... 8

 1.2 Objective and Scope of Analysis............................................................................................................ 10

2 Methods .......................................................................................................................................................... 11

 2.1 Fatality Data ............................................................................................................................................ 11

 2.2 Landscape Metrics ................................................................................................................................. 19

 2.2.1 Literature Review: Landscape Metrics ........................................................................................... 19

 2.2.2 Landscape Definition ...................................................................................................................... 19

 2.2.3 Data Processing .............................................................................................................................. 23

 2.2.4 Landscape Metric Calculation ........................................................................................................ 26

 2.3 Statistical Analyses ................................................................................................................................ 31

 2.3.1 Case Weighting................................................................................................................................ 31

 2.3.2 Random Forests Analysis ............................................................................................................... 31

 2.3.3 Predictive Modeling ......................................................................................................................... 32

3 Results ............................................................................................................................................................. 33

 3.1 Random Forests ...................................................................................................................................... 33

 3.2 Predictive Modeling ................................................................................................................................ 38

4 Discussion ....................................................................................................................................................... 45

 4.1 Study Limitations .................................................................................................................................... 46

 4.2 Study Implications .................................................................................................................................. 47

5 Literature Cited ............................................................................................................................................... 49

6 Appendix A: Distribution of Fatality Rates..................................................................................................... 59

April 13, 2020 3

Landscape Factors Associated with Fatalities of Migratory Tree-Roosting Bats at Wind Energy Facilities

Tables
Table 1. Assumption: bat carcass distribution around turbines (applied to all wind energy
 facilities included in the analysis)............................................................................................. 16

Table 2. Assumption: Searchable area around turbines (applied to all wind energy facilities
 included in the analysis). ........................................................................................................... 17

Table 3. Assumption: density-weighted proportion (dwp) of carcasses that were available
 for observation (applied to wind energy facilities included in the analysis
 according to reported search plot size). .................................................................................. 17

Table 4. Summary of fatality data included in landscape models. .......................................................18

Table 5. Summary of landscape metrics literature review. Studies include those from
 North America and Europe that identified landscape-scale factors associated
 with bat activity or risk of fatality from wind energy facilities; exploratory review
 includes non-target species. ..................................................................................................... 21

Table 6. GIS datasets used in the landscape analysis........................................................................... 23

Table 7. Mapping of source dataset classes to the final land cover layer used in the
 landscape analysis. ................................................................................................................... 24

Table 8. Calculated landscape metrics. ................................................................................................. 28

Table 9. Transformed variables. ............................................................................................................. 33

Table 10. Random Forest Results: Informative Variables included in GLM candidate
 models. ....................................................................................................................................... 34

Table 11. Top performing generalized linear models (GLM), Region 3. Models defined as
 having strong support include those with AICc scores within two points of the
 top-performing model................................................................................................................ 40

Table 12. Top performing generalized linear models (GLM), Region 5. Models defined as
 having strong support include those with AICc scores within two points of the
 top-performing model................................................................................................................ 42

Table 13. Parameter estimates (LCI, 95% lower confidence intervals; UCI, 95% upper
 confidence intervals) for factors related to Region 3. Weighted estimates are
 derived from the top performing generalized linear models (GLM) displayed in
 Table 11. Bolded values indicate significant landscape effect at P < 0.05............................43

Table 14. Parameter estimates (LCI, 95% lower confidence intervals; UCI, 95% upper
 confidence intervals) for factors related to Region 5. Weighted estimates are
 derived from the top performing generalized linear models (GLM) displayed in
 Table 12. Bolded values indicate significant landscape effect at P < 0.05............................44

April 13, 2020 4
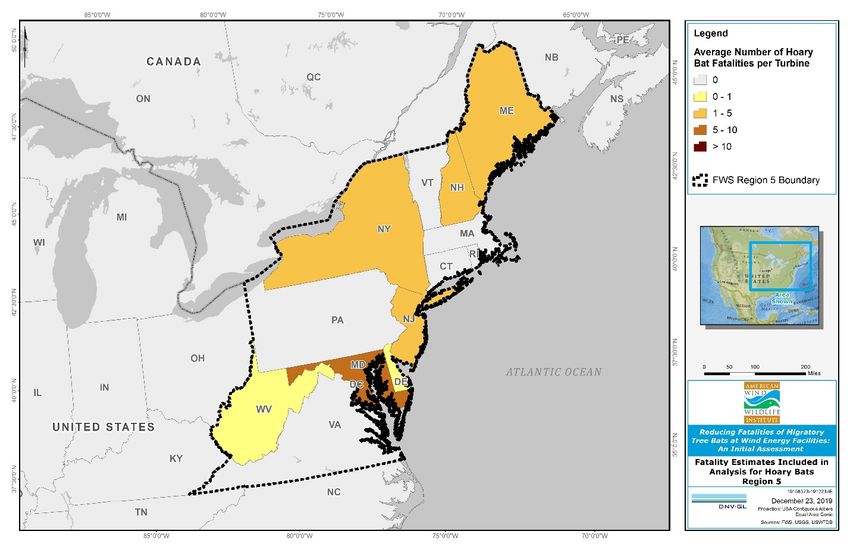
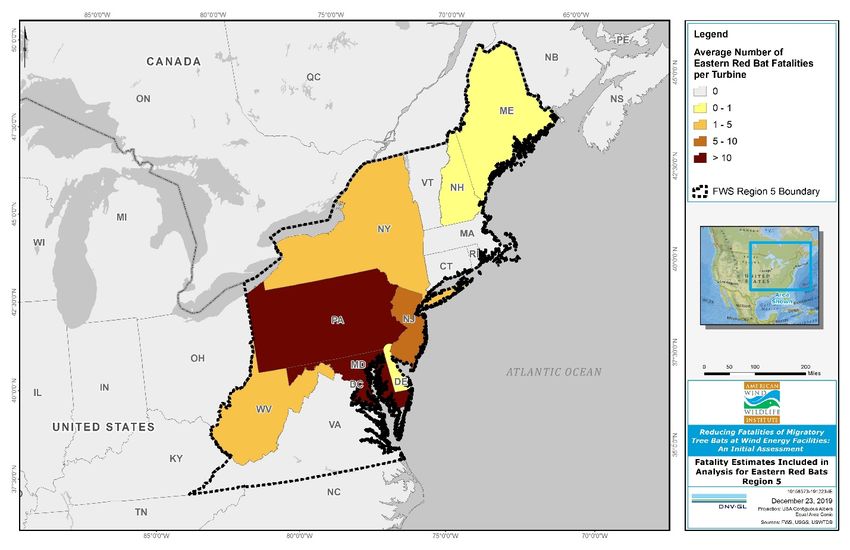
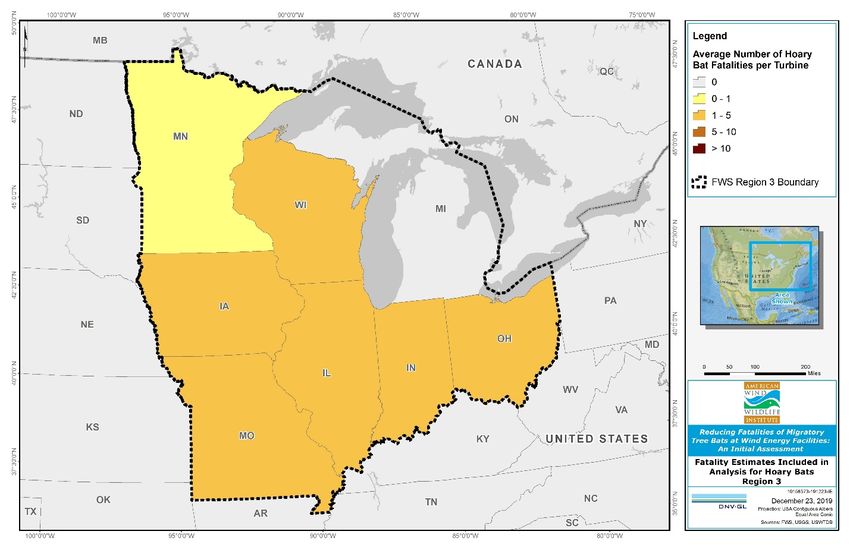
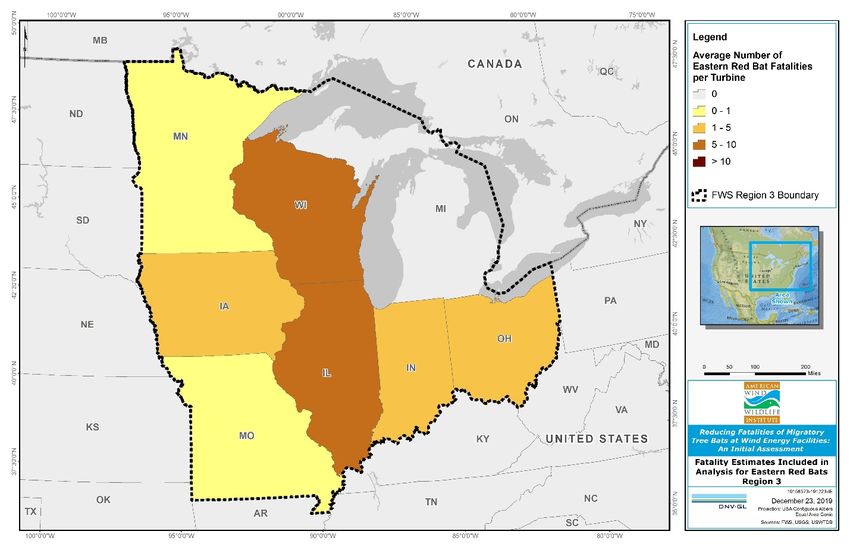
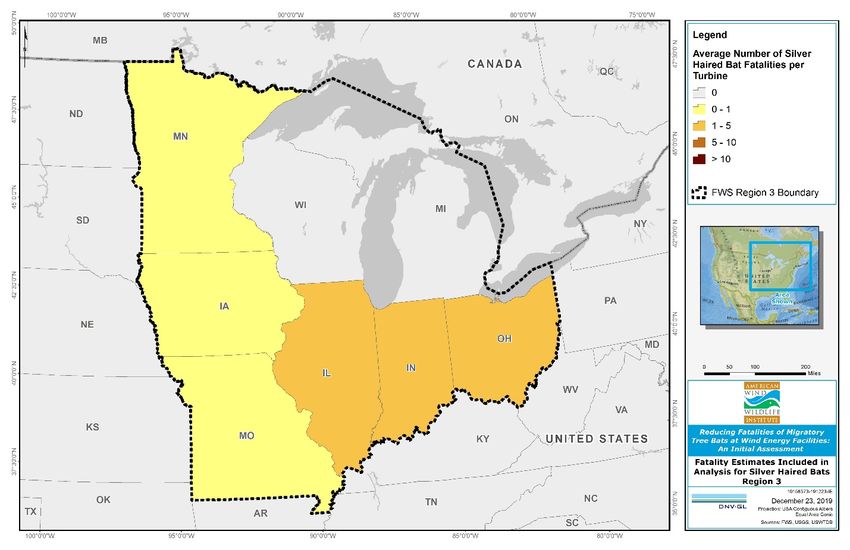
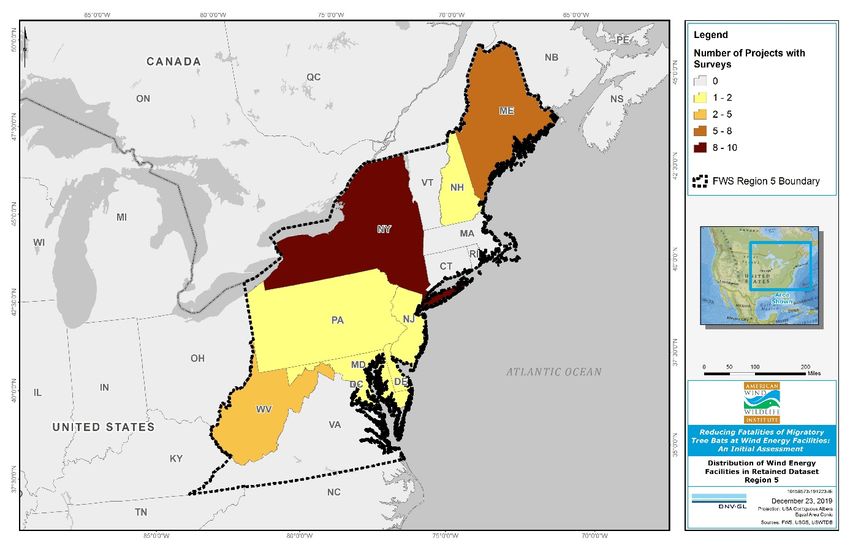
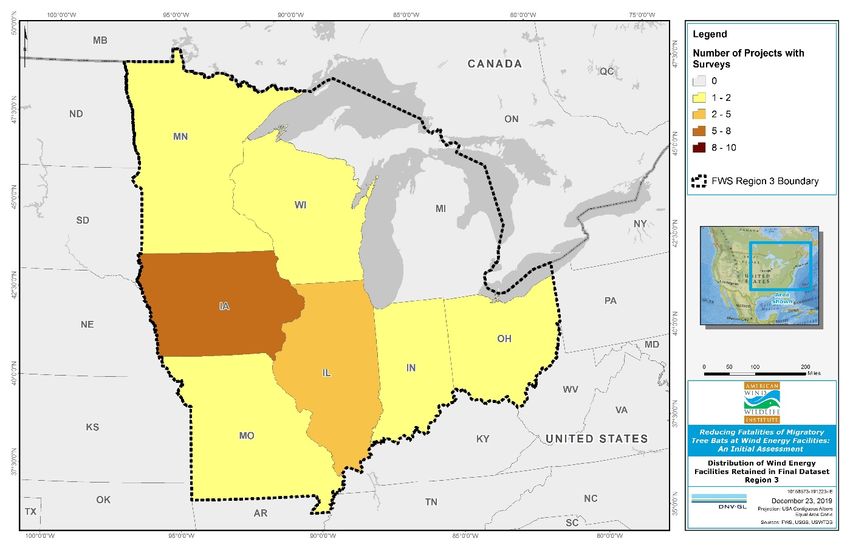
Landscape Factors Associated with Fatalities of Migratory Tree-Roosting Bats at Wind Energy Facilities

Figures
Figure 1. Distribution of wind energy facilities retained in final dataset: U.S. Fish and
 Wildlife Service (USFWS) Region 3. .......................................................................................... 12

Figure 2. Distribution of wind energy facilities retained in final dataset: U.S. Fish and
 Wildlife Service (USFWS) Region 5. .......................................................................................... 13

Figure 3. Illustration of turbine area-scale (represented by blue boundary) definition. Points
 represent individual turbine locations. ..................................................................................... 20

Figure 4. Merged Region 3 and Region 5 land cover map. Land cover extent covers the
 subset of wind projects included in the analyses plus 100 km. .............................................25

Figure 5. GLM Model-averaged importance of terms from all candidate models. Vertical
 red line at .80 indicates differentiation between important and less important
 variables. Independent variable codes are defined in Table 10..............................................36

Figure 6. GLM Model-averaged importance of terms from models within 2 AICc of best fit
 model. Vertical red line at .80 indicates differentiation between important and
 less important variables. Independent variable codes are defined in Table 10. ...................37

Figure 7. DNV GL-adjusted Shoenfeld fatality per turbine distributions. ...............................................38

Acronyms and Abbreviations
3DEP 3D Elevation Program
AWEA American Wind Energy Association
AWWI American Wind Wildlife Institute
AWWIC American Wind Wildlife Information Center
BCI Bat Conservation International
BCR Bird Conservation Region
CanWEA Canadian Wind Energy Association
DEM Digital elevation model
DOF Degrees of freedom
dwp density-weighted proportion
GenEst Generalized Estimator
GHG Greenhouse Gas
GIS Geographic Information System
GLM Generalized Linear Models
ITP Incidental Take Permit
km Kilometer
LCI Lower Confidence Interval
m Meter
MW Megawatt

April 13, 2020 5
Landscape Factors Associated with Fatalities of Migratory Tree-Roosting Bats at Wind Energy Facilities

NABCI North American Bird Conservation Initiative
NALCMS North American Land Change Monitoring System
NHD National Hydrography Dataset
PCFM Post-Construction Fatality Monitoring
QGIS Quantum Geographic Information System
SAGA System for Automated Geoscientific Analyses
TIGER Topologically Integrated Geographic Encoding and Referencing
TPI Topographic Position Index
UCI Upper Confidence Interval
U.S. United States
USFWS United States Fish and Wildlife Service
USGS United States Geological Survey

April 13, 2020 6
Landscape Factors Associated with Fatalities of Migratory Tree-Roosting Bats at Wind Energy Facilities

Abstract
Addressing risk to potentially vulnerable bat species from wind energy development has been identified
as a high priority by the wind industry and other conservation stakeholders. Improving understanding of
the large-scale ecological and geographical factors associated with potential collision risk is particularly
important as many decisions regarding risk avoidance are made during the siting and design phases of a
wind energy facility, and the identification of potentially higher or lower risk areas for bats can inform
these early-stage decision processes as well as provide guidance for state or regional-level planning by
agencies or conservation organizations. However, few studies have been conducted to explore the
relationships among landscape-level factors and risk to bats from wind energy operations. This study
examined fatality rates of three species of migratory tree-roosting bats commonly observed as fatalities
at operational wind energy facilities - hoary bat (Lasiurus cinereus), silver-haired bat (Lasionycteris
noctivagans) and eastern red bat (Lasiurus borealis) - in relation to landscape-scale features at varying
scales in the midwestern and northeastern regions of the United States. A multistage process including
ensemble learning (random forests) and predictive modeling (generalized linear models) was used to
explore associations between bat fatality rates, based on data collected during post-construction fatality
monitoring studies at individual wind energy facilities throughout the two regions, and various landscape
metrics calculated at the local, 2.5-kilometer (km), 5-km and 25-km, scales. Findings indicated that
landscape structure at the broadest scale examined was most strongly associated with fatality rates, and
revealed both similarities and differences between the two regions. In the midwestern region, a positive
association between fatality rates and the proportion of developed land occurring within 25-km facility
buffers was observed for all three of the target species, a pattern that was also observed for hoary bat
and silver-haired bat in the northeastern region. In the midwestern region a negative relationship with
road density was also observed at the 25-km scale whereas at the turbine area (i.e., local, facility-level)
scale fatality rates of the three target species tended to increase with road density. Hoary and eastern red
bat fatality rates were also higher in the midwest region when small disaggregated patches of open, non-
cultivated habitat as opposed to clumped, larger patches occurred within and adjacent to facilities.
Finally, silver-haired bats were observed as fatalities at higher rates in the midwestern region when more
turbines occurred on the broader landscape. Wetland structure was also associated with fatality rates in
both regions. For example, in the northeastern region, fatality rates for hoary, and eastern red bats were
highest when facilities were located in landscapes characterized by wetland complexes comprising large
and small wetland patches. The landscape patterns revealed in this study and others can better inform
future research and siting decisions and feed into an adaptive learning process that will, over time, reduce
uncertainty and lead to an improved understanding of factors associated with bat collision risk at wind
facilities. It is anticipated that this enhanced understanding will further assist in the development of more
accurate tools for assessing this risk and lead to the identification of scientifically-informed options for
avoiding, minimizing, and mitigating risk to bats.

1 Introduction
Over the last decade, wind energy has become one of the fastest growing sources of new electricity
generation in the United States (U.S.), with over 97,000 megawatts (MW) of installed capacity in 41 states,
Guam and Puerto Rico as of mid-2019 (American Wind Energy Association [AWEA] 2019a, 2019b). The
rapid pace of wind development across North America as well as in Europe and globally has led to
questions about the potential impacts of wind energy on bats and other wildlife (Rydell et al. 2010; Voigt
et al. 2015; Frick et al. 2017; Allison et al. 2019). Concerns about wind-energy effects on bats have
resulted in a growing body of research focused on identifying bat species that may be at risk from turbine
blade collisions, informing siting decisions, and defining effective mitigation strategies to minimize
potential impacts (Ellison 2012; Canadian Wind Energy Association [CanWEA] and DNV GL 2018).
Although bat populations are difficult to monitor in terms of population status, trends and demographics
(Kunz et al. 2007; Arnett et al. 2013; Goodrich-Mahoney 2014; Hammerson et al. 2017), bats are

April 13, 2020 7
Landscape Factors Associated with Fatalities of Migratory Tree-Roosting Bats at Wind Energy Facilities

considered to be one of the most threatened groups of vertebrates in North America that are not
associated with aquatic habitats, particularly in the northern and eastern regions of the continent
(Hammerson et al. 2017). Conservation efforts aimed at bat populations are further challenged by a
limited understanding of the influence of any single source of mortality on bat populations or on the
effectiveness of mitigation strategies to minimize potential impacts (Ellison 2012; Thompson et al. 2017;
Loss et al. 2019).

For wind energy facilities, uncertainties regarding risk to bats are particularly pronounced at the siting
stage of development. Decisions pertaining to facility site selection, turbine micrositing, and defining
turbine setback distances from potential bat-concentrating habitats are currently based on a general
ecological understanding of species and habitat requirements. There is little published evidence,
however, to indicate that siting facilities or turbines in or away from specific habitats or features is likely
to avoid the risk of bat collisions. As a result, addressing risk to potentially vulnerable bat species by
improving understanding of the large-scale ecological, geographical, and meteorological factors
associated with this risk has been identified as a high priority by the wind industry and other conservation
stakeholders (Thompson et al. 2017; CanWEA and DNV GL 2018). In April 2019, the American Wind
Wildlife Institute (AWWI) and its members, having recognized a need for having a stronger understanding
of landscape features that might explain variation in risk to potentially vulnerable bat species,
commissioned DNV GL to conduct an analysis of the bat fatality data available in the American Wind
Wildlife Information Center (AWWIC) database collected within U.S. Fish and Wildlife Service (USFWS)
Regions 3 (Midwest Region) and 5 (Northeast Region). The primary goal of the analysis was to identify
general associations between fatality rates observed at operational wind facilities and habitat factors at
various landscape scales that can be used to inform risk-prediction assessments and siting decisions;
specific objectives are detailed in Section 1.2.

1.1 Wind Energy and Migratory Tree-Roosting Bats
Although little is known about the potential for population-level impacts to bats from wind energy
developments, migratory tree-roosting bats (i.e., species that typically roost in trees and perform long-
distance migrations) appear to be the most vulnerable species in terms of collision risk (Barclay et al.
2017; Thompson et al. 2017). Characteristics of the migratory behavior (e.g., flight paths, height,
navigation, stopover habitat) of the species most commonly observed at wind facilities (Barclay 1984;
Cryan 2003; CanWEA and DNV GL 2018) are also not well understood; however, collision risk is expected
to be greater during flights to and from breeding grounds due to the fact that migratory bats typically fly
more frequently and at greater distances during these time periods (Cryan and Barclay 2009). In North
America, over 70-% of bat fatalities recorded at wind energy facilities represent migratory species, with
hoary bat (Lasiurus cinereus), silver-haired bat (Lasionycteris noctivagans), and eastern red bat (Lasiurus
borealis) comprising the majority of fatalities observed at wind energy facilities in Canada and the U.S. .
Ranges of these three species overlap the northeastern and central regions of the U.S. (Bat Conservation
International [BCI] 2016), where overall bat fatality levels have been identified as a particular concern
(Fargione et al. 2012; Gruver and Bishop-boros 2015). Although based on limited demographic data and
contingent in large part on expert elicitation, recent modeling efforts also suggest that wind energy
fatalities may contribute to population declines in hoary bat (Frick et al. 2017). Across regions, bat
fatalities tend to peak during the fall migratory period, which spans from approximately mid-July through
October (AWWI 2018a).

Risk to individual species is likely driven by differences in habitat associations as well as in foraging,
breeding, migration and hibernation ecology, and phenology. Summaries of the factors associated with
potential risk to the three target species in the analysis are provided below.

Hoary bat: Hoary bat is one of the most widespread bats in North America and is considered a common
species throughout its range, which includes all states within USFWS Regions 3 and 5 (Weller et al. 2016;
CanWEA and DNV GL 2018; AWWI 2018a). Population trends for the species are generally unknown, but

April 13, 2020 8
Landscape Factors Associated with Fatalities of Migratory Tree-Roosting Bats at Wind Energy Facilities

some evidence indicates that population declines are occurring in some U.S. regions (Winhold et al. 2008;
Frick et al. 2017; Rodhouse et al. 2019). Hoary bat is the most frequently observed species during post-
construction fatality monitoring (PCFM) studies at wind energy facilities in North America, with
examinations of published reports indicating that hoary bats comprise approximately 32% of total turbine-
caused fatalities in the U.S. (AWWI 2018a) and approximately 31% of total turbine-caused fatalities in
Canada (Bird Studies Canada et al. 2018). Hoary bat fatalities are widely distributed, having been
observed at over 90% of facilities for which PCFM results are available (AWWI 2018a; Bird Studies
Canada et al. 2018). Some studies indicate that male hoary bats may experience more fatalities than
females and that adults are at greater risk than subadults (Baerwald and Barclay 2011; Burba 2013),
potentially due to risky behaviors displayed during the breeding period (Cryan 2008). Little is known about
migratory behavior (e.g., movement patterns) of the species, but risk of fatalities tends to be highest
during peak fall migration periods (Baerwald and Barclay 2011). Hoary bat activity appears to be
associated with forest edges or clearings (Jantzen and Fenton 2013), and the species tends to forage
along streams and other waterbodies (Valdez and Cryan 2009). Hoary bat activity has also been
potentially linked to low wind speeds, low moon illumination, low barometric pressure, and high cloud
cover (Cryan and Brown 2007; Baerwald Barclay 2011).

Silver-haired bat: Silver-haired bat is found throughout most of North America including all states within
USFWS Regions 3 and 5 (BCI 2016). Little is known about population size or trends for the species, but it
is commonly found at wind energy facilities during fatality searches and makes up approximately 16% of
reported fatalities in the United States (AWWI 2018a) and approximately 22% of reported fatalities in
Canada (Bird Studies Canada et al. 2018). Silver-haired bats use a variety of habitats but appear to prefer
mature hardwood stands in the vicinity of ponds or streams for roosting (Barclay et al. 1988) and
disturbed areas such as small clearings or roadways for foraging (Owen et al. 2004). The species is also
known to forage along watercourses (Kunz 1982) and in some cases have been shown to prefer small
forested patches over contiguous forest stands (Ethier and Fahrig 2011).

Eastern red bat: Eastern red bat is likely one of the most abundant tree-roosting bats in the U.S. and
known to occur in all states in USFWS Regions 3 and 5 (Arnett et al. 2009; Jones et al. 2009; BCI 2016).
While population size and trends for the species are generally unknown, there has been some evidence to
indicate that numbers are declining in some regions of the U.S. including the upper Midwest (Winhold et
al. 2008; Alves et al. 2014). PCFM reports from wind energy facilities indicate that the species comprises
approximately 24% of the total fatalities observed across the U.S. (AWWI 2018a) and approximately 21%
in Canada (Bird Studies Canada et al. 2018). Eastern red bats often roost within the foliage of deciduous
trees and appear to prefer mixed hardwood forests (Hutchinson and Lacki 2000; Mager and Nelson
2001). The species is generally associated with contiguous forests with limited openings but in some
cases has been shown to use fragmented areas (Ethier and Fahrig 2011), for instance demonstrating a
positive response to selective logging that opens up coniferous forest canopies (Jung et al. 1999).

In general, landscape factors at varying scales have the potential to influence both bat activity and bat
fatality rates at wind energy facilities. Although studies that have taken a landscape-scale or multi-scale
approach to bat-habitat associations are limited, research conducted in the U.S. and globally indicates
that landscape structure and context at broad scales may play an important role in habitat selection or
risk of fatality (Starbuck et al. 2015; Baerwald 2018). For example, North American migratory tree-
roosting bats are generally associated with forest systems that they rely on for roosting and foraging, and
multiple studies from the U.S. and Europe have demonstrated relationships between bat activity or
abundance and forest patch attributes at scales ranging from less than 200 meters (m) to multiple
kilometers (km) (Ethier and Fahrig 2011; Gillespie 2013; Starbuck et al. 2015; Maxell and Burkholder
2017). Other landscape factors demonstrated as having relationships to activity of North American
and/or European bat species have included proximity to and extent of adjacent wetlands (Fulton et al.
2014; Maxell and Burkholder 2017), proximity to streams or rivers (Grindal et al. 1999; Gillespie 2013;
Heist 2014; Maxell and Burkholder 2017; Silva et al. 2017), proximity to roads (Siemers and Schaub 2011;
Maxell and Burkholder 2017), proportion of urbanized areas in the surrounding landscape (Starbuck et al.

April 13, 2020 9
Landscape Factors Associated with Fatalities of Migratory Tree-Roosting Bats at Wind Energy Facilities

2015), soil regimes (Maxell and Burkholder 2017), degree of surrounding landscape fragmentation (Ethier
and Fahrig 2011; Johnson et al. 2008; Jantzen and Fenton 2013), and shape and configuration of various
other landcover categories (Ferreira et al. 2015; Heim et al. 2015). Bat activity has also been shown to be
associated with meteorological conditions such as wind speed, temperature, relative humidity and wind
direction (Baerwald and Barclay 2011; Amorim et al. 2012; Gillespie 2013; Frick et al. 2012; Silva et al.
2017; Muthersbaugh et al. 2019;), some of which may be influenced by landscape factors related to
topography or landcover.

It is also likely that local and landscape factors associated with bat activity are context-dependent,
wherein habitat selection and other ecological processes vary according to the broader landscape (Gehrt
and Chelsvig 2003; Jackson 2013; McGarigal et al. 2016). Context-dependency in habitat selection is
particularly prevalent in highly mobile species like migratory bats (Fuentes-Montemayor et al. 2017).
Indeed, studies have indicated that bat-habitat associations differ between predominately wooded or
urbanized landscapes and those comprised primarily of open, agricultural lands (Gehrt and Chelsvig
2003; Elmore et al. 2005; Jackson 2013; White et al. 2017), with landscape-scale characteristics
potentially playing a greater role in driving habitat use in more homogeneous, agricultural landscapes
(Fuentes-Monemayor et al. 2017; Monck-Whipp et al. 2018, but see Starbuck et al. 2015).

Although several landscape-level factors related to bat presence and habitat use have been identified, few
studies have been conducted to assess potential landscape factors associated with bat fatality risk from
wind energy facilities. Recent analysis of publicly available hoary bat fatality data from Ontario indicates
that a greater extent of cultivated crops, trees, and water within the broader landscape may impact
fatality rates (Baerwald 2018). Conversely, Thompson et al. (2017) found that across the U.S. there was a
negative relationship between grassland cover and reported bat fatality rates; however, these results were
likely due to national-scale patterns driven by higher fatality rates typically observed in the Northeast
relative to less forested areas such as the Southwest. The Thompson et al. (2017) study also only
included two facilities in the Midwest region of the U.S. Risk to bats from wind energy collisions is also
likely to be context-dependent and to differ between facilities juxtaposed within predominantly forested
regions such as the Northeast and those in regions dominated by open, agricultural lands such as the
Midwest. Factors associated with potential risk to bats are also likely to occur at multiple scales within
these differing landscape contexts, and few multi-scale studies have been conducted to identify the
scales at which landscape characteristics may influence bat activity or collision risk.

1.2 Objective and Scope of Analysis
The overall goal of the study was to provide scientific support for predicting fatality rates at wind energy
facilities for hoary bat, eastern red bat, and silver-haired bat based on location and surrounding landscape
characteristics. Additional landscape features that have the potential to be relevant to the three target
species were also identified and examined, based on available habitats within USFWS Regions 3 and 5,
species natural history and ecology, and known species-habitat associations. Specific objectives of the
research were to:

 • Compile findings from PCFM studies for the three target species, identify data gaps, and acquire
 additional data as needed in coordination with AWWI;
 • Standardize available fatality data to the extent practicable for incorporation into predictive
 models;
 • Calculate landscape metrics at multiple scales likely to be associated with the three target
 species, for wind energy sites in the fatality dataset and based on available publications and
 reports;
 • Identify landscape features associated with observed fatality rates for each of the three target
 species through a multistage process including ensemble learning (random forests) and
 predictive modeling; and

April 13, 2020 10
Landscape Factors Associated with Fatalities of Migratory Tree-Roosting Bats at Wind Energy Facilities

 • Assess generalities and differences among species and regions and discuss the value of the
 study’s findings for predicting risk to bats at wind energy facilities not included in the analysis.

2 Methods
2.1 Fatality Data
The AWWIC database, a cooperative initiative of wind energy companies and AWWI, is maintained by
AWWI and contains data collected during PCFM studies at individual wind energy facilities. As of July
2018, the AWWIC database contained information from 227 PCFM studies conducted at 146 wind energy
facilities in the U.S., including records of 15,786 bat fatality incidents from 210 studies (AWWI 2018a).
DNV GL and AWWI consulted the AWWIC database to evaluate the quantity and properties of bat fatality
data currently in the database, identify potential data gaps, and define target areas for acquiring
additional data.

Data from wind energy facilities were retained for analysis based on the following criteria defined by DNV
GL and AWWI:

 • Were from facilities located within the range of the three target species (i.e., hoary bat, eastern
 red bat, and silver-haired bat);
 • Were from facilities located in USFWS Region 3 or Region 5;
 • Were collected by scheduled searches throughout the temporal window that encompassed peak
 fall migration periods for all three species, defined as 15 July - 15 October;
 • Were based on formal PCFM studies that accounted for, at minimum, searcher detection bias and
 carcass removal bias (Huso et al. 2016; Johnson et al. 2016);
 • Were from facilities that were not known to be implementing curtailment (i.e., raised cut-in
 speeds) at one or more turbines during the PCFM period; and
 • Included the following additional fields – facility location (latitude/longitude), facility size
 (number of turbines, total operating capacity in MW), mean hub height, year, start and end dates
 of PCFM, search plot size, number of turbines searched, mean search interval (days between
 searches), searcher efficiency rate (percent observed), carcass persistence rate (average time of
 carcass removal), and raw counts of hoary bat, eastern red bat, and silver-haired bat fatalities
 observed during PCFM studies (excluding incidental observations).

The temporal window criterion was implemented to ensure that the peak migration periods for each of
the target species was fully captured within each study; peak migration in the northeastern U.S. and
southern Canada typically occurs from mid-July through late-September for hoary and eastern red bats,
whereas silver-haired bat migration tends to occur from mid-August to mid-October (AWWI unpublished
data; AWWI 2018a; CanWEA and DNV GL 2018; Bird Studies Canada et al. 2018). Additional fields
associated with facility conditions and study design were identified as necessary for fatality data
standardization or for potential integration into predictive fatality models.

A total of 52 PCFM studies from 34 wind energy facilities in the AWWIC database initially met the filtering
criteria. A subsequent data call was issued to AWWI members from 3 May - 30 June 2019, resulting in a
revised total of 69 studies from 47 wind facilities to be included in the analyses, with the final dataset
comprising 6,904 fatality records of the three target species. Of these represented facilities, 20 were
located in USFWS Region 3 and 27 were located in Region 5. Within Region 3, sites with applicable data
primarily occurred in Iowa and Illinois (Figure 1), whereas site distribution was skewed towards New York
and Maine in Region 5 (Figure 2). Studies retained for analysis were conducted between 2006 and 2015.

April 13, 2020 11
Landscape Factors Associated with Fatalities of Migratory Tree-Roosting Bats at Wind Energy Facilities

Figure 1. Distribution of wind energy facilities retained in final dataset: U.S. Fish and Wildlife Service
(USFWS) Region 3.

April 13, 2020 12
Landscape Factors Associated with Fatalities of Migratory Tree-Roosting Bats at Wind Energy Facilities

Figure 2. Distribution of wind energy facilities retained in final dataset: U.S. Fish and Wildlife Service
(USFWS) Region 5.

In addition to raw counts of the three focal species, reporting from each of the studies used in the
analysis also included cumulative fatality estimates for all bats (i.e., all species combined), with results
recorded as total estimated number of fatalities per turbine per study year and/or total estimated number
of fatalities per MW per study year. Fatality estimates were not reported for individual species including
the three focal species of the current study. Reported total fatality estimates were derived from various
estimation methodologies (i.e., equations) including those developed by Shoenfeld (Shoenfeld Estimator,
n=29 studies; Shoenfeld 2004), Huso (Huso Estimator, n=21; Huso 2011), Smallwood (Smallwood
Estimator, n=2; Smallwood 2007), Jain (Jain Estimator, n=13; Jain et al. 2007) and modified versions
thereof. A small number of studies (n=3) employed the Empirical Pi (i.e., binomial trials) estimation
method, which treats overall detection probability ( �, or probability that a carcass is available for
detection and detected) as a simple product of carcass persistence probability and searcher efficiency
(described in Korner-Nievergelt et al. 2012; Huso et al. 2016). One older study reported only the Naïve
Estimate (Johnson et al. 2003), which is prone to severe bias (e.g., underestimating fatality rates by as
much as 98.5%; Huso 2011) and is typically not used in more current studies (Erickson et al. 2014).

Choice of estimator has been demonstrated to have significant influence on avian and bat fatality
estimates, each of which is prone to various levels of bias contingent on study conditions (Bernardino et
al. 2013; Johnson et al. 2016; Huso et al. 2016; CanWEA and DNV GL 2018; Péron 2018); whether or not a
method produces biased estimates depends on how well the data meet the implicit assumptions of the
method chosen. It has therefore proved challenging to compare estimates among facilities and regions,
with various approaches being applied such as: weighting estimates based on average bias observed in
comparative or simulation studies (Erickson et al. 2014); analyzing reported estimates under the
assumption that the best estimator was adopted for each study (Arnett et al. 2013; AWWI 2018b);
calculating estimates for individual species using assumed proportional take (Thompson et al. 2017);
proactively designing studies to use a particular estimator (Baerwald and Barclay 2009); or, data

April 13, 2020 13
Landscape Factors Associated with Fatalities of Migratory Tree-Roosting Bats at Wind Energy Facilities

permitting, re-calculating estimates to conform to a single estimator (Zimmerling et al. 2013; Bird Studies
Canada et al. 2018; Zimmerling and Francis 2016; Baerwald 2018). It is generally understood that there
are now more robust methods available for comparing estimates among wind energy facilities, such as
the Generalized Estimator (GenEst), which was recently developed by the U.S. Geological Survey (USGS)
and collaborators (Dalthorp et al. 2018) and is specifically designed to minimize potential bias within
individual studies and allow for comparative analysis among studies, and process-based, capture-
recapture model structures (Péron et al. 2013; Péron and Hines 2013; Péron 2018). However, these
methods are data intensive and require multiple facility-level attributes that are often not captured or
reported on within individual studies, including the majority of studies included in the AWWIC database.

Based on the available data for the current study, it was determined that the best approach to
standardization was to calculate a modified Shoenfeld fatality estimate (Shoenfeld 2004; Strickland et al.
2011) from raw counts of each species recorded between 15 July and 15 October as:

(1) =
 � �
 ∗ −1
 � ∗ � ×
 � �
 −1+

Where:

 n = estimated number of fatalities
 c = number of fatalities observed
 t = average time of carcass persistence in days
 p = proportion of carcasses found by searchers
 I = average interval between searches in days
 dwp = density-weighted proportion of carcasses that were available for detection during searches

The Shoenfeld Estimator was selected because sufficient data required to generate the estimate were
provided for all available studies, whereas detailed data (e.g., carcass persistence distribution) needed for
more recently-developed estimators (Huso 2011) were not. Furthermore, fatality rates were estimated for
the three target species based on raw data rather than on reported total bat fatality estimates (e.g., by
isolating detection probability [ �] estimates for all species combined and applying to raw counts for each
species), because the individual conditions and detailed methodologies of each study, and therefore level
of bias, were unknown (Huso et al. 2016).

The Shoenfeld Estimator was initially developed as an attempt to correct for underestimation of fatalities
by the Naïve Estimator (Huso 2011) and uses Monte Carlo/bootstrapping methods for estimating
confidence intervals (Bernardino et al. 2013). As there are numerous assumptions associated with the
Shoenfeld Estimator, it should be acknowledged that it is likely that one or more assumptions were
violated in the current study. Assumptions of the model include (Sonnenberg and Erickson 2011; Warren-
Hicks et al. 2013; Strickland et al. 2011; list excerpted and modified from CanWEA and DNV GL 2018):

 • An exponential carcass removal rate;
 • All bats killed are eventually either found (and removed) by researchers or removed by
 scavengers;
 • Regular search intervals (an earlier version of equation assumed that search intervals were a
 Poisson process [Shoenfeld 2004]);
 • All searchers achieve the average searcher efficiency rate;

April 13, 2020 14
Landscape Factors Associated with Fatalities of Migratory Tree-Roosting Bats at Wind Energy Facilities

 • All carcasses (old and new) have the same probabilities of discovery (discovery failures are
 entirely random with respect to carcass age);
 • Fatality rates and searcher efficiency are approximately constant over time; and
 • Bleed-through (i.e., carcasses not detected by searchers persist until a subsequent search,
 making it available for future detection) occurs throughout the study.

The Shoenfeld Estimator assumes exponential carcass removal by scavengers and is thus sensitive to
changes in removal rates (Erickson et al. 2014; Johnson et al. 2016). The estimator also assumes
constant searcher efficiency over time and space, which is difficult to achieve in reality as searcher
efficiency is likely to vary according to season, habitat types, time of day, time since survey was initiated,
search conditions and searcher (Sonnenberg and Erickson 2011; Korner-Nievergelt et al. 2012; Warren-
Hicks et al. 2013; Bernardino et al. 2013; Peters et al. 2014). Carcasses missed in prior searches may be
more likely to be overlooked on subsequent visits, especially as they decompose (Warren-Hicks et al.
2013; Huso et al. 2016). Violation of the constant searcher efficiency assumption is less likely to bias
results when shorter search intervals are implemented (Huso 2011; review in CanWEA and DNV GL 2018).
The Shoenfeld Estimator is generally understood to bias fatality rates low, especially when carcass
persistence and searcher efficiency variables vary over time (Huso 2011). The Shoenfeld estimator may
generate results similar to more robust models (e.g., Huso Estimator) when search intervals are long and
carcass persistence times are short, but often differ substantially when search intervals are short and
carcass persistent times are long (Erickson et al. 2014).

The Shoenfeld Estimator as initially designed did not explicitly take into account the density-weighted
proportion (dwp) of carcasses that are available for observation during each PCFM search (Huso and
Dalthorp 2014; Huso et al. 2016; Simonis et al. 2018); the estimator (Equation [1]) was therefore modified
in the current study to account for dwp. The dwp was estimated for each of the wind energy facilities in
the current study based on two components: (1) the distribution of carcasses around each turbine, and
(2) the area searched around each turbine. The distribution of carcasses around a turbine is typically
skewed, with greater numbers of carcasses near the turbines and density of carcasses decreasing as a
function of distance from the turbine (Kerns et al. 2005; Hull and Muir 2010; Good et al. 2012; Huso and
Dalthorp 2014). Additionally, not all areas within a search plot are searchable, and any unsearchable
areas reduce the proportion of the carcass distribution effectively searched. Unsearchable areas can be
estimated by mapping the types and extent of vegetation or other ground conditions present within the
search area and used to adjust the proportion of the carcass distribution searched; however, this
information was not available within the AWWIC database. Ground cover conditions can also
substantially affect searcher efficiency (Peters et al. 2014), which may be explicitly accounted for by
using newer estimation methods such as GenEst (Simonis et al. 2018) but not addressed in this study
due to data limitations.

Robust methods have been proposed for determining carcass fall distributions by using data driven
models to improve the accuracy and precision of fatality estimates (Huso and Dalthorp 2014; Simonis et
al. 2018). The facility-level data requirements for implementing these models (e.g., carcass locations,
visibility class), however, were not available in the AWWIC database, requiring a general assumption
regarding carcass distributions across all wind energy facilities in the current study. Because a subset of
facilities within the AWWIC database included information on the distance of each reported bat carcass
from the turbine being searched (n = 6,917 total carcasses; 6,193 target species carcasses 1), the subset
distribution was used to infer the distribution of carcasses within concentric circles (10-m bins; weighted
according to whether a search included that bin) around turbines across all facilities within the study
(Table 1), with the acknowledgement that application of this broad assumption does not account for
variation among facilities, impact of searchable areas on observed distributions, and influence of
temporal factors known to impact fall distributions, such as wind direction and wind speed (Huso et al.

1
 3,012 eastern red bats; 2,007 hoary bats; and 1,174 silver-haired bats.

April 13, 2020 15
Landscape Factors Associated with Fatalities of Migratory Tree-Roosting Bats at Wind Energy Facilities

2018). For instance, emerging research indicates that as many as 5-10% of bat carcasses may fall beyond
90 m from a turbine at some wind energy facilities (D. Dalthorp, personal comm.), and it is acknowledged
that the approach applied here may bias counts low by inferring that all carcasses across facilities were
distributed within 100 m of turbines.

Table 1. Assumption: bat carcass distribution around turbines (applied to all wind energy facilities included
in the analysis).

 Search bin (m) Assumed proportion of Cumulative proportion of
 carcasses within band* carcasses in plot
 0-10 0.216 0.216
 11-20 0.180 0.396
 21-30 0.126 0.522
 31-40 0.200 0.722
 41-50 0.094 0.816
 51-60 0.069 0.884
 61-70 0.069 0.953
 71-80 0.024 0.977
 81-90 0.020 0.997
 91-100 0.003 1.00

*Based on proportion of carcasses observed at a subset of wind energy facilities, weighted by number of searches
 that included the concentric bin within the search plot.

Because the data within the AWWIC database did not include facility-specific information with respect to
ground cover and searchable areas, broad assumptions were applied based on published results from
North America (Quebec MFFP 2018; AWWI 2018a) and consultation with experienced industry
practitioners to estimate area searched within plots, with the acknowledgement that these assumptions
are highly generalized and in reality impacted by individual facility conditions such as landcover and plot-
clearing activities (Table 2).

April 13, 2020 16
Landscape Factors Associated with Fatalities of Migratory Tree-Roosting Bats at Wind Energy Facilities

Table 2. Assumption: Searchable area around turbines (applied to all wind energy facilities included in the
analysis).

 Search bin (m) Assumed proportion of band Cumulative proportion of plot
 that is searchable that is searchable
 0-10 1.00 1.000
 11-20 0.90 0.925
 21-30 0.90 0.911
 31-40 0.70 0.819
 41-50 0.60 0.740
 51-60 0.60 0.697
 61-70 0.30 0.592
 71-80 0.20 0.500
 81-90 0.10 0.416
 91-100 0.10 0.356

Overall dwp for each facility within the study, contingent on plot size searched, was estimated as the total
proportion of carcasses that were available for detection within each plot (cumulative product of the
proportion of carcasses in each band and proportion of searchable area in each band; Table 3).

Table 3. Assumption: density-weighted proportion (dwp) of carcasses that were available for observation
(applied to wind energy facilities included in the analysis according to reported search plot size).

 Search plot radius (m)* Cumulative proportion of carcasses that
 were available for observation
 40 0.631
 50 0.688
 60 0.729
 70 0.750
 80 0.754
 90 0.756
 100 0.757

*Search plot radius rounded up to nearest 10-m bin size. Radii for plot sizes that were reported as square were
 estimated as ½ plot length.

Finally, searching a subset of turbines at a wind energy facility also leaves a portion of the cumulative
carcass distribution at the wind energy facility unsampled, and was accounted for by relativizing
estimates as estimated fatalities per turbine. Table 4 provides a summary of attributes for the final
fatality dataset included in the landscape analyses (see Section 2.3); note that across-facility values
(mean, minimum, maximum) are based on reported averages from individual facilities and do not account
for variation within studies. Distribution of mean fatality estimates from facilities included in the analyses
are provided in Appendix A.

April 13, 2020 17
Landscape Factors Associated with Fatalities of Migratory Tree-Roosting Bats at Wind Energy Facilities

Table 4. Summary of fatality data included in landscape models.

 Attribute Mean (SD)
 Facility size (n turbines) 56.5(48.4)
 Facility size1 (MW) 108.7(105.4)
 Turbine capacity (MW)
 2
 1.9(0.4)
 Turbine size3(m) 82.2(6.8)
 Rotor diameter (m)
 4
 85 (11.6)
 Search interval5 (days) 7.57(5.82)
 Carcass persistence (days) 8.43(8.14)
 Searcher efficiency (percent detected) 58.17(18.9)
 Search plot radius (m) 73. 83(22.17)
 Turbines searched (percent searched) 73.31(30.57)
 Raw counts (total carcasses observed during
 PCFM):
 Hoary bat (n = 1,802) 26.57(41.44)
 Eastern red bat (n = 2,324) 33.96(56.65)
 Silver-haired bat (n = 810) 12.23(19.87)
 Fatality estimates (per turbine per year)6
 Hoary bat 3.39(5.52)
 Eastern red bat 3.97(6.71)
 Silver-haired bat 3.58(18.27)

 1Totalnameplate capacity of facility
 2Average nameplate capacity of turbines within facility
 3Average turbine hub height within facility
 4Average turbine rotor diameter within facility
 5Average search interval within PCFM study
 6Shoenfeld fatality estimate derived from raw counts; see text for details

DNV GL acknowledges that the data processing applied to the available fatality data prior to analysis
represent broad simplifications based on assumptions that were almost certainly violated. However, in
consultation with AWWI and other industry and fatality-estimation experts, it was determined that, based
on the structure and content of the AWWIC data available, applying generalized assumptions to the raw
carcass-observation data was preferable to applying reported � (i.e., overall detection probability reported
for all bat species, regardless of estimator used) to the raw data for each of the target species. The goal
of the study is to identify general associations in bat fatalities as they relate to landscape factors, and it is
believed that this approach to the data may reveal broad-scale patterns in fatality rates which can be
further explored and potentially corroborated with targeted studies specifically designed to address
related questions, such as the effects of landscape on species movements or behaviors.

April 13, 2020 18
Landscape Factors Associated with Fatalities of Migratory Tree-Roosting Bats at Wind Energy Facilities

2.2 Landscape Metrics
Various characteristics of the landscapes surrounding wind facilities in the AWWIC database were
quantified at multiple scales. Few multi-scale landscape studies have been conducted to examine bat-
habitat relationships, and studies that have examined bat response to the landscape at varying spatial
scales indicate that large-scale patterns may be associated with bat habitat use or risk of fatality at wind
facilities (e.g., Starbuck et al. 2015; Chambers et al. 2016; Baerwald 2018). Therefore, a multi-scale
landscape approach was taken with the intent of identifying not only landscape characteristics
associated with risk, but the scale at which these may associations occur. Landscape characteristics and
scales examined were based on factors identified as those likely to influence bat use and/or risk of bat
fatalities. Landscape processing followed a multistep process including: the identification of relevant
landscape metrics through a literature review, consultation with AWWI, and discussions with subject
matter experts; the definition of landscapes to be quantified; data processing of input geospatial
datasets; and the calculation of metrics.

2.2.1 Literature Review: Landscape Metrics

DNV GL conducted a literature review to identify landscape metrics potentially relevant to bat fatalities at
wind facilities (i.e., shown to be associated with bat activity or with fatality rates observed at wind
facilities; Table 5). It is acknowledged that landscape factors found to be associated with other bat
species (i.e., non-focal species), particularly those from European studies, may not be applicable to hoary,
eastern red, and silver-haired bat; however, this exercise was conducted as an exploratory effort to
identify potential scales, in general, at which bats may respond to the landscape, with a particular
emphasis on identifying patterns that emerged across species and regions. It is also acknowledged that
bat activity rates have generally not been demonstrated to be related to increased turbine collision risk
(Hein et al. 2013; Heist 2014), but these studies were included in the preliminary assessment due to a
scarcity of landscape-level research on bat fatality rates.

The most commonly identified metrics were related to the percent area or total area of land cover classes
in a landscape, or the distance between a wind facility to the nearest patch of a given land cover class.
After consultation with AWWI and subject matter experts, DNV GL expanded the pool of metric types to
quantify other landscape characteristics such as patch size, land cover dominance, patch aggregation,
and land cover diversity. The spatial scales chosen for analyses included local (facility-level, see Section
2.2.2), 2.5 km, 5 km, and 25 km. Although finer-scale habitat factors (e.g., tree composition, hedgerows,
individual human structures) are also likely to influence bat habitat use and potential risk (Gehrt and
Chelsvig 2003; Naughton 2012; Lacoeuilhe et al. 2018), the data allowed only one fatality-estimate per
species per facility (see Section 2.1) and therefore facility-level was the finest scale examined.

2.2.2 Landscape Definition

Landscapes were defined as buffers around the 47 wind energy facilities with available post-construction
bat fatality data. The turbine locations for each facility (Hoen et al. 2019) were buffered by 2.5 km, 5 km,
and 25 km, then dissolved by facility name. A fourth extent, referred to as “turbine area”, was created by
applying a negative buffer of 2,420 m to the dissolved 2.5 km polygons (Figure 3), to capture potential
local-area effects. The negative buffer application resulted in polygons that encompassed all turbines
within each facility, leaving a minimum gap of 80 m from the outermost turbines locations. The rationale
for leaving an 80 m gap was to approximate an average search distance in bat fatality surveys (Table 4).
In summary, DNV GL considered four spatial extents around 20 wind facilities in Region 3 and 27 facilities
in Region 5, for a total of 80 and 108 landscapes respectively.

April 13, 2020 19
Landscape Factors Associated with Fatalities of Migratory Tree-Roosting Bats at Wind Energy Facilities

Figure 3. Illustration of turbine area-scale (represented by blue boundary) definition. Points represent
individual turbine locations.

April 13, 2020 20
You can also read