Large hemispheric difference in nucleation mode aerosol concentrations in the lowermost stratosphere at mid- and high latitudes - Recent
←
→
Page content transcription
If your browser does not render page correctly, please read the page content below
Atmos. Chem. Phys., 21, 9065–9088, 2021
https://doi.org/10.5194/acp-21-9065-2021
© Author(s) 2021. This work is distributed under
the Creative Commons Attribution 4.0 License.

Large hemispheric difference in nucleation mode aerosol
concentrations in the lowermost stratosphere at mid-
and high latitudes
Christina J. Williamson1,2 , Agnieszka Kupc2,3 , Andrew Rollins2 , Jan Kazil1,2 , Karl D. Froyd1,2 , Eric A. Ray1,2 ,
Daniel M. Murphy2 , Gregory P. Schill1,2 , Jeff Peischl1,2 , Chelsea Thompson1,2 , Ilann Bourgeois1,2 ,
Thomas B. Ryerson2,a , Glenn S. Diskin4 , Joshua P. DiGangi4 , Donald R. Blake5 , Thao Paul V. Bui6 ,
Maximilian Dollner3 , Bernadett Weinzierl3 , and Charles A. Brock2
1 Cooperative Institute for Research in Environmental Sciences, University of Colorado, Boulder, CO 80309, USA
2 Chemical  Sciences Laboratory, National Oceanic and Atmospheric Administration, Boulder, CO 80305, USA
3 Faculty of Physics, Aerosol Physics and Environmental Physics, University of Vienna, 1090 Vienna, Austria
4 NASA Langley Research Center, Hampton, VA 23681, USA
5 Department of Chemistry, University of California Irvine, Irvine, CA 92697, USA
6 Earth Science Division, NASA Ames Research Center, Moffett Field, California, USA
a now at: Scientific Aviation, Boulder, CO 80301, USA

Correspondence: Christina J. Williamson (christina.williamson@noaa.gov)

Received: 11 January 2021 – Discussion started: 22 January 2021
Revised: 6 April 2021 – Accepted: 11 April 2021 – Published: 15 June 2021

Abstract. The details of aerosol processes and size distri-      als for climate intervention via stratospheric sulfur injection.
butions in the stratosphere are important for both heteroge-     This analysis not only adds to the, currently sparse, obser-
neous chemistry and aerosol–radiation interactions. Using        vations of the global impact of aviation, but also introduces
in situ, global-scale measurements of the size distribution      another aspect of climate influence, namely a size distribu-
of particles with diameters > 3 nm from the NASA Atmo-           tion shift of the background aerosol distribution in the LMS.
spheric Tomography Mission (ATom), we identify a mode
of aerosol smaller than 12 nm in the lowermost stratosphere
(LMS) at mid- and high latitudes. This mode is substantial
only in the Northern Hemisphere (NH) and was observed in         1   Introduction
all four seasons. We also observe elevated SO2 , an impor-
tant precursor for new particle formation (NPF) and growth,      Aerosols in the stratosphere have both radiative and chem-
in the NH LMS. We use box modelling and thermodynamic            ical effects: (i) scattering or absorbing light which cools or
calculations to show that NPF can occur in the LMS con-          warms the Earth and (ii) providing surfaces for heteroge-
ditions observed on ATom. Aircraft emissions are shown as        neous chemical reactions. Aerosol lifetimes are much longer
likely sources of this SO2 , as well as a potential source of    in the stratosphere than in the troposphere, increasing their
nucleation mode particles directly emitted by or formed in       influence (Crutzen, 2006). Recently, much attention has been
the plume of the engines. These nucleation mode particles        given to climate intervention by direct stratospheric aerosol
have the potential to grow to larger sizes and to coagulate      injection, or by injection of gas-phase species that can form
with larger aerosol, affecting heterogeneous chemistry and       particles in the stratosphere (Shepherd, 2012; Council, 2015;
aerosol–radiation interactions. Understanding all sources and    Keith et al., 2014; MacMartin and Kravitz, 2019, National
characteristics of stratospheric aerosols is important in the    Academies of Sciences, Engineering, and Medicine, 2021).
context of anthropogenic climate change as well as propos-       For these reasons, it is imperative that the background state,
                                                                 sources of, and trends in stratospheric aerosols are well un-

Published by Copernicus Publications on behalf of the European Geosciences Union.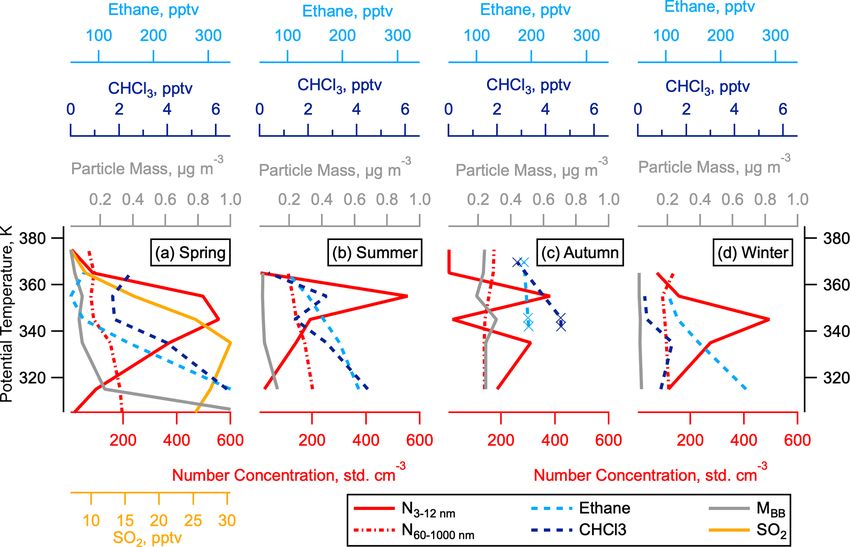
9066                                       C. J. Williamson et al.: Hemispheric difference in stratospheric aerosol number

derstood and can be accurately reproduced and predicted            tary boundary layer and in the free troposphere (Ball et al.,
by global climate models. Aerosols in the lowermost strato-        1999; Kürten et al., 2016; Bianchi et al., 2016; Smith et al.,
sphere (LMS) are highly variable, even in the absence of           2010; Almeida et al., 2013).
major volcanic eruptions (Solomon et al., 2011), and mod-             Most studies of atmospheric NPF are related to occur-
els currently struggle to reproduce observed aerosol size dis-     rence in the planetary boundary layer (PBL) (Kerminen et al.,
tributions in this region of the atmosphere (Murphy et al.,        2018). While it is obvious that the LMS is a very different en-
2020).                                                             vironment from the PBL, it is worth drawing attention to the
   Volcanic eruptions are a major source of stratospheric          ways in which the unique environment of the LMS could be
aerosols and precursor gases (Solomon et al., 2011; Vernier        important for NPF. Firstly, the colder temperature of the LMS
et al., 2011; Kremser et al., 2016). Aerosols and precur-          may influence NPF and growth in complex ways (Paaso-
sor gases can also enter the stratosphere from the tropi-          nen et al., 2013; Dada et al., 2017). Low temperatures found
cal tropopause layer (TTL) either quasi-isentropically into        in the UT and LMS reduce the vapour pressure of H2 SO4 ,
the extratropical LMS or cross-isentropically into the trop-       increasing rates of binary (H2 SO4 –H2 O) nucleation (Easter
ical stratosphere. The latter can occur both via slow radia-       and Peters, 1994). Low temperatures also decrease volatil-
tive heating or by overshooting convection (Kremser et al.,        ity, thereby increasing the semi-volatile organic species that
2016). The stratospheric aerosol background (in volcanically       can contribute to new particle formation and growth (Trostl
quiescent periods) is highly variable, and it is unclear how       et al., 2016; Stolzenburg et al., 2018; Simon et al., 2020).
much this is affected by anthropogenic influence (Solomon          Secondly, the drier environment of the LMS means that wa-
et al., 2011). Increases in the amount of aerosol in the strato-   ter is less available for NPF and growth than is usually the
sphere have been observed recently, but whether this is due        case in the PBL. Thirdly, total concentrations of aerosol and
to anthropogenic emissions (Hofmann et al., 2009; Randel et        the related sinks for condensable vapours, clusters, and nu-
al., 2010) or minor volcanic eruptions (Vernier et al., 2011;      cleation mode particles are generally higher in the PBL, so
Neely III et al., 2013; Brühl et al., 2015; Mills et al., 2016)    PBL NPF is mostly observed where concentrations of precur-
remains unclear. Recent studies have shown pollution from          sor vapours are high or under specific local conditions where
the Asian summer monsoon affecting stratospheric aerosol           condensation sinks are lower (Kerminen et al., 2018). In con-
(Yu et al., 2017; Lelieveld et al., 2018). These studies have      trast, it may be possible for lower concentrations of condens-
focused on gas-phase species and particles without details         able vapours to cause NPF in the LMS because of these low
of the nucleation mode. Pyro-convection is another possi-          sinks. These low sinks in the LMS mean that we are essen-
ble source of particles in the LMS (Fromm and Servranckx,          tially observing processes like NPF and growth in the LMS in
2003; Damoah et al., 2006; Ditas et al., 2018; Yu et al.,          slow motion when compared to the PBL. Low sinks and low
2019), as is dust (Murphy et al., 2014). Two distinct aerosol      concentrations of more standard precursor gases mean that
accumulation modes (particles with diameters between 60            unconventional nucleation mechanisms may become impor-
and 1000 nm) have recently been identified in the LMS: one         tant in the LMS. It has been postulated that gas-phase mer-
originating at higher altitudes in the stratosphere and one        cury could cause NPF under the right conditions, and one
entrained from the upper troposphere (UT) (Murphy et al.,          such possible event has been observed in the marine bound-
2020).                                                             ary layer near Antarctica (Humphries et al., 2015). Mercury-
   Under a range of conditions, aerosols can form in situ from     containing aerosols have been observed in the LMS (Murphy
the gas phase, in a process known as new particle formation.       et al., 2006). Iodine oxidation has been linked to atmospheric
New particle formation (NPF) has been well documented in           NPF in coastal regions (McFiggans et al., 2010; O’Dowd et
a variety of locations in the planetary boundary layer and free    al., 1999, 2002; Sipila et al., 2016) and over the arctic ice
troposphere (Clarke et al., 1998, 2013; Kulmala et al., 2013;      pack (Baccarini et al., 2020). Iodine and bromine have both
Williamson et al., 2019). NPF in the TTL has been observed         been observed in the UT (Volkamer et al., 2015; Dix et al.,
(Brock et al., 1995), as has wintertime NPF in the polar mid-      2013) and stratosphere (Koenig et al., 2020). Lastly, ozone
dle stratosphere (Campbell and Deshler, 2014; Wilson et al.,       levels are, apart from for some specific highly polluted areas
1992). Aircraft and, more recently, rocket emissions are pos-      in the PBL, higher in the LMS. This may well lead to differ-
sible sources of nucleation mode particles or precursor gases      ent oxidation mechanisms than we typically consider in the
in the stratosphere (Lee et al., 2010; Schröder et al., 2000;      troposphere.
Brock et al., 2000).                                                  It is imperative that we understand factors that regulate
   Atmospheric NPF is known to often involve sulfuric acid         aerosol number in the lower stratosphere because this affects
(H2 SO4 ) and water (Kuang et al., 2008; Kulmala et al.,           how condensed material in the stratosphere is apportioned
2013), highly oxidized organic molecules (Bianchi et al.,          to size, thus influencing heterogeneous chemistry, light scat-
2019; Gordon et al., 2017; Riccobono et al., 2014; Stolzen-        tering, absorption, and sedimentation (Wilson et al., 2008).
burg et al., 2018), and ions (Duplissy et al., 2016; Kirkby        Nucleation mode particles (3–12 nm in diameter) have the
et al., 2011, 2016), where they are present. Ammonia and           potential to influence all of these properties in the LMS.
amines have been shown to contribute to NPF in the plane-          Climate intervention schemes that propose the injection of

Atmos. Chem. Phys., 21, 9065–9088, 2021                                             https://doi.org/10.5194/acp-21-9065-2021
C. J. Williamson et al.: Hemispheric difference in stratospheric aerosol number 9067
aerosols, or their precursor gases into the stratosphere, could grometer (Diskin and Digangi, 2019; Diskin et al., 2002),
be affected by the presence of nucleation mode aerosol, and global positioning and meteorological data were mea-
which can remove gases and particles through condensation sured by the meteorological measurement system (Scott et
and coagulation. al., 1990; Gaines et al., 1992; Chan et al., 1989). Trace gases
Here we examine in situ observations of nucleation mode were sampled using the whole-air-sampler (WAS) system
particles, as well as relevant gas-phase tracers and condens- (Colman et al., 2001) and then analysed in the laboratory us-
able species in the lowermost stratosphere in both hemi- ing multi-column gas chromatography utilizing flame ioniza-
spheres, to understand the prevalence, potential causes, and tion detectors (FIDs), electron capture detectors, and a mass
importance of NPF in the LMS. Hemispheric differences selective detector (MSD). The CH3 Cl is detected on the MSD
in observed aerosol and cloud properties are a tool for un- and one of the FIDs while ethane is detected on another FID.
derstanding anthropogenic effects, since we can contrast Measured aerosol size distributions are used to calculate
the more anthropogenically influenced Northern Hemisphere condensation and coagulation rates. The coagulation kernel
(NH) with the less anthropogenically influenced Southern between two particles as a function of their diameters is cal-
Hemisphere (SH). This technique has been previously used culated using the Fuchs expression for the coagulation rate
to constrain aerosol radiative forcing using observations of coefficient (Seinfeld and Pandis, 2006) at ambient pressure
cloud droplet number (McCoy et al., 2020). We use box mod- and temperature. We assume each particle to have the den-
elling, back trajectories, thermodynamic calculations, and sity of water (1000 kg m−3 ). The condensation is calculated
emissions estimates to understand how NPF can occur in the in the same way, substituting a molecule of sulfuric acid for
LMS, factors influencing the amount of NPF, and other po- one of the particles. The diameter of a sulfuric acid molecule
tential sources of nucleation mode aerosol in this region. is calculated from bulk properties following the method from
Lovejoy et al. (2004), neglecting temperature effects on the
probability distribution function of monomers, dimers, and
2 Methods trimers. We sum the coagulation and condensation rate from
all particles in the size distribution at each measurement time.
We recently conducted global-scale in situ aerosol obser- Condensation and coagulation rates will be used in this anal-
vations on the NASA Atmospheric Tomography Mission ysis to relate our observations to theory and models and to
(ATom) (Wofsy et al., 2018). This mission consisted of four estimate particle lifetimes.
sets of near pole-to-pole flights on the NASA DC-8 over the While ATom flights were not designed for stratospheric
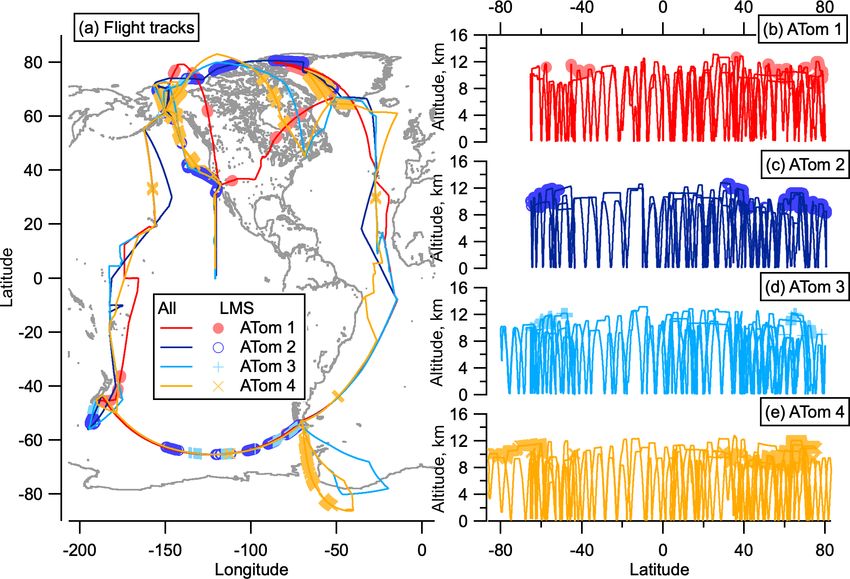
remote Pacific and Atlantic oceans. Flight paths continuously sampling, measurements were made of the LMS at mid–high
scanned from ∼ 0.2 to ∼ 12 km altitude to measure the verti- latitudes in both hemispheres on all deployments. Measure-
cal structure of the atmosphere, and these paths were covered ments were limited to altitudes below 13 km, so stratospheric
once in each of the four seasons to capture seasonal variabil- air sampled was associated with a low tropopause and some-
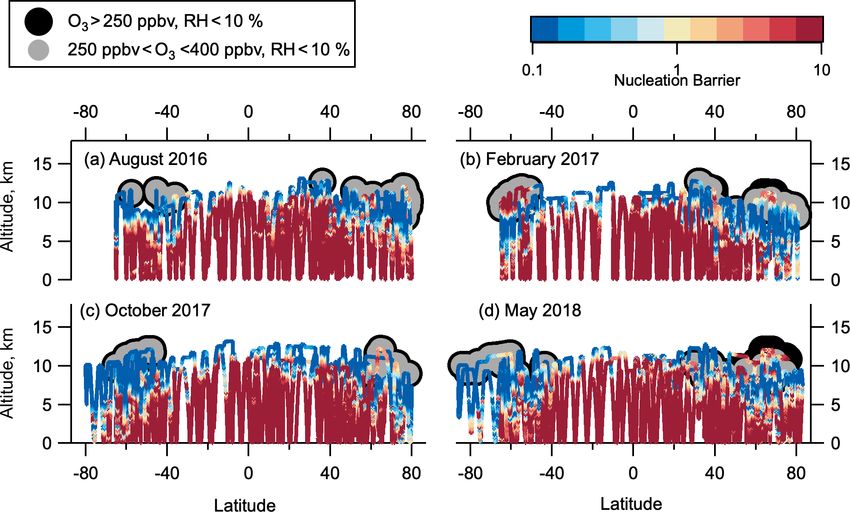
ity. times tropopause folds. For this reason, we choose to define
We measured aerosol size distributions from 3 nm to the stratosphere here as ozone > 250 parts per billion by vol-
4.5 µm using instruments inside the cabin of the DC-8 using ume (ppbv), altitude > 8 km so as to be definitively above
nucleation mode aerosol size spectrometers (NMASS), mod- the tropopause, and relative humidity < 10 % with respect
ified ultra-high-sensitivity aerosol spectrometers (UHSASs), to supersaturated water. For interhemispheric comparisons
and a laser aerosol spectrometer (LAS, TSI Inc., St. Paul, we mainly choose to examine stratospheric air with ozone
MN, USA) (Williamson et al., 2018; Kupc et al., 2018; Brock < 400 ppbv. Most of the Southern Hemisphere (SH) flights
et al., 2019). A second-generation Cloud, Aerosol and Pre- did not reach ozone > 400 ppbv, whereas higher ozone mix-
cipitation Spectrometer (CAPS; Droplet Measurement Tech- ing ratios were sampled in the NH. Therefore, the ozone
nologies), mounted under the aircraft’s wing, extended the range from 250–400 ppbv was chosen to ensure consistent
measured size range of aerosol and cloud size distributions comparison between hemispheres. This stratospheric defini-
covering the range between approximately 0.5 and 930 µm. tion is consistent with that used by Murphy et al. (2020),
(Spanu et al., 2020). Size-resolved single-particle compo- which we will reference in this analysis. Figure 1 shows the
sition measurements were made using the particle analysis flight paths of the ATom deployments, highlighting where the
by laser mass spectrometry instrument installed inside the LMS was sampled.
cabin (Froyd et al., 2019). SO2 observations with a detec- Size distributions can be used to identify particles that
tion limit of 1 part per trillion by volume (pptv; nmol mol−1 ) have recently formed via NPF. Stable particles form at
were made on the fourth set of flights (May 2018) using around 1.7 nm diameter from the growth of molecular clus-
laser-induced fluorescence techniques (Rollins et al., 2017). ters. Lifetimes of these newly formed particles are relatively
Stratospheric air is identified using in situ measurements short, on the order of a few days (Sect. S1), so their pres-
of ozone and relative humidity. Ozone was measured using ence indicates recent NPF. The size distribution at the small-
nitric-oxide-induced chemiluminescence (Bourgeois et al., est sizes is measured by a battery of 5 (for ATom 1) or 10
2020), water vapour was measured by the diode laser hy- (for ATom 2–4) condensation particle counters within the
https://doi.org/10.5194/acp-21-9065-2021 Atmos. Chem. Phys., 21, 9065–9088, 2021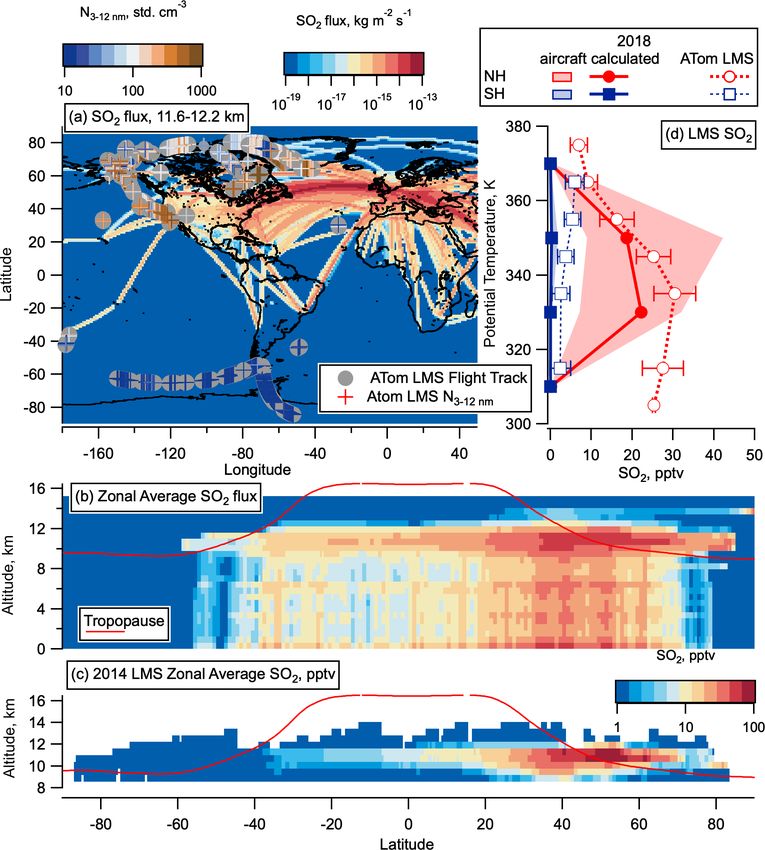
9068                                           C. J. Williamson et al.: Hemispheric difference in stratospheric aerosol number

Figure 1. ATom flight locations. Flight tracks from ATom in all four seasons as a function of latitude and longitude (a) and altitude and lati-
tude (b–e). Sampling in the LMS (O3 > 250 ppbv and relative humidity over water (RHw ) < 10 %) is highlighted in light-coloured symbols.
The world map was made with Natural Earth free vector and raster map data, http://www.naturalearthdata.com (last access: 10 December
2015).

NMASS instruments that each measure the total number con-                 has a characteristic SVP value (Froyd and Lovejoy, 2012).
centration of particles larger than a specified size. These con-          SVP is a strong function of temperature and also depends
centrations are differenced to give the total number of parti-            on relative humidity (RH). SVPmax is the maximum SVP
cles in 5–10 size bins from between 3 and 60 nm (Williamson               value that growing clusters experience for a given RH. Using
et al., 2018). Recent NPF is diagnosed when number con-                   cluster thermodynamics that form the basis for the Model of
centrations in the smallest measured size bin are larger than             Aerosols and Ions in the Atmosphere (MAIA) model (Love-
those in the next-smallest size bin by 3 times more than can              joy et al., 2004; Kazil and Lovejoy, 2007; Kazil et al., 2007),
be expected by uncertainty due to flow variation and count-               we define the barrier to nucleation for the negative ion sys-
ing statistics (Williamson et al., 2019). In this analysis we             tem as the ratio of SVPmax to the typical daytime maximum
divide the aerosol size distribution into four modes: nucle-              H2 SO4 concentration. When the ratio of SVPmax to the par-
ation mode from 3–12 nm, Aitken mode from 12–60 nm, ac-                   tial pressure of H2 SO4 (p(H2 SO4 )) is > 1, it is more ener-
cumulation mode from 60–1000 nm, and coarse mode above                    getically favourable for a cluster to evaporate H2 SO4 than for
1000 nm. We note that the 12 nm cut-off between nucle-                    molecules to condense onto that cluster. At ratios > 10, NPF
ation and Aitken modes is defined at a smaller diameter                   is highly improbable. When SVPmax / p(H2 SO4 ) < 1, clus-
than is often used for aerosol studies in the lower tropo-                ter growth is more energetically favourable than evaporation,
sphere and make this choice to allow for more direct com-                 and nucleation proceeds with no thermodynamic barrier.
parison with previous datasets over the remote Pacific and                   To more quantitatively assess the effects of thermodynam-
Atlantic oceans (Clarke and Kapustin, 2002, 2010; Clarke et               ics on NPF in the LMS, box modelling is performed using
al., 1998, 1999, 2013) and for consistency with the ATom                  MAIA. MAIA describes the oxidation of SO2 to gaseous
data archive (Wofsy et al., 2018) and other published works               H2 SO4 , the nucleation of neutral and negative H2 SO4 –
analysing ATom size distributions (Brock et al., 2019; Kupc               H2 O clusters, aerosol growth by sulfuric acid condensa-
et al., 2020; Williamson et al., 2019).                                   tion / evaporation, and particle coagulation. The production
   Using a simple thermodynamic analysis, we assess                       rate of H2 SO4 is calculated assuming that the reaction of
whether LMS conditions prohibit or allow NPF via nucle-                   SO2 + OH is the rate-limiting step of the oxidation of SO2 to
ation of the negative ion binary H2 SO4 –H2 O system. Bulk                form H2 SO4 (Lovejoy et al., 1996). Nucleation is described
solutions have a characteristic H2 SO4 saturation vapour pres-            with laboratory thermochemical data for H2 SO4 and H2 O
sure (SVP), which describes the thermodynamic driving                     uptake and loss by small neutral and negative clusters (Cur-
force for condensation or evaporation of H2 SO4 . Similarly,              tius et al., 2001; Lovejoy and Curtius, 2001; Froyd and Love-
each molecular cluster in the binary H2 SO4 /H2 O system                  joy, 2003; Hanson and Lovejoy, 2006). The thermochemical

Atmos. Chem. Phys., 21, 9065–9088, 2021                                                      https://doi.org/10.5194/acp-21-9065-2021
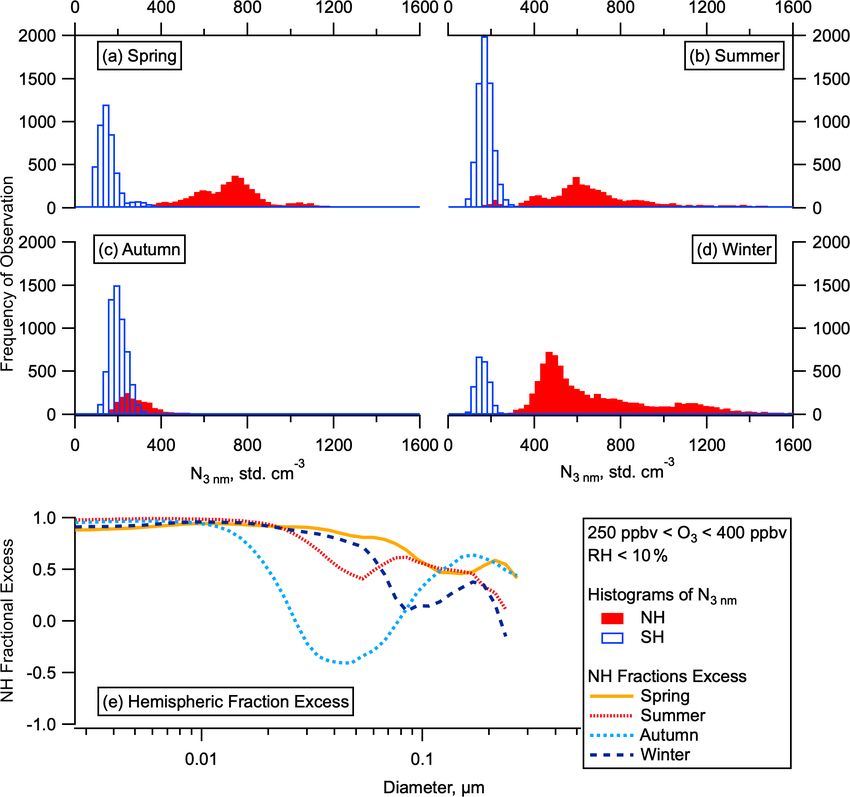
C. J. Williamson et al.: Hemispheric difference in stratospheric aerosol number                                                   9069

Figure 2. Hemispheric differences in particle number and concentrations. Histograms of the total number of aerosol between 3 and 4500 nm
in the LMS (ozone 250–400 ppbv, altitude > 8 km) for the SH and NH for all for ATom deployments (a–d) by season. Fractional excess of
mean particle number in the NH compared to the SH ((NNH -NSH ) / NNH ) in each season as a function of particle diameter (e).

data for uptake and loss of H2 SO4 and H2 O by large sul-             lated from the day of year and location. Atmospheric ion-
furic acid aerosol ( 5 sulfuric acid molecules) are based            ization rates due to galactic cosmic rays are calculated as
on the liquid drop model and H2 SO4 and H2 O vapour pres-             a function of latitude, altitude, and solar cycle phase by
sures over bulk solutions. These were calculated with a com-          a model of energetic particle transport in the Earth’s at-
puter code (provided by S. L. Clegg, personal communica-              mosphere (O’Brien, 2005). The transformation between ge-
tion, 2007) which adopts experimental data from Giauque               ographic and geomagnetic coordinates is calculated with
et al. (1960) and Clegg et al. (1994). The thermochemical             GEOPACK (http://geo.phys.spbu.ru/~tsyganenko/modeling.
data for intermediate-sized particles are a smooth interpo-           html, last access: 7 August 2018) and the International Geo-
lation of the data for small and large aerosol particles. The         magnetic Reference Field 12 coefficients (https://www.ngdc.
model uses 20 linear bins in which H2 SO4 content increases           noaa.gov/IAGA/vmod/igrf.html, last access: 7 August 2018).
by 1 molecule per bin and 50 geometric bins in which H2 SO4              Aerosol nucleation rates calculated from the experimental
content increases by a factor of 1.45 per bin, covering a             thermochemical data of neutral and charged H2 SO4 / H2 O
dry (312.15 K, 10 % RH) particle diameter range of ∼ 0.5–             cluster formation that are used in MAIA (Kazil and Lovejoy,
800 nm.                                                               2007) compare well with neutral and charged H2 SO4 / H2 O
   MAIA operates along trajectories with changing pres-               nucleation rates measured in the European Organization
sure, temperature, and relative humidity (Kazil and Love-             for Nuclear Research (CERN) Cosmics Leaving Outdoor
joy, 2007) in the temperature range 180–320 K and the rel-            Droplets (CLOUD) chamber (Kirkby et al., 2011). Global
ative humidity range 1 %–101 %, which includes upper tro-             model simulations, using either a parameterization of neutral
posphere conditions. MAIA parameterizes the OH diurnal                and charged H2 SO4 / H2 O nucleation based on the CERN
cycle as a half sine centred around noon with a prescribed            CLOUD chamber measurements or nucleation rates calcu-
noon OH concentration, while setting the nighttime OH con-            lated from the experimental thermochemical data used in
centration to 0. The length of the daytime period is calcu-           MAIA (Kazil et al., 2010), show a good agreement in the

https://doi.org/10.5194/acp-21-9065-2021                                                Atmos. Chem. Phys., 21, 9065–9088, 2021
9070 C. J. Williamson et al.: Hemispheric difference in stratospheric aerosol number
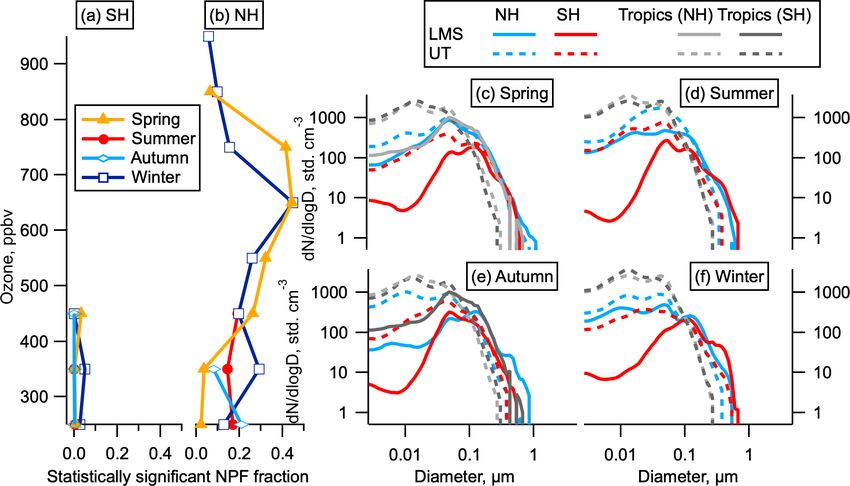
Figure 3. Statistically significant NPF and size distributions by hemisphere. (a, b) The fraction of data indicating statistically significant NPF
as a function of ozone for each hemisphere and season. Data are limited to altitudes above 8 km. (c–f) Average size distributions in the LMS
and UT in the NH (latitudes above 30◦ ), SH (latitudes below −30◦ ), and tropics (−30 to 30◦ ) by season. The LMS was not sampled in the
tropics except in May. Tropics are shown both for the month corresponding to the NH season (dark grey) and the SH season (light grey); e.g.
in spring the tropical May observations are shown in light grey and the tropical October observations are shown in dark grey.
global mean profile of total (> 3 nm) aerosol concentration number concentrations in the smallest observable size range
(Määttänen et al., 2018). shows statistically significant numbers of 3–7 nm particles
MAIA is run along back trajectories, initiated at the air- relative to larger particles (see Sect. 2) (Williamson et al.,
craft location, which were calculated using the Traj3D tra- 2019). This is the case for substantial portions of the LMS in
jectory model (Bowman, 1993) and the National Center for all four seasons (Fig. 3a, b) in the NH but only for very small
Environmental Prediction (NCEP) global forecast system portions of the data in the SH. These 3–7 nm particles have
(GFS) meteorology (2015). NCEP provides temperature, rel- lifetimes in the NH LMS of just a few days (see Sect. S2).
ative humidity, and pressure along the trajectories for the Particle number concentrations in the NH are between 4 and
MAIA runs. The initial SO2 concentration and the H2 SO4 100 times the SH concentrations in the LMS and between 2
condensation sink of the initial aerosol size distribution were and 9 times the SH concentrations in the UT, and the number
estimated from ATom observations at similar latitudes and concentration of nucleation mode particles is a larger frac-
altitudes. The geometric mean diameter (46 nm) and geo- tion of the total aerosol number in the NH LMS than in the
metric standard deviation (2.8) of the initial aerosol size dis- UT (Fig. 3c–f).
tribution were obtained by fitting a lognormal mode to the The majority of the aerosol surface area in the NH LMS
size distribution observed at the ATom measurement loca- is in the accumulation mode (60–1000 nm). While nucle-
tions. The noon concentration of OH in the simulations was ation mode particles do not contribute substantially to the
set to 3 × 10⁶ molec. cm−3 . This estimate agrees well with total aerosol surface area in the NH LMS, the Aitken mode
aircraft-measured OH concentrations during ATom (Kupc et (12–60 nm) can contribute around 10 % of the total in the
al., 2020). NH (Fig. 4). Newly formed particles that grow to these sizes
will influence heterogeneous chemistry in the stratosphere,
with potential implications for ozone depletion (Hofmann
3 More nucleation mode particles and SO2 are and Solomon, 1989). Aitken mode surface area is smaller in
observed in the lowermost stratosphere in the the SH LMS than in the NH LMS.
Northern Hemisphere than in the Southern SO2 oxidation is a primary source of atmospheric H2 SO4
Hemisphere in the gas phase, which readily participates in new particle
formation and growth (Kuang et al., 2008; Kulmala et al.,
Our observations show that the total number of aerosol parti- 2013). Measurements of SO2 mixing ratios with pptv sen-
cles in the NH LMS is higher than in the SH LMS in all sea- sitivity were made on the fourth ATom deployment in May
sons (Fig. 2a–d). The elevated number of stratospheric par- 2018. Mixing ratios of SO2 in the NH LMS were several
ticles in the NH relative to the SH persists for all submicron times higher than in the SH (Fig. 5a). Number concentrations
sizes but is largest at the smallest sizes (Fig. 2e). Analysis of of nucleation and Aitken mode particles show some correla-
Atmos. Chem. Phys., 21, 9065–9088, 2021 https://doi.org/10.5194/acp-21-9065-2021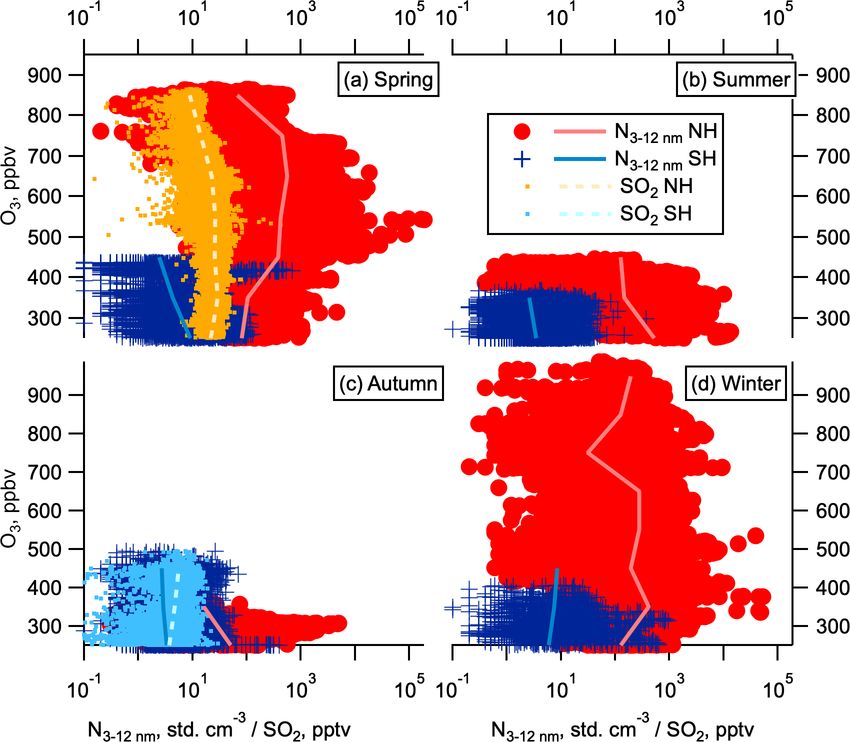
C. J. Williamson et al.: Hemispheric difference in stratospheric aerosol number                                                 9071

Figure 4. Aerosol surface area in the LMS. Aerosol surface area in the LMS as a function of potential temperature, separated by mode
(colours) and season for the NH (a–d) and SH (e–h). Mode size ranges are 3–12 nm (nucleation), 12–60 nm (Aitken), 60–1000 nm (accumu-
lation), and 1000–4500 nm (coarse).

tion with SO2 , whereas number concentrations of accumula-           whether it is energetically favourable for new particle for-
tion and coarse mode particles show little to no correlation         mation via negative-ion-enhanced H2 SO4 –H2 O nucleation
with SO2 (Fig. 6). This observed correlation between SO2             to occur. Box modelling for SO2 concentrations similar to
concentration and nucleation and Aitken mode particle con-           those observed in the NH LMS (20–40 pptv) shows this
centrations suggests that the enhanced SO2 in the NH LMS             H2 SO4 concentration is reasonable for the NH LMS but is
is likely to be a precursor vapour for this NPF. We hypothe-         likely too high for the SH LMS (Fig. 7). Figure 8 shows
size that nucleation is occurring in the LMS, and the amount         SVPmax / p(H2 SO4 ) values calculated at the RHw (relative
of condensable vapour available is one of the factors con-           humidity with respect to supersaturated water) and tempera-
trolling the number of nucleation and Aitken mode particles          ture conditions sampled by the aircraft for a fixed p(H2 SO4 )
produced.                                                            level of 0.1 pptv, or approximately 106 molec. cm−3 in the
                                                                     LMS (300 hPa, 220 K). The highest altitudes sampled dur-
                                                                     ing ATom favoured nucleation of the negative ion-mediated
4   Observations and models suggest NPF occurs in the                binary system, including many of the LMS segments (little
    NH LMS                                                           to no thermodynamic barrier to nucleation under these con-
                                                                     ditions). Neutral binary nucleation is always less favourable
We now turn our attention to the possibility of in situ NPF          than the negative ion system, so calculated barriers for the
within the LMS. Concentrations of nucleation mode particles          negative ion system also denote barriers to the neutral sys-
in the NH LMS are sometimes correlated with elevated SO2             tem. This therefore indicates that NPF from sulfuric-acid–
in the NH LMS (Fig. 6), which is consistent with our under-          water is possible in the NH LMS.
standing of SO2 as a precursor for NPF. While it is possible            Where LMS RHw was below about 1 %–2 %, as in the NH
that nucleation in the NH LMS involves gas-phase species             in October 2017 and SH in February 2017 (Fig. S1), large
beyond sulfuric acid and water, the thermodynamics of bi-            thermodynamic barriers prohibited nucleation. Fewer nucle-
nary nucleation in the sulfuric-acid–water system is still rel-      ation mode particles were observed in the NH LMS in Octo-
evant. If it is possible to nucleate aerosol from just sulfuric      ber than in other seasons (Fig. 2). No correlation is seen in the
acid and water (with or without ions), then the addition of          SH LMS between the occasional higher number concentra-
gas-phase organics or ammonia will only make it easier.              tions of nucleation mode aerosol and SO2 (Fig. 6). This lack
   We have conducted thermodynamic modelling of NPF for              of correlation and the low concentrations of SO2 in the SH
the temperature, pressure, and relative humidity observed            LMS suggest that if nucleation is sporadically occurring, or
in the NH LMS on ATom (see Sect. 2). This modelling                  occurring at low rates, it is more likely to depend on species
indicates, for H2 SO4 concentrations of 106 molec. cm−3 ,            other than H2 SO4 .

https://doi.org/10.5194/acp-21-9065-2021                                              Atmos. Chem. Phys., 21, 9065–9088, 2021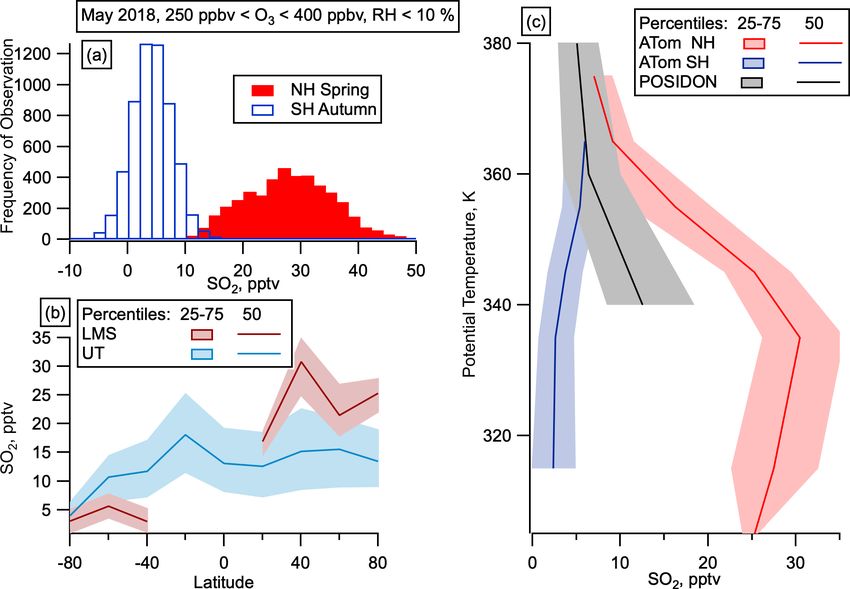
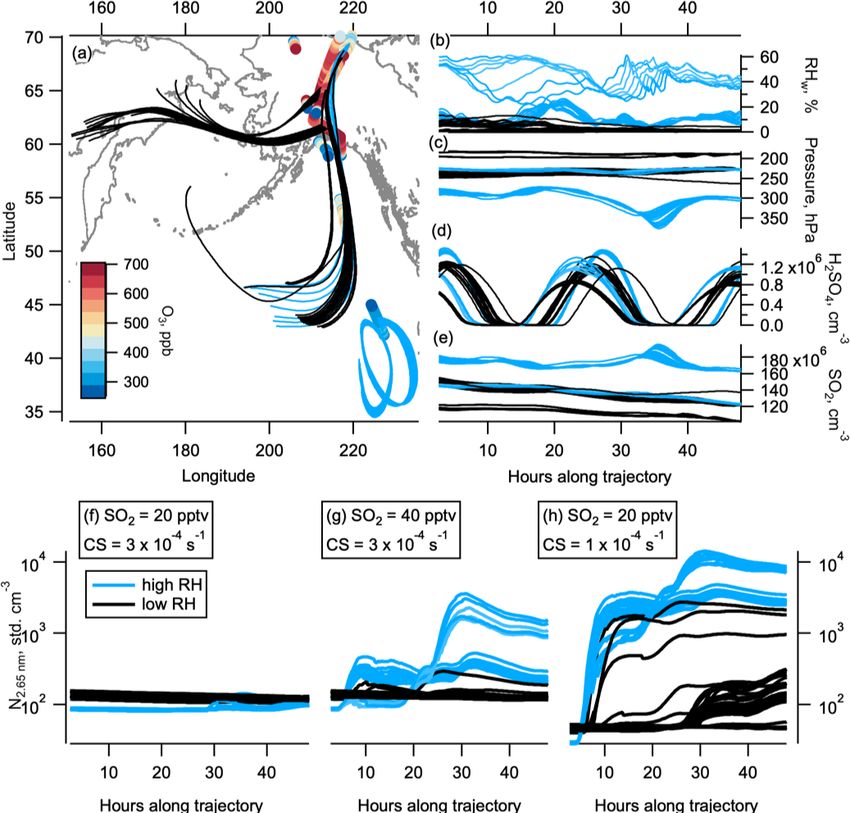
9072                                         C. J. Williamson et al.: Hemispheric difference in stratospheric aerosol number

Figure 5. SO2 in the LMS. (a) Mixing ratios of gas-phase SO2 in the LMS (250 ppbv < O3 < 400 ppbv) in the SH (open blue) and NH (filled
red). (b) Median and interquartile range of SO2 by latitude in May for the LMS (red) and UT (Blue) in May. UT is defined as altitudes over
8 km and O3 < 250 ppbv or RHw > 10 %. SO2 observations at mixing ratios below 100 pptv are only available for the May 2018 deployment.
(c) SO2 mixing ratios as a function of potential temperature from the tropical UT on POSIDON, October 2016, and from the LMS on ATom,
May 2018.

   Back trajectories from observations in the NH LMS in                it is still possible that other condensable species contribute.
May show 35 out of the 55 trajectories we ran spend days               Condensable organic vapours are likely present at mixing ra-
prior to observation in low-relative-humidity stratospheric            tios on the order of pptv in the NH LMS (Murphy et al.,
conditions (Fig. 7a–c). The other 20 trajectories experienced          2020), which could increase rates of particle nucleation in the
more humid air, indicative of UT or tropopause conditions.             LMS (Gordon et al., 2016; Kupc et al., 2020). Previous stud-
The box model MAIA shows that 20 pptv of SO2 (median                   ies have shown the likely role of condensable organics in the
observed SO2 values in the NH LMS in May were between                  growth of newly formed particles in the tropical UT (Kupc et
20 and 30 pptv, Fig. 5) produced H2 SO4 on a diurnal cycle,            al., 2020), and it is conceivable that the low observed concen-
with concentrations peaking between 0.5 and 1.5×106 cm−3               trations of organics in the NH LMS play a similar role. The
(Fig. 7d). The sulfuric acid production consistently causes            case for involvement of condensable vapours beyond H2 SO4
nucleation to occur in the box model. Nucleation produced              must not be overstated, however, as there are a number of un-
noticeable increases in nucleation mode number concentra-              certainties involved in modelling this phenomenon, including
tions when either (i) starting SO2 concentrations were at or           a lack of high-sensitivity SO2 measurements in three of the
above 40 pptv or (ii) starting condensation sinks were at or           seasons.
below 1 × 10⁻⁴ s−1 (Fig. 7f–h). We note that 40 pptv SO2 is               Chamber studies have shown that the rate at which
higher than the median observed values in May in the NH                aerosols nucleate in the presence of sulfuric acid, water,
LMS on ATom (Fig. 5), and observed condensation sinks                  and ammonia mixing ratios >∼ 0.2 pptv increases with the
were mostly above 1 × 10⁻⁴ s−1 in this region (Fig. S2). In            amount of ammonia at temperatures relevant to the LMS
other seasons, the lower condensation sinks are closer to the          (208–223 K). At higher temperatures (248 K) this was also
modelled 1×10⁻⁴ s−1 where binary nucleation produced no-               shown for even lower ammonia mixing ratios (Kürten et
ticeable concentrations of nucleation mode particles; how-             al., 2016). Single-particle composition measurements of par-
ever, we lack sensitive observations of SO2 in these sea-              ticles with diameters between 350 and 600 nm show only
sons. SO2 concentrations in the model typically decrease by            slight neutralization of sulfate in the NH LMS, suggest-
∼ 20 % over 24 h in these model runs, bringing mixing ratios           ing gas-phase mixing ratios of ammonia < 1 pptv (Fig. S3).
fairly close to the observed concentrations within a few days.         Larger concentrations of ammonia have been observed in the
   The results from MAIA suggest that binary nucleation                UT (Höpfner et al., 2016) but so far only in outflow from
alone may be able to explain NPF in the NH LMS, although               the Asian summer monsoon (ASM), which we did not de-

Atmos. Chem. Phys., 21, 9065–9088, 2021                                                   https://doi.org/10.5194/acp-21-9065-2021
C. J. Williamson et al.: Hemispheric difference in stratospheric aerosol number                                                         9073

Figure 6. Aerosol correlations with SO2 . Number concentration dependence on SO2 at 0.1 Hz time resolution to reduce the effect of at-
mospheric and instrumental noise following Williamson et al. (2019). Number concentration as a function of SO2 mixing ratios in May
(high-resolution SO2 data were not available in other seasons) for the Northern Hemisphere and Southern Hemisphere (red circles and
blue dots respectively). Data are divided into four modes by size: (a) nucleation (3–12 nm), (b) Aitken (12–60 nm), (c) accumulation (60–
1000 nm), and (d) coarse (1000–4500). Log–log fits are given by the solid lines. Panel (e) shows R 2 values for these fits. Observations where
SO2 is below the limit of detection (1 pptv) are not shown.

tect in the ATom observations. Therefore, we cannot exclude              out as a source of the NH LMS nucleation mode particles
that ammonia may play a role in the NH LMS new parti-                    in the arguments given in Sect. 5 below, and we would ex-
cle formation observed on ATom. Even where the SH and                    pect NPF occurring in more troposphere-like air to lead to
NH SO2 concentrations are similar, nucleation mode aerosol               higher concentrations of nucleation mode particles at lower
concentrations tend to be higher in the NH than in the SH                potential temperatures, contrary to the observations shown
(Fig. 6a). This suggests that species other than H2 SO4 may              in Fig. 9, observations of aerosol size distributions, chemical
also be more abundant in the NH LMS than the SH and play                 composition, and gas-phase precursors of NPF further above
a role in nucleation and/or growth of aerosol. Similarly, we             the tropopause are needed to completely rule out the influ-
note that nucleation mechanisms that may be uncommon in                  ence of the UT on NPF in the NH LMS.
the boundary layer, such as those including halogens or mer-                With regard to SH LMS observations of nucleation mode
cury, may be playing a role here but do not have the observa-            aerosol, while the concentrations were consistently lower
tions to test these ideas.                                               than those observed in the NH LMS, concentrations between
   NPF is a highly non-linear process with respect to pre-               125 and 175 std. cm−3 (per cubic centimetre at standard tem-
cursor concentrations. The regions containing LMS air                    perature and pressure, 273 K and 1013 hPa respectively) were
measured on ATom were heterogeneous mixes of more                        regularly observed in the SH LMS in all seasons (Fig. 2).
stratosphere-like and more troposphere-like air. The in-                 These may also indicate NPF, albeit at a slower rate than in
creased production of nucleation mode particles in the                   the NH. The slower rate is implied not only by the lower
higher-RHw cases in MAIA (Fig. 7f–h) means that we can-                  concentrations, but also by the longer lifetimes of nucleation
not rule out that NPF is preferentially taking place in more             mode particles in the LMS in the SH compared to the NH
troposphere-like air in these regions, followed by trans-                (Supplement Sect. S2), because of the lower concentrations
port/mixing on short timescales. While the bulk UT is ruled              of particles of all sizes observed here. Observations in the SH

https://doi.org/10.5194/acp-21-9065-2021                                                    Atmos. Chem. Phys., 21, 9065–9088, 2021
9074                                          C. J. Williamson et al.: Hemispheric difference in stratospheric aerosol number

Figure 7. Box modelling and back trajectories. The 48 h back trajectories from selected observations in the NH LMS in May. Geographical
location of back trajectories (lines) and observations (circles, coloured by ozone level) are shown in panel (a). Black lines are trajectories
where the relative humidity (RHw ) was mostly below 10 %, indicating stratospheric conditions. Light blue lines are trajectories where the
RHw was often above 10 %, indicating tropospheric conditions. RHw , pressure, sulfuric acid, and SO2 (from initial 20 pptv SO2 ) are shown
in panels (b), (c), (d), and (e) respectively. Modelled number concentration of 2.7 nm particles on the high-RHw (blue) and low-RHw (black)
trajectories are shown for the initial 20 pptv SO2 and starting condensation sink (CS) of 3 × 10⁻⁴ s−1 (f), initial 40 pptv SO2 and starting
condensation sink of 3 × 10⁻⁴ s−1 (g), and initial 20 pptv SO2 and starting condensation sink of 1 × 10⁻⁴ s−1 (h). The world map was made
with Natural Earth free vector and raster map data, http://www.naturalearthdata.com (last access: 10 December 2015).

LMS did not extend to high enough altitudes to enable us to              the stratosphere (Brock et al., 1995) and also to form in
draw conclusions from the vertical structure.                            the tropical UT (Clarke et al., 1998, 2013; Clarke and Ka-
                                                                         pustin, 2002; Williamson et al., 2019) from where they could
                                                                         be transported quasi-horizontally across the tropopause into
5   The observed nucleation mode particles and SO2 are                   the NH LMS. Both of these transport pathways into the NH
    not being transported into the NH LMS but rather                     LMS occur on timescales of weeks to months or longer,
    being either formed in or directly emitted into this                 which is inconsistent with the transport of newly formed par-
    region                                                               ticles, with lifetimes of a few days (Supplement Sect. S2,
                                                                         Figs. S4. S5, S6), from the tropics or NH UT into the NH
The main potential transport routes for particles and SO2 into
                                                                         LMS. Although quasi-isentropic transport on timescales less
the NH LMS are transport from the tropics, either within the
                                                                         than a week has recently been observed in relation to ex-
stratosphere from the tropical lower stratosphere or quasi-
                                                                         tratropical cyclones and small-scale mixing (Kunkel et al.,
horizontally across the tropopause from the tropical UT, ver-
                                                                         2019), these small-scale phenomena are not frequent enough
tical entrainment from the NH UT, downwelling from deeper
                                                                         to produce the consistent elevated number concentrations of
in the stratosphere, and quasi-horizontal transport from the
                                                                         nucleation mode particles we observed in the NH LMS.
polar vortex in winter.
                                                                            Transport from the tropics would lead to increased particle
   New particles have previously been shown to form in the
                                                                         and SO2 concentrations in the LMS in both hemispheres, po-
tropical lower stratosphere and be transported northward in

Atmos. Chem. Phys., 21, 9065–9088, 2021                                                     https://doi.org/10.5194/acp-21-9065-2021
C. J. Williamson et al.: Hemispheric difference in stratospheric aerosol number 9075
Figure 8. Thermodynamic barriers to nucleation. Thermodynamic nucleation barrier calculated of negative ion H2 SO4 –H2 O clusters with
p(H2 SO4 ) = 0.1 pptv for each season of ATom observation. Barrier values ≥ 10 (dark red) are insurmountable, and negative ion H2 SO4 –
H2 O NPF cannot occur. Barrier values ≤ 1 (yellow-blue) mean that nucleation occurs unimpeded by a thermodynamic barrier if sufficient
precursor vapour is present. Barrier between 1 and 10 (yellow-red) means nucleation can occur, but there is some thermodynamic barrier that
needs to be overcome. Regions highlighted in grey have been identified as LMS (250 ppbv < O3 < 400 ppbv, RHw < 10 %).
than the SH LMS, transport from the tropics cannot explain
the observations. ATom observations in the tropics were not
at high enough altitude to reach similar potential tempera-
tures to those observed in the LMS at higher latitudes, but
SO2 observations were taken at these potential temperatures
in the tropics on the NASA POSIDON mission in October
2016 (Rollins et al., 2018). SO2 mixing ratios in the NH
LMS are larger than those measured at similar potential tem-
peratures in the tropical UT (Fig. 5c), which also makes it
unlikely that the increased NH LMS SO2 was transported
quasi-isentropically from the tropics.
Evidence suggests that entrainment from the NH UT at
middle and high latitudes cannot explain the observed con-
centration and spatial distribution of SO2 in the NH LMS.
The distribution of SO2 with potential temperature in the
NH LMS (Fig. 5) shows the largest mixing ratios around
340 K, with lower mixing ratios at lower potential temper-
ature (correlating with lower altitude). This profile strongly
argues against a tropospheric source and instead suggests di-
Figure 9. LMS aerosol and SO2 variation with ozone. Nucleation
rect emission of SO2 within the LMS.
mode aerosol number concentration and SO2 concentration (shown
only in May as this was not measured for other seasons) as a func-
Nucleation mode aerosols have been observed deep
tion of ozone in the LMS in each hemisphere for each season (a–d). into the LMS (O3 > 800 ppbv) and not just close to the
tropopause (Fig. 3). Because the lifetime of these particles
is on the order of days, the enhanced abundance of these par-
tentially with some enhancement in the summer hemisphere ticles distant from the tropopause suggests that they have ei-
due to the location of the ITCZ (Vellinga and Wood, 2002; ther formed in the LMS or been directly emitted in the LMS,
Chiang and Bitz, 2005; Broccoli et al., 2006). Since we only rather than having been transported from the UT. In addition,
observed large numbers of nucleation mode particles in the the vertical profiles of nucleation mode particles and SO2 in
LMS in the NH in all seasons, and SO2 observations in NH the NH LMS are very different to the vertical profile of ac-
spring also showed much higher concentrations in the NH cumulation mode particles of tropospheric origin (Murphy et
https://doi.org/10.5194/acp-21-9065-2021 Atmos. Chem. Phys., 21, 9065–9088, 20219076 C. J. Williamson et al.: Hemispheric difference in stratospheric aerosol number Figure 10. Vertical Profiles of nucleation mode particles and tropospheric tracers in the NH LMS. The 50th percentiles of number concentra- tions of nucleation mode (3–12 nm) and accumulation mode (60–1000 nm) particles, mass concentration of particles from biomass burning (MBB ), and concentrations of ethane and chloroform (CHCl3 ), as a function of potential temperature in the NH LMS. The 50th percentile of the measured SO2 concentration is given in spring only, as these measurements were not taken in other seasons. al., 2020) and other tracers of UT mixing, such as ethane and NH LMS, and should occur in both hemispheres, which is in- chloroform (both have tropospheric sources and lifetimes on consistent with the observed hemispheric difference in LMS the order of weeks to months (Parrish et al., 1992; Khalil et nucleation mode aerosol concentrations (Figs. 2, 3). al., 1983), and particles from biomass burning (Fig. 10). This supports the argument that the nucleation mode particles and SO2 in the NH LMS are not a result of vertical transport from 6 Aircraft are the most likely source of nucleation the midlatitude UT or horizontal transport from the tropics. mode particles in the NH LMS, either by direct The vertical distributions of newly formed particles and emission of particles or emission of precursor SO2 are also evidence against downwards transport of SO2 vapours for NPF from carbonyl sulfide (OCS) oxidation deeper in the strato- sphere (Crutzen, 1976; Chin and Davis, 1995; Sheng et al., Air traffic is largely concentrated in the NH (Lee et al., 2010), 2015; Brühl et al., 2012; Rollins et al., 2017). O3 concen- and most emissions occur at ∼ 10 km altitude (Schröder et trations increase in the stratosphere with distance from the al., 2000). It has previously been observed that nucleation tropopause; therefore, O3 is an effective tracer of depth of and Aitken mode particles are directly produced from air- stratospheric air. If SO2 and the resulting nucleation mode craft (Brock et al., 2000; Kinsey et al., 2010), either as par- particles were originating from OCS oxidation deep in the ticles or forming from the gas phase immediately upon exit- stratosphere, we would expect them to be correlated with O3 . ing the engine. Aircraft also directly emit SO2 into the at- We do not observe SO2 increasing with O3 in the NH LMS mosphere. Here we examine aircraft as a potential source (Fig. 9a) and therefore conclude that the NH excess SO2 is of the observed elevated concentrations of nucleation mode not from OCS oxidation. SO2 does increase with O3 in the aerosol, both through direct emissions and through NPF re- SH LMS (Fig. 9c), suggesting OCS oxidation may be con- sulting from SO2 oxidation. tributing to these lower, background levels of SO2 . We use the Community Emissions Data System (CEDS) NPF can take place in descending air in the polar vortex in 2014 emissions database (Hoesly et al., 2018) to look at winter, and quasi-horizontal transport is a potential pathway the global distribution and amount of SO2 emitted by air- for these particles to then enter the LMS. However, similar to craft in 2014 (Fig. 11). CEDS calculates aircraft emissions SO2 , we do not observe nucleation mode particle concentra- based on Lee et al. (2010) and Lamarque et al. (2010), which tions increasing with O3 (Fig. 9), suggesting they do not orig- use SO2 emission indices between 0.6 and 1 g kg−1 fuel inate deeper in the stratosphere. Furthermore, this pathway burned, with an average of 0.6 g kg−1 . Global aircraft move- occurs only in winter, which does not explain the observed ments are taken from the AERO2K database (Eyers et al., seasonal persistence of high nucleation mode aerosol in the 2004), with altitudes parameterized from statistical analysis Atmos. Chem. Phys., 21, 9065–9088, 2021 https://doi.org/10.5194/acp-21-9065-2021
C. J. Williamson et al.: Hemispheric difference in stratospheric aerosol number                                                       9077

Figure 11. CEDS 2014 aircraft emissions SO2 flux and calculated LMS concentrations. (a) SO2 flux from aircraft from CEDS emissions
database for May 2014, between 11.6 and 12.2 km altitude on a log-colour scale as a function of latitude and longitude, with ATom flight
tracks from all seasons overlaid with LMS nucleation mode number concentration measurements coloured on a log scale for comparison.
(b) SO2 flux (in kg m−2 s−1 ) from aircraft from the CEDS emissions database zonally average for the whole year of 2014 as a function of al-
titude and latitude with the tropopause height from MERRA2 2014 in red. (c) Calculated, zonally averaged average 2014 SO2 concentrations
plotted on a logarithmic colour scale for altitudes > 8.5 km from these aircraft emissions, assuming a 1-month lifetime of SO2 in the LMS,
as a function of latitude and altitude with the tropopause height from MERRA2 2014 in red. (d) Median SO2 calculated as for (c) but scaled
by a factor 1.23 to take into account increases in air traffic between 2014 and 2018 (Lee et al., 2020). MERRA2 data are used to convert
CEDS emissions onto a potential temperature scale, and average profiles above 20◦ latitude are compared with the median ATom LMS SO2
observations in each hemisphere from May 2018. The 25–27th percentiles are given in shaded areas of the CEDS emissions, as well as error
bars for ATom observations. The world map was made with Natural Earth free vector and raster map data, http://www.naturalearthdata.com
(last access: 10 December 2015).

of air traffic data. Fuel consumption was calculated using the          been measured as ∼ 1016 –1017 particles per kilogram of air-
PIANO aircraft performance model and then scaled up to                  craft fuel for low-sulfur fuel (fuel sulfur content = 2.6 ppmm
the International Energy Agency statistics of kerosene sales            (parts per million mass)) (Brock et al., 2000). We calculate
data to account for documented underestimates. We take the              that 19 % of all aircraft SO2 emissions occurred in the NH
tropopause height from MERRA2 reanalysis temperatures in                between the tropopause and 13 km (this upper level is cho-
2014.                                                                   sen to align with the maximum altitude of the ATom flights
   Emission indices of particles with diameters between 3               in order to relate the emissions directly to the observed re-
and 10 nm (equivalent to our measured nucleation mode, 3–               gions) and 0.05 % in the SH for the same region (Fig. 8), and
12 nm) in aircraft exhaust while cruising at 10.7 km have               we assume that particle emissions have a very similar spatial

https://doi.org/10.5194/acp-21-9065-2021                                                   Atmos. Chem. Phys., 21, 9065–9088, 2021
9078                                          C. J. Williamson et al.: Hemispheric difference in stratospheric aerosol number

                                                                          The observed median nucleation mode aerosol concen-
                                                                       trations in the NH LMS on ATom were between 50 and
                                                                       600 std. cm−3 (Fig. 9), a similar order of magnitude to con-
                                                                       centrations of nucleation mode particles calculated from air-
                                                                       craft emissions. Median observed nucleation mode parti-
                                                                       cle concentrations in the SH LMS were between 2 and
                                                                       10 std. cm−3 (Fig. 9). Since observed concentrations in the
                                                                       SH LMS are larger than concentrations calculated from air-
                                                                       craft emissions, this could imply a small additional source of
                                                                       nucleation mode aerosol, although a substantial uncertainty
                                                                       exists from the more varied lifetime in the SH between plume
                                                                       and non-plume conditions. Direct aircraft emissions are of a
Figure 12. Volcanic eruptions within 2 months of ATom ob-              similar order of magnitude to the NH LMS enhancement ob-
servations near the LMS. Volcanic eruptions plotted by latitude        served on ATom. While within the large uncertainties of this
and plume altitude for 2 months prior to each ATom deployment          comparison, the nucleation mode concentrations calculated
where the plume altitude is above 7 km. Eruptions are shown with       from aircraft emissions are lower than the observed concen-
colours/symbols corresponding to the relevant ATom deployment.         trations. This therefore does not discount the possibility of
Tropopause height as a function of latitude from 2014 MERRA2
                                                                       NPF occurring outside of aircraft plumes in the NH LMS as
data is shown in red, with the area between the tropopause and
13 km highlighted in grey. Details of these eruptions can be found
                                                                       a result of elevated SO2 concentrations.
in Table S1. Volcano data are from the Multi-Satellite Volcanic Sul-      Figure 11a compares the spatial distribution of aircraft
fur Dioxide L4 Long-Term Global Database V4 (MSVOLSO2L4)               SO2 emissions in the NH LMS with the spatial distribu-
(Carn, 2021).                                                          tion of nucleation mode number concentrations measured
                                                                       in the same region on ATom emissions. No obvious corre-
                                                                       lation between nucleation mode number concentrations and
                                                                       flight corridors is evident, with some of the highest nucle-
distribution to SO2 emissions. Global aircraft fuel usage rate         ation mode number concentrations observed in the LMS
in 2018 was 327 Tg yr−1 (Lee et al., 2020), which, assum-              around 1000 km away from flight corridors. Median zonal
ing the same spatial distribution in 2018 as in 2014, gives the        wind speeds encountered in the LMS on ATom were be-
maximum total number of nucleation mode particles emit-                tween 10 and 30 m s−1 , with the 75th percentile of these
ted from aircraft in the NH and SH LMS of 626 × 1025 and               wind speed between ∼ 20 and 35 m s−1 (Fig. S7); therefore
1.74 × 1025 respectively.                                              1000 km is around half a day’s transport from the flight cor-
   While particle lifetimes in non-plume LMS conditions are            ridor. Based on these measured wind speeds, zonal mixing
expected to be longer in the SH than the NH, nucleation                is expected on timescales of around 1 month, which is ap-
mode particle lifetimes within aircraft plumes have been               proximately equal to the lifetime of SO2 . However, since the
shown to be around 2 d (Schröder et al., 2000). The plume              jet core with peak wind speeds of 40–60 m s−1 is typically
and non-plume lifetimes in the NH LMS are similar enough               located on the tropopause in the 30–50◦ N region (Manney
to justify the use of a 2 d lifetime in this region (Supplement        et al., 2014), and the peak in SO2 is also located in this re-
Sect. S2). In the SH LMS, there is a large difference between          gion, the zonal mixing time could be as little as 1 to 2 weeks.
in-plume and non-plume lifetimes (from days to months). We             For this reason, we present zonally averaged SO2 concentra-
use a 2 d lifetime here in the SH for illustrative purposes,           tions in Fig. 11b and c. Even with this fast, zonal transport,
but note that this is an underestimate, and thus the result-           we might expect some correlation of number concentration
ing concentration will represent an underestimate. Calculat-           with flight corridor locations, but airborne observations with
ing the volume of the region defined above as the LMS to               denser sampling to compare highly trafficked with less traf-
be 3.12 × 10¹⁷ and 3.65 × 10¹⁷ m3 for the NH and SH, re-               ficked regions in the NH, and times around commercial flight
spectively, we get ambient concentrations of nucleation par-           times, would be needed to give a clearer picture of this. We
ticles emitted by aircraft in the LMS of 110 cm−3 in the NH            hope that data from the In-Service Aircraft for a Global Ob-
and a lower limit of 0.26 cm−3 in the SH. Taking an average            serving System (IAGOS) program, which includes an instru-
temperature and pressure of 220 K and 300 hPa for the LMS              ment package measuring concentrations of particles with di-
regions, and converting to standard temperature and pressure           ameters > 13 nm, will provide useful information from com-
(STP), this gives maximum concentrations of 300 std. cm−3              mercial aircraft when the data are made publicly available
for the NH and a lower limit of 0.71 std. cm−3 for the SH.             (Bundke et al., 2015).
Minimum aircraft emissions of nucleation mode aerosol re-                 From the global distributions of aircraft SO2 emissions
ported by Brock et al. (2000) are a factor of 10 lower than            from the CEDS database for 2014, we calculate the result-
the maximum we have used here, leading to concentrations               ing SO2 concentration in the LMS, assuming a 1-month life-
of 30 and 0.07 std. cm−3 for the NH and SH respectively.               time of SO2 in this region (see Sect. S2). Fast zonal mixing

Atmos. Chem. Phys., 21, 9065–9088, 2021                                                 https://doi.org/10.5194/acp-21-9065-2021
C. J. Williamson et al.: Hemispheric difference in stratospheric aerosol number 9079
in the LMS, as evidenced above, is assumed in these calcula- 7 Other potential direct sources of nucleation mode
tions. An in-depth study of aircraft emissions shows a 23 % particles and NPF precursors in the NH LMS
increase in SO2 emissions between 2014 and 2018 (Lee et al.,
2020); therefore, we multiply the calculated concentrations Other candidates for direct emissions of nucleation mode
of SO2 from 2014 by a factor 1.23 to get the expected 2018 particles and SO2 in the NH LMS are pyro-convection, the
concentrations and compare these to ATom observations in ASM, and volcanoes. Pyro-convection and the ASM are un-
the LMS as a function of potential temperature (Fig. 11d). likely to contribute substantially for the following reasons:
Concentrations of observed SO2 in the NH LMS are very
1. Nucleation mode and biomass burning particles in
similar to the expected aircraft emissions and have a very
the NH LMS did not follow the same trends with
similar vertical structure with a maximum occurring around
potential temperature (Fig. 10), which suggests that
340 K in both emissions and observations. Emitted and ob-
pyro-convection is not the major source of the nucle-
served SO2 concentrations in the SH LMS are very similar,
ation mode particles we observed. In October, there is
although observed concentrations are consistently a few pptv
some indication in the vertical structure of nucleation
higher. While this is certainly within the uncertainty of these
mode number concentrations being suppressed at higher
calculations, higher observed concentrations compared with
biomass burning particle mass concentrations and en-
aircraft emissions in the SH LMS are also likely to indicate
hanced at lower biomass burning particle mass concen-
that while aviation emissions dominate in the NH where we
tration. This suggests that the additional surface area
see large amounts of air traffic, other sources of SO2 in the
from biomass burning particles may reduce nucleation
LMS exist and become apparent in the SH LMS where there
mode number concentrations in the LMS through two
is currently very little air traffic. Summing the 2014 zonal av-
mechanisms, suppressing the formation of particles by
erage SO2 flux, and multiplying by the surface area of each
increasing the condensation sink and shortening the life-
grid box and a factor 1.23 to update for 2018 air traffic, we
time of particles that do form by increasing the coagu-
determine a total flux of 0.279 Tg yr−1 , with totals between
lation sink.
the tropopause and 13 km in the NH and SH respectively of
0.066 and 0.000183 Tg yr−1 . 2. While the ASM has been shown to be a source of SO2
Nonetheless, CEDS shows aircraft emissions capable of and particulate matter in the NH LMS, this is true only
producing SO2 concentration in the LMS of similar orders of during the monsoon season from June to September (Yu
magnitude to those observed in ATom in both hemispheres, et al., 2017). Since SO2 lifetime in the stratosphere is
with the same striking hemispheric difference and the same ∼ 1 month (Sect. S2) and nucleation mode particle life-
vertical structure in the NH. This strongly supports the ar- times are ∼ days, the enhancements observed on ATom
gument that the observed elevated SO2 concentrations in the in the NH in the fall, winter, and spring cannot have
NH LMS are caused by emissions from aircraft. The consis- been from ASM outflow. ATom stratospheric observa-
tency between measured SO2 mixing ratios and values calcu- tions did not see evidence of ASM-sourced particles
lated to be produced by aircraft emissions, together with the (Murphy et al., 2020). Therefore, the ASM is not the
MAIA simulations along air parcel trajectories, implies that cause of the observed NH LMS NPF.
ion-assisted, binary homogeneous NPF in the NH LMS is a
likely consequence of aircraft emissions. No evidence of accumulation mode particles from volcanoes
In addition, we note that non-methane volatile organic was observed in the NH LMS on ATom, except for in the
compounds (NMVOCs) emitted from aircraft follow a simi- SH in August (from the 2015 Calbuco eruption) (Murphy
lar distribution to SO2 from aircraft (Fig. S8). Even through et al., 2020). The lifetime of nucleation mode particles is
the emitted flux of NMVOCs from aircraft is of a similar shorter than that of accumulation mode particles in the LMS
magnitude to SO2 , we expect the steady-state mixing ra- (Sect. S2); therefore, there is no reason to suspect nucle-
tio of NMVOCs would be lower than that of SO2 because ation mode particles directly emitted from volcanoes would
they likely have shorter lifetimes in LMS conditions (Balka- be present in the NH LMS during ATom observations. Volca-
nski et al., 1993; Tsigaridis et al., 2014). The co-emission noes are, however, another potential source of direct injection
of NMVOCs and SO2 from aircraft means aircraft are a po- of SO2 into the LMS.
tential source of two of the most likely species involved in Smaller volcanic eruptions are capable of injecting SO2
aerosol nucleation and growth in the LMS, though we can- into the stratosphere. Eruptions contributing substantially
not at this stage quantify the fraction of condensable organic to SO2 concentrations and insubstantially to accumulation
vapours observed by Murphy et al. (2020) in the NH LMS mode particles that would have been detected as volcanic
that can be accounted for by aircraft emissions. would occur between a few weeks and a couple of months
from our measurements for each of the four deployments.
Using data from the Multi-Satellite Volcanic Sulfur Dioxide
L4 Long-Term Global Database V4 (MSVOLSO2L4) (Carn,
2021), we examine eruptions within 2 months leading up
https://doi.org/10.5194/acp-21-9065-2021 Atmos. Chem. Phys., 21, 9065–9088, 2021You can also read