Lawrence Berkeley National Laboratory - Recent Work - eScholarship
←
→
Page content transcription
If your browser does not render page correctly, please read the page content below
Lawrence Berkeley National Laboratory
Recent Work

Title
Using data from connected thermostats to track large power outages in the United States

Permalink
https://escholarship.org/uc/item/0156f6rx

Authors
Meier, A
Ueno, T
Pritoni, M

Publication Date
2019-12-15

DOI
10.1016/j.apenergy.2019.113940

Peer reviewed

 eScholarship.org                                Powered by the California Digital Library
                                                                 University of California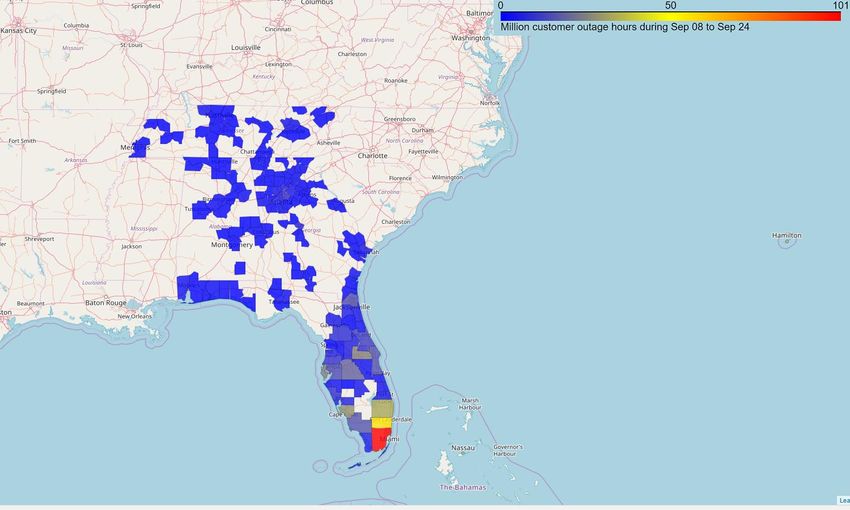
Published in Applied Energy

    Using data from connected thermostats
    to track large power outages in the
    United States
    Alan Meier - Lawrence Berkeley National Laboratory akmeier@lbl.gov (corresponding author)
    Tsuyoshi Ueno - Lawrence Berkeley National Laboratory
    Marco Pritoni - Lawrence Berkeley National Laboratory

    Postal Address: Alan Meier, Lawrence Berkeley National Laboratory, MS90R2000, Berkeley,
    CA 94720 USA

    Keywords: electricity; smart grid; hurricane; metrics; resilience, SAIDI; sensor

Meier, Alan, Tsuyoshi Ueno, and Marco Pritoni. 2019. “Using Data from Connected Thermostats to
   Track Large Power Outages in the United States.” Applied Energy 256 (December): 113940.
   https://doi.org/10.1016/j.apenergy.2019.113940.

    April 2019

    Abstract
    The detection of power outages is an essential activity for electric utilities. A large, national
    dataset of Internet-connected thermostats was used to explore and illustrate the ability of
    Internet-connected devices to geospatially track outages caused by hurricanes and other major
    weather events. The method was applied to nine major outage events, including hurricanes and
    windstorms. In one event, Hurricane Irma, a network of about 1,000 thermostats provided
    quantitatively similar results to detailed utility data with respect to the number of homes without
    power and identification of the most severely affected regions. The method generated regionally
    uniform outage data that would give emergency authorities additional visibility into the scope
    and magnitude of outages. The network of thermostat-sensors also made it possible to calculate
    a higher resolution version of outage duration (or SAIDI) at a level of customer-level visibility
    that was not previously available.

                                                                                                     1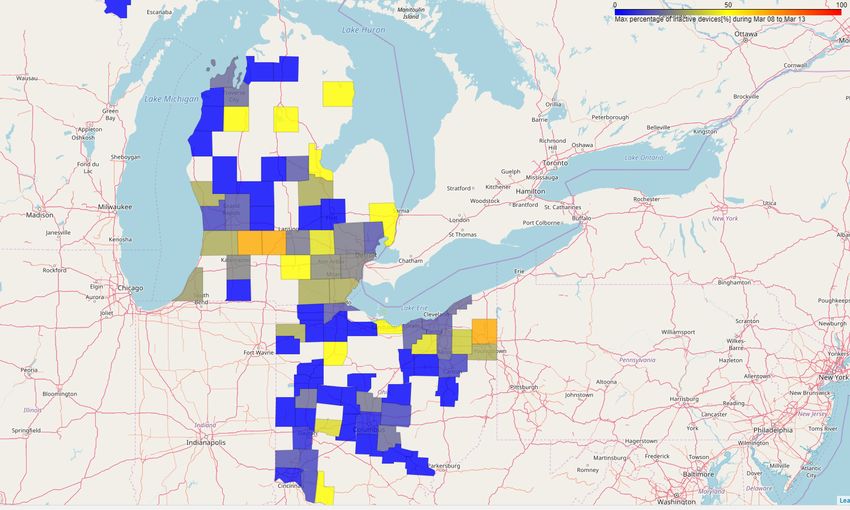
1. Introduction
Even brief interruptions in the supply of electric power to consumers can lead to significant
economic and human costs [1]. For this reason utilities devote considerable resources to rapid
detection and assessment of power outages. This situation is especially true in developed
countries; for example, customers in most European countries experienced fewer than two
hours without power in 2016 [2].

Electricity outages cost U.S. consumers roughly $44 billion in 2015 [3]. In spite of continuing
efforts to improve the grid, the frequency and duration of power outages has not appreciably
fallen in the last two decades and may have in fact risen [4], [5], [3]. Steps are being taken to
improve the reliability of the grid at points of generation, transmission, and distribution [6].
However, after an outage occurs, the key to minimizing economic consequences of an outage is
to quickly become aware of its presence and scope. This information enables the utility and
other emergency authorities to most efficiently mobilize resources to restore services [7].

Real-time outage detection remains an essential activity for electric utilities. Most utilities employ
an outage management system (OMS) to deal with these events [8]. The OMS draws
information from supervisory control and data acquisition (SCADA) devices, customer telephone
calls, smart meters, social media, and other sources [9]. About half of U.S. residential
customers are connected to smart meters (or advanced metering infrastructure—AMI). Modern
smart meters detect outages and transmit a “last gasp” signal at the time of the outage, which is
especially valuable in alerting the OMS of an outage and providing a location. However, the
transmission of the last gasp signal is not assured. These signals will not reach the OMS, or
may be delayed, if the mesh network is compromised [10].

Often the challenge for an OMS is not to obtain data but to avoid congestion from superfluous or
duplicate data [11]. Local gatekeepers are often established to reduce duplicate notifications,
combine messages, or verify outages through pinging. Utilities still rely heavily on customer
calls to detect outages. One survey of utilities in 2015 [12] claimed that customer calls were still
the primary source of outage notifications, far higher than SCADA or smart meters. Only
16 percent of utilities used their smart meters as the primary source of power failure alerts on
“blue-sky” days and 12 percent during storms. Handling excessive customer calls is an
expensive problem, too. For example, 30 percent of customers call more than once during an
outage because they do not know when their power will be restored [13].

Various services have emerged to aggregate the OMS data and present a national picture of
outages, often in near real time. One service [14] compiles OMS data from over 600 U.S.
utilities and offers outage information to customers at many different levels of geographical and
historical resolution. The quality of this information is, of course, only as good as the OMS data
supplied to it.

The drawbacks and weaknesses of current outage detection systems have stimulated the
development of new techniques to identify outages. These approaches are notable for their

                                                                                                     2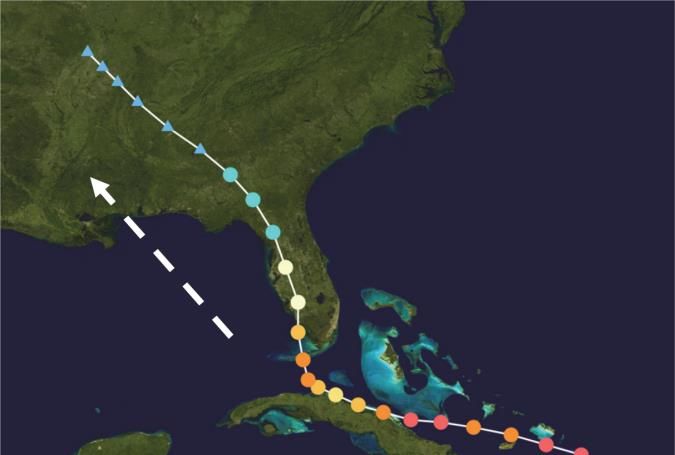
diversity, including satellite imagery, mobile telephones, social media, and status of Internet
connections. Curiously, most of these experiments have taken place outside of the traditional
utility environment. These explorations are briefly described below.

Satellite imagery has been proposed as means to identify large outages [15] and used to show
the impact of power outages caused by Hurricane Sandy. Similar assessments were
undertaken after the Fukushima nuclear disaster [16]. The approach involves comparison of
satellite images of the affected area to baseline photographs. The drawbacks of this approach
are low resolution, delay (until night), and susceptibility to cloud cover.

Mobile telephones have been used as outage sensors [17]. This approach relies on the fact that
a smartphone can detect a power outage based on its own power state. A smartphone will
change its state when plugged into a charger. If power is interrupted then the smartphone will
detect a change in state. It can further distinguish between a benign unplugging and a power
outage through filters and other inputs. After downloading a special app, the telephone can
notify a central entity of an outage. The system was tested in Kenya.

Sun et al. [18] and Hultquist et al. [19] tracked social media—Twitter—and, through semantic
analysis of content, identified messages related to power outages. This methodology enabled
the outages to be identified and geographically located.

Most devices connected to the Internet rely on grid-supplied power because the data flows
through a Wi-Fi router and a modem. When an outage occurs, the devices lose their network
connection and will go “dark,” that is, the service provider no longer receives data. Thus, loss of
a network connection can serve as an implicit outage sensor. Shulman [20] proposed a means
of identifying network/power outages during periods of intense storms. The method determines
connectivity by pinging a representative sample of residential IP addresses in the region
affected by the storm. When the pings were not returned (and after various error filters were
applied), the connection was assumed to be down. This procedure could determine the extent
of failed connections but could not distinguish between network and power outages. Heidemann
et al. [21] employed a similar approach to investigate the frequency and scope of Internet
outages. He found that a significant fraction of Internet outages in his dataset could be attributed
to power outages, notably those related to Hurricane Sandy.

The “industrial Internet of Things” (IIoT) was used by Simoes et al. [22] to track power outages
in Portugal. Many commercial operations have networks connecting hundreds—or even
thousands—of geo-located devices, including automated cash dispensers, mobile telephone
towers, and building security systems. These devices are regularly polled, so when they fail to
respond, a power outage can be inferred. The electric utility created an open, Internet-based
communication channel, for customers to send outage events. A specially designed program
then transforms the submissions into a structure that can provide situational awareness to the
grid operator.

                                                                                                   3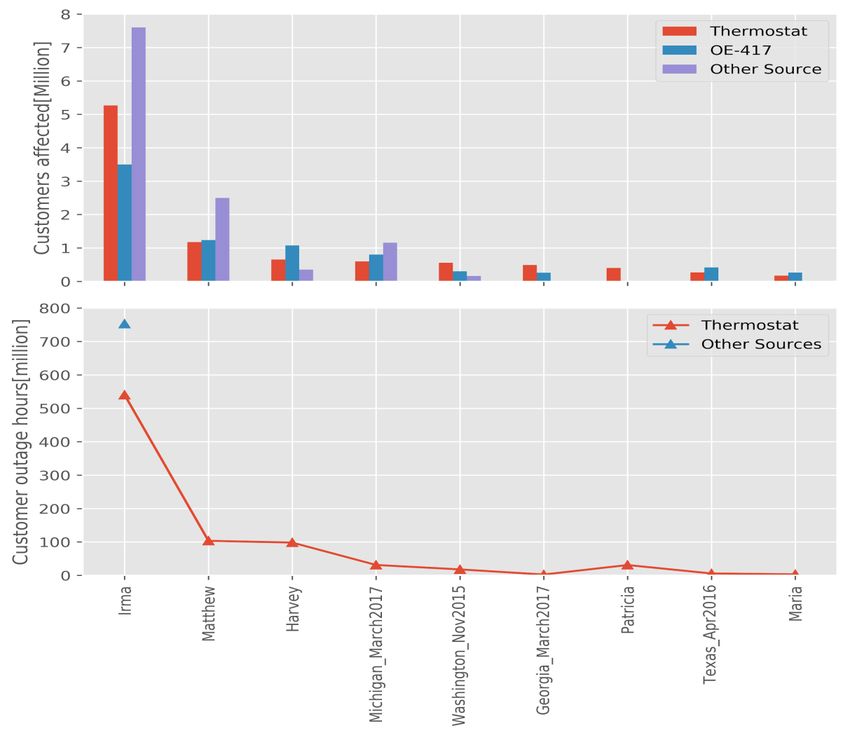
The research summarized above demonstrated that a range of networks can track power
outages. At the same time, it has been demonstrated that failures in the power grid lead to
interruptions in the Internet. In this paper we explore the ability of Internet-connected devices to
act as a highly distributed network of electricity grid sensors and to provide meaningful
information to grid operators, emergency authorities, and policymakers.

2. The Connected Thermostat Dataset
The network of Internet-connected thermostats (CTs) offers many of the same features as the
IIoT described above. These thermostats transmit data via the Internet to a service provider as
frequently as every five minutes. When a thermostat goes dark, the most likely cause is a power
outage. The thermostats are tracked in a consistent manner, spanning utility service areas,
states, and regions. This broad coverage is important in the United States because many
outages involve multiple utilities and grid operators. In the United States, there are at least
six million installed CTs, and the population is growing at a rate of about 20 percent per year.

Thermostat data were obtained through the ecobee Donate Your Data (DYD) program [23].
Ecobee sells and manages CTs primarily in North America. The DYD program enables users to
anonymously donate their operation data for research use. User data are gathered in servers
managed by ecobee. Every fifteen minutes, the ecobee thermostat records the thermostat
setpoints, the actual inside temperature, relative humidity, and HVAC runtime. Some models
record occupancy and temperatures in other rooms. These data are collected by the thermostat
and then transmitted via Wi-Fi and the Internet to an ecobee server.

Ecobee shares limited metadata about each participating DYD home with researchers, including
the home’s location (city and state or province), its approximate floor area, and age. Ecobee
also shares outside temperatures from nearby weather stations. Weather information was not
used in this analysis but may be useful for future outage-related research.

The DYD program began in 2015, and the number of participants increased rapidly. Figure 1
shows the monthly trend of the number of participants (and devices) in this study. By late 2018,
about 60,000 homes participated in the DYD program. This data collection program is orders of
magnitude more detailed than anything before it. For example, the Residential Energy
Consumption Survey (RECS) [24] is the only national program collecting similar data. RECS
surveys about 5,600 homes once every four years. The survey relies on consumer responses
for thermostat settings, and monthly utility bills are obtained from the local utility. The DYD
dataset can provide extraordinary insights into heating and cooling behaviors in North American
homes. For example, Huchuk et al. [25] used data from over 10,000 DYD thermostats to
investigate how different climates, seasons, and utility tariffs affected the occupants’ selection of
indoor temperatures.

The DYD data used in this study begin in January 2015 and end in September 2017. The
number of participating homes climbed during this period from 1,000 to 20,000. Figure 1 shows

                                                                                                    4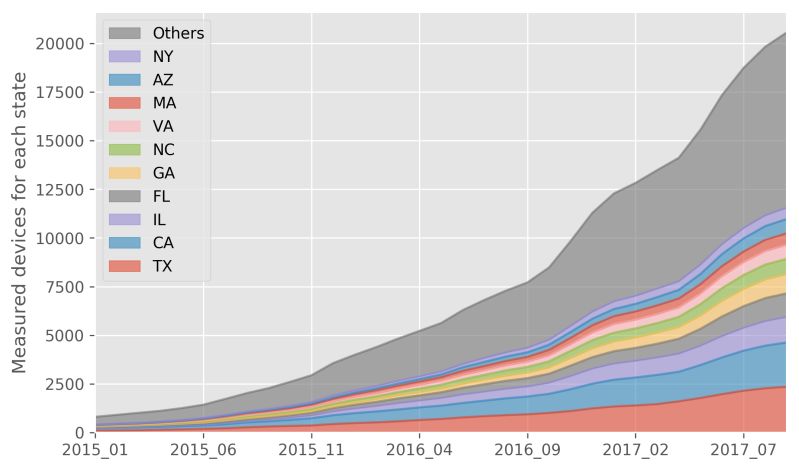
the rising number of thermostats during the study period. The numbers in the ten largest states
are broken out. Note that about half of the thermostats are located in the remaining states. The
DYD homes appear to be representative of the national building stock. We verified that the
homes in the DYD homes closely resembled the subset of single-family homes in the RECS
dataset by comparing home size and number of occupants [26].

Each DYD participant reported the city in which the thermostat was located. The city was then
mapped into its respective county. This level of geospatial precision appeared reasonable. A
county-level resolution also facilitated later comparison with other data sources, such as census
and utility service maps. Note that ecobee could apply greater geospatial precision in the future
but it limited location data in the DYD dataset to cities so as to preserve customer
confidentiality.

                  Figure 1. Monthly trend of participating thermostats by state

The files were cleaned to eliminate a range of defects, such as discontinuities caused by
daylight savings time and missing data. Some missing data also resulted from the procedures
ecobee used to anonymize the DYD participants and transfer files to researchers. The gaps
appeared in a mostly random manner. The lost data represented less than 5 percent of the
overall dataset; however, the resulting gaps were difficult to distinguish from power or network
outages. (Missing data rates have declined below 1 percent in more recent data transfers.)

3. Tracking Power Outages Caused by Hurricane
Irma
Hurricane Irma struck the Southeastern United States on September 8–24, 2017 and caused
many deaths, injuries, and extensive economic damage. The continental path of Hurricane Irma

                                                                                                   5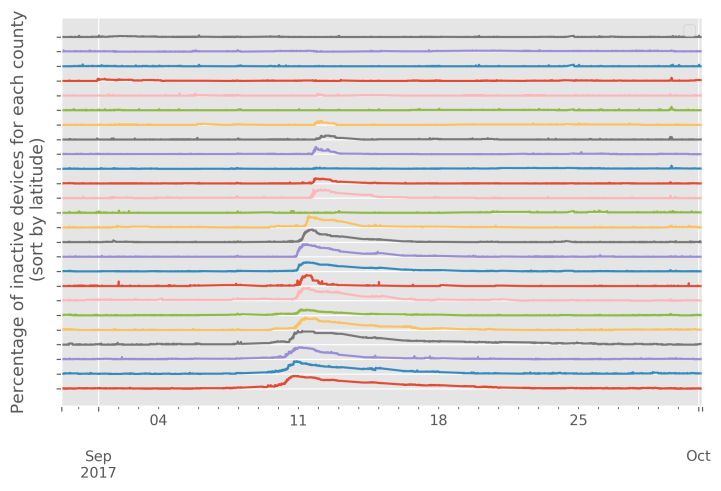
is shown in Figure 2. The hurricane passed through at least four states, which were serviced by
four large electric utilities and many smaller utilities [27].
Figure 2. Path of Hurricane Irma (September 8–24, 2017). Each dot corresponds to one day.
The color indicates Irma’s severity.
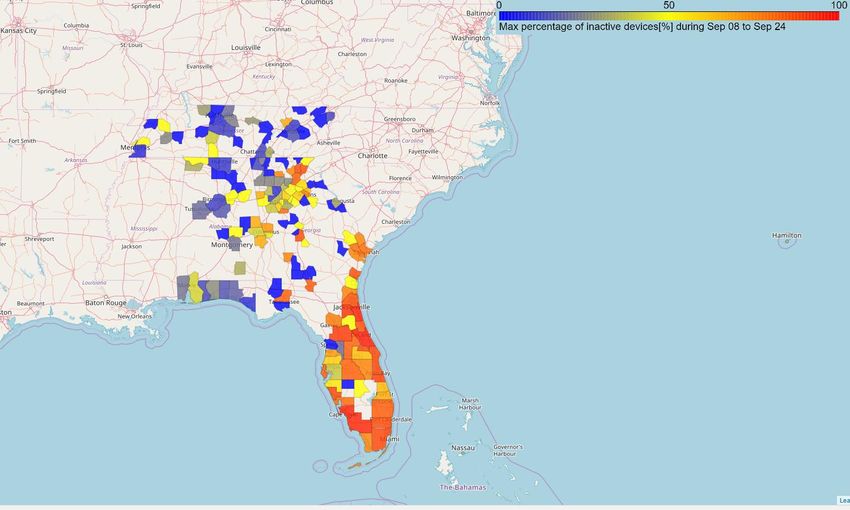
The geospatial impact of Hurricane Irma is revealed in the maximum fraction of inactive
thermostats observed in each county in Figure 3. White areas represent counties with fewer
than 30 thermostats. (These are typically counties with fewer people.) The most seriously
affected counties were in southwest Florida, but high outage fractions also occurred in counties
as far north as central Georgia, reflecting severe local conditions or less storm-resistant
electricity networks. This figure captures the scale and complexity of Irma’s impact in four states
and in the service areas of many different utilities.
Figure 3. Maximum fractions of inactive thermostats for each county (September 8–24, 2017)
6The number of affected customers in each county was extrapolated from the fraction of dark
thermostats in each county and the number of homes in that county. For example, if 20 percent
of thermostats were dark and the county had one hundred thousand homes, then 20,000
customers were estimated to be without power. The number of customers without power at
15-minute intervals is shown in Figure 4. Using this method of extrapolation, over five million
homes were without power at the peak on September 11. Figure 4 also shows that restoration
of power took many days and that over two million customers still lacked power five days after
the hurricane hit.
Figure 4. Customers affected by Hurricane Irma in the four most affected states
Each county was affected differently by Hurricane Irma, both in severity and timing. Figure 5
shows the time sequence of thermostat outages by county. (Counties with fewer than 30
thermostats were not plotted.) The counties are stacked by increasing latitude. Since Hurricane
Irma traveled south to north, the lag in outages caused a small but distinct time shift in each
county’s peak. In addition, the magnitude of the peak and total impact diminished as Irma
moved north.
Figure 5. Transition of power outage rates for each county with more than 30 thermostats
74. A Power Outage Caused by a Wind Storm
A severe wind storm struck the middle west United States on March 8, 2017, which led to
widespread power outages in Michigan and neighboring states [28]. The storm was much less
severe than Hurricane Irma, and the region has a sparser network of DYD thermostats
compared to Florida; nevertheless, the outage is still clearly displayed and its geospatial impact
can be inferred. Figure 6 shows the maximum fraction of inactive thermostats in each county
during the event. Only counties with more than 30 DYD homes are displayed. The extent of the
storm is evident, from Wisconsin to central Indiana and Ohio. At least two different grid
operators participate in the control of the affected region, and more than five electric utilities
serve this area, each with its own outage management system. A unified sensing network, with
consistent outage metrics, was not possible until the Internet-connected thermostats became
available.
Figure 7 shows the progression of outages over time. It displays the fraction of off-line
thermostats for the six counties with the largest number of DYD homes. They are stacked from
south to north (similar to that in Figure 3 for Hurricane Irma). Newspaper reports suggest that
the storm traveled from northwest to southeast, but this is not evident from the DYD data,
possibly because it traveled so rapidly. On the other hand, the orientation of the storm, that is,
northwest to southeast, is clear.
Figure 6. Maximum power outage rates for each county (March 8–13, 2017)
8Figure 7. Transitions of power outage rates for each county
5. Power Outage Metrics from Connected
Thermostat Data
The CT data also makes it possible to calculate standardized metrics related to outages. The
number of customer outage-hours was estimated for each county affected by Hurricane Irma.
This is analogous to the System Average Interruption Duration Index (SAIDI), except that CT
data can provide higher spatial and temporal resolution than is normally available from SCADA
data and other sources. Results are shown geospatially in Figure 8 and sorted by declining
values in Figure 9. With this higher resolution, it becomes possible to more clearly distinguish
between areas where many customers experienced brief outages and areas where a few
customers experienced long outages. (The SAIDI metrics would be the same, but the type of
disruption will be different.) For example, higher outage-hours per customer will lead to more
food spoilage in refrigerators or health impacts among vulnerable populations. Therefore, high-
resolution identification of outage-hours can be an important indicator of disproportionate
economic damage caused by power outages in specific neighborhoods, communities, or
counties. The figures show that, while southwestern Florida experienced the highest outage
rates, southeastern Florida experienced the greatest number of customer outage-hours.
The higher outage-hours mostly reflects the greater population in southeastern Florida
(principally, Miami).
9Figure 8. Maximum customer outage-hours for each county (September 8–24, 2017)
Figure 9. Customer outage-hours for each county by Hurricane Irma
10Utilities are required to submit Form OE-417 when a significant outage occurs [29]. The U.S.
Energy Information Administration (EIA) lists 12 criteria that require a utility to report an outage,
one of which is loss of service to 50,000 or more customers for one hour or more. These reports
are displayed in Figure 10a. In some cases other sources estimated the number of affected
customers, and they are also shown in Figures 10a and 10b. These estimates were diverse,
inconsistent, and often made prior to a retrospective evaluation. For example, many utilities
estimated affected customers during the outage itself and did not submit updates. The
techniques described for Hurricane Irma and the Michigan wind storm were applied to nine
major power outages. The number of consumers affected and total consumer outage-hours
were estimated (see Figures 10a and 10b). These values were compared to utility submissions
to the EIA for the same events.
Figures 10a and 10b. Comparison of customers affected and customer outage-hours for
selected major power outages (2015–2017)
11The three sources of outage information tracked closely with respect to ranking but differed with
respect to magnitudes of affected customers and outage-hours. Hurricane Irma was the largest
outage, regardless of metric and source of information.
6. Discussion
6.1 Using Internet-Connected Devices as Power Outage Sensors
We demonstrated the capability of a network of Internet-connected, geo-located devices to track
power outages. The approach reveals the geo-spatial impacts, chronology, and intensity of an
outage. It provides a regional outage perspective based on a consistent sensor network and
methodology.
We also demonstrated how the thermostat data can be converted into granular metrics suitable
for emergency management and policy analysis. The first metric is the number of customers
that lost power during an event. This number is often uncertain, especially when the outage
covers more than one utility or grid operator. The number of affected customers can also be
shown as a time-trajectory or geo-spatially. This information can help recovery efforts target the
most severely affected areas. A SAIDI with much higher geospatial resolution pinpoints the
overall intensity of the outage event. The intensity of Hurricane Irma, for example, becomes
more evident when comparing its outage-hours to those of Hurricane Matthew. A geo-spatial
breakdown of customer outage-hours by county can assist emergency authorities in locating the
most severely impacted areas. Insurance companies would find such data useful when
evaluating claims.
6.2 Uncertainty of a Grid Sensor Network Comprised of Internet-
Connected Devices
New types of uncertainties arise with this method of estimating outages. These uncertainties fall
into two categories: (1) reliability of the network disconnection as a proxy for an outage sensor,
and (2) validity of extrapolations from the population of DYD homes to the general population.
Some of the uncertainties are described below.
The underlying assumption behind our approach is that, when the service provider no longer
receives information from a thermostat, a power outage has occurred. But there are other
explanations for a thermostat going dark that do not involve a power outage. Possible
explanations include the following:
- The Internet network fails. Data networks have more interruptions than power networks,
[30] but these interruptions are typically brief and other features are present to mitigate
their impact [31]. Large network failures can be identified and filtered out.
12- The occupant switches off the thermostat. This happens sometimes during periods of
mild weather when no heating or cooling is required.
- The occupant unplugs or switches off the modem. This happens rarely and briefly, such
as when the occupant moves the modem.
These types of network interruptions will occur at a low, continuous level in mostly random
ways. We therefore conclude network interruptions not caused by power outages introduce a
low-level “noise” to the DYD or other thermostat data. These false signals will overstate the
frequency of outages. This uncertainty is small but needs to be quantified through further
research and algorithms developed to minimize these effects [31].
The number of affected customers relies on an extrapolation from a small number of homes with
connected thermostats. Since the highest level of geo-spatial resolution is the county, power
outages affecting only a fraction of a county will give ambiguous results. In Florida, the
extrapolation is based on only 1,204 DYD thermostats (less than 0.02 percent of Florida’s
homes). Reliance on such a small sample introduces uncertainty into the county, state, and
regional outage estimates, especially if the DYD homes differ from the rest of the population.
We checked to determine if DYD homes were significantly different from the national stock of
single-family homes by comparing the findings from the most recent Residential Energy
Consumption Survey [24] to the DYD homes. The RECS (single-family) and DYD homes were
similar in floor area, age, and number of occupants. We concluded that the DYD homes were
similar enough to the national stock to not cause significant distortions.
Other differences might arise at the county level. For example, some counties may have higher
fractions of apartments, few of which are in the DYD dataset (so far). The extrapolation may
also be misleading in counties with a large fraction of electricity consumed by industrial or
commercial sectors. The problem will probably become less important after aggregation; still,
further research would be useful.
The accuracy of this sensor network has not been compared with ground truth. A verification
would require finding a region meeting many criteria, including the following:
- A cooperating utility whose residential customers are equipped with smart meters that
store and transmit outage information
- A high concentration of homes with CTs
- Several power outages during the study period
- Customer permissions to release both utility and CT data
These criteria are logistically challenging. Moreover, smart meters have their own reporting
shortcomings, so they may be an imperfect ground truth. Nevertheless, two reality checks were
performed to verify the accuracy of our approach.
In the first verification, the number of customers suffering outages during Hurricane Irma were
compared using DYD data and detailed estimates from the Florida Public Service Commission.
13The Florida Public Service Commission estimated the number of affected customers by
tabulating the number of customers known to be on each failed subsystem and feeder line
having SCADA. Some smaller utilities are not included. This approach offers a means to
estimate outage impacts at a highly granular level (but does not rely on smart meters). Both
methods registered peak outages within a few hours of each other. The utilities reported slightly
more customers without power at the peak than were extrapolated from DYD data: 6.2 million
versus 5.6 million customers—that is, a difference of roughly 10 percent.
A second comparison was made between the total number of customer outage-hours from the
five largest events in 2017 (see Figure 10b) to an estimate of national outage-hours based on
EIA data. Table 1 summarizes the results.
Table 1. Outage comparison for major and ordinary events in 2017
EIA DYD
Definition of major event Utility Reports Outages
from Form Revealed by
OE-417 Filings Inspection of
DYD Data
Customer outage-hours caused by 786 645
major events (millions)
Customer outage-hours caused by 262 N.A.
ordinary events (millions)
Table 1 shows that the utilities reported 786 million outage-hours to the EIA in 2017. This
compares to 645 million outage-hours revealed by inspection of the DYD data. Thus, the DYD
data captured roughly 82 percent of the reported major outages. While not equal, this
comparison shows that the two very different approaches yield roughly similar results. Equality
should not be expected because some utilities did not report their outages. On the other hand,
the DYD outage-hours included all utilities but are based on only the five largest outages
investigated in this study. With further improvements in data processing, connected devices
could be an accurate means of estimating outage-hours from major outage events.
Comparisons of ordinary outage events are impossible with current techniques. The DYD data
contain too much “noise”—missing data, network outages, etc.—to observe power outages that
occur in small regions and at very low frequencies. Future improvements in algorithms should
be able to better distinguish actual power outages from other reasons that the connected device
is not transmitting data, but the noise can never be completely eliminated.
146.3 National Grid Reliability Metrics Using Internet-Connected
Devices
Utilities and governments have invested more than 32.5 billion dollars between 2008 and 2017
on improvements to the grid and expect to invest much more [32]. A comprehensive and
consistent set of metrics is needed to gauge the success of these and future investments, some
of which must address power outages. The EIA compiles utility reports of key outage metrics
related to frequency and duration of outages, the System Average Interruption Frequency
Index (SAIFI), and SAIDI. Only 30 percent of the utilities typically file reports, but these are the
largest and therefore represent a much larger fraction of total customers. Each utility employs
slightly different procedures and assumptions in its calculation, though utilities serving more
than 50 percent of U.S. customers claim to follow the IEEE standard 1366 [3], [33]. Our method
of measuring outages with Internet-connected devices makes possible a simple, consistent
procedure to collect national outage data.
The network’s geospatial resolution and accuracy depends on the number and distribution of its
sensors. Table 2 lists our estimates of the populations of various geospatially linked, networked
devices that could serve as grid sensors. An important feature of these networks is the number
of units linked to a single, national entity. A single entity simplifies collection and processing of
consistent, national, metrics. Consumer privacy also can be more easily maintained when a
single entity is responsible. Cable TV and broadband customers represent the largest potential
network, at about 80 million subscribers [34]. About one-third of these customers are served by
a single national provider (Comcast). We estimate that the population of Internet-connected
thermostats exceeds six million. These devices are offered by several providers, some of whom
already serve more than a million households. Automated teller machines are connected
through private networks and the Internet but are less frequently served by a central provider.
Neighborhoods of 100–300 homes served by residential cable TV systems are typically
connected to neighborhood nodes. These nodes are especially attractive grid sensors because
they have uninterruptible power supplies [35] and can therefore actively signal to the service
provider when a loss of grid power occurs. In addition, the cable nodes can be associated with
precise locations that are not subject to customer privacy constraints.
About 20,000 households participated in ecobee’s DYD program in 2017 and more than 60,000
are participating in 2018. SCADA-equipped substations are listed for comparison [36]. This is
typically the geospatial extent to which a utility has real-time visibility when smart meters are not
configured to provide real-time data. These data may be fed into grid authorities but are not fed
into a national entity.
15Table 2. Populations of network-connected sensors
Network-connected Device/Sensor Estimated Sensor
Population
(millions)
Cable TV boxes and Internet modems ~ 80
Internet-connected thermostats ~6
Bank automated teller machines (ATMs) 0.5
Cable TV and Internet network nodes 0.25
SCADA-equipped substations 0.07
Ecobee DYD thermostats (late 2018) 0.06
Table 2 shows that several existing sensor networks could provide equal or higher resolution
and geospatial coverage of outages than substations equipped with SCADA devices. The DYD
network has lower resolution than substations, but the number of participating thermostats will
likely overtake substations in 2019. The DYD program illustrates how quickly a network of
Internet-based sensors can be established and provide actionable information. The network can
also be built relatively inexpensively where it can piggyback on an existing infrastructure.
Ultimately, the network of cable TV nodes appears to be the most attractive because it offers
high geospatial resolution and active sensing. The technical specifications of cable nodes are
standardized so, in principle, an integrated national outage monitoring system could be created
by linking output from the major cable providers.
The most obvious users of this information are entities responsible for grid security and
resiliency, utilities, emergency management authorities, and insurance companies; however,
there may be other commercial applications of high-resolution outage data. For example, a
service provider could generate an “electricity reliability score” at the neighborhood level, similar
to the “walkability score” now available for some neighborhoods [37]. This information could
affect housing purchases because persons relying on medical equipment or using sensitive
electrical equipment would consider either avoiding these areas (or investing in back-up
generation). A service provider could also publish reliability scores for cities or whole utility
service areas.
6.4 Future Work
Future research might advance in at least three directions. First, the viability of the method
needs to be demonstrated in real time. A utility could partner with a provider of Internet-
connected devices to obtain real-time outage detection services. Does this network of sensors
provide additional visibility into outages and provide value beyond existing outage management
systems? Smaller studies might also permit detailed verification (and improvement) of the
16algorithms used to distinguish between network outages (and other reasons for the thermostat
not communicating) and power failures.
By 2021, this network of DYD thermostats will exceed the number and geospatial coverage of
all utility-managed SCADA systems in the United States. Further research is needed to
determine if the DYD data—or an alternative network—can complement conventional utility data
gathering methods as means of uniformly tracking long-term improvements in grid reliability.
Finally, Internet-connected devices could serve as even better grid sensors. For example, the
nodes in cable TV networks appear especially attractive. Their capabilities deserve additional
investigation and testing.
7. Conclusions
A new method for detecting power outages was introduced. The method relies on frequent
communications between Internet-connected devices in homes—in this case, thermostats—and
service providers. A power outage severs the communication link to these devices, which is
quickly noticed by the providers—sometimes in fewer than five minutes.
This work demonstrated that a network of Internet-connected thermostats could serve as power
outage sensors. The approach was applied to nine major outage events, including hurricanes
and windstorms. For Hurricane Irma, thermostat-based outage maps and impacts were
compared to detailed utility data. The network of about 1,000 thermostats provided
quantitatively similar results with respect to the number of homes without power (and then
reconnected) and most severely affected regions.
The DYD data captured roughly 82 percent of the outage-hours reported by utilities for major
events in 2017. With further improvements in data processing, connected thermostats—or other
connected devices—could be an accurate means of estimating outage-hours from major outage
events and tracking these events at a national scale in a uniform manner.
Detection of ordinary outage events at a national scale is not yet feasible with current
techniques. The DYD data still contain too much noise to observe power outages that occur in
small regions and at very low frequencies. Future improvements in algorithms should be able to
better distinguish actual power outages from other reasons that the connected devices are not
transmitting data, but the noise can never be completely eliminated.
This method generated regionally uniform outage data that would give emergency authorities
better visibility into the scope and magnitude of outages. This information is not sufficient for
utilities to manage their system—SCADA data and other sources are still essential—but it could
help them prioritize aid to the most severely affected communities. A separate monitoring
system may also give a utility visibility into grid status when the conventional SCADA data are
compromised through cyber disruption.
17Acknowledgements
The authors deeply appreciate the cooperation of ecobee, Inc., and its anonymous customers
who participated in the Donate Your Data program. The authors also wish to thank Joe Eto,
Brent Huchuk, and Curtis Snyder for their valuable comments, in addition to the extensive and
constructive comments by the anonymous reviewers. This research used data from
©OpenStreetMap contributors for visualization. Dr. Ueno was supported by the Central
Research Institute of the Electric Power Industry (Japan). This research was supported by the
Grid Modernization initiative of the U.S. Department of Energy as part of its Grid Modernization
Laboratory Consortium, a strategic partnership between the U.S. Department of Energy (DOE)
and the national laboratories to bring together leading experts, technologies, and resources to
collaborate on the goal of modernizing the nation's grid.
References
[1] M. de Nooij, C. Koopmans, and C. Bijvoet, “The value of supply security: The costs of power
interruptions: Economic input for damage reduction and investment in networks,” Energy
Econ., vol. 29, no. 2, pp. 277–295, Mar. 2007.
[2] Council of European Energy Regulators, “CEER Benchmarking Report 6.1 on the Continuity
of Electricity and Gas Supply,” Council of European Energy Regulators, Brussels, C18-
EQS-86–03, Jul. 2018.
[3] K. H. LaCommare, J. H. Eto, L. N. Dunn, and M. D. Sohn, “Improving the estimated cost of
sustained power interruptions to electricity customers,” Energy, vol. 153, pp. 1038–1047,
Jun. 2018.
[4] P. Hines, J. Apt, and S. Talukdar, “Large blackouts in North America: Historical trends and
policy implications,” Energy Policy, vol. 37, no. 12, pp. 5249–5259, Dec. 2009.
[5] P. H. Larsen, K. H. LaCommare, J. H. Eto, and J. L. Sweeney, “Assessing Changes in the
Reliability of the U.S. Electric Power System,” Aug. 2015.
[6] B. Kroposki, P. Skare, R. Pratt, T. King, and A. Ellis, “Grid Modernization Laboratory
Consortium - Testing and Verification,” in 2017 Ninth Annual IEEE Green Technologies
Conference (GreenTech), 2017, pp. 238–245.
[7] S. D. Guikema, R. Nateghi, S. M. Quiring, A. Staid, A. C. Reilly, and M. Gao, “Predicting
hurricane power outages to support storm response planning,” IEEE Access, vol. 2,
pp. 1364–1373, 2014.
[8] M. J. Mousavi, N. Kang, H. Kazemzadeh, and C. McCarthy, “Automatic Restoration
Systems and Outage Management,” in Smart Grids: Advanced Technologies and Solutions,
Second Edition, Boca Raton, Florida: Taylor & Francis, 2017.
[9] R. Kelley and R. Pate, “Mesh networks and outage management,” Elster, Mainz-Kastel
(Germany), WP42-1002A, Jun. 2009.
[10] Y. Liao, Y. Weng, C.-W. Tan, and R. Rajagopal, “Fast Distribution Grid Line Outage
Identification with $\mu$PMU,” arXiv:1811.05646 Cs Stat, Nov. 2018.
[11] S. Garlapati, T. Kuruganti, M. R. Buehrer, and J. H. Reed, “OTRA-THS MAC to reduce
Power Outage Data Collection Latency in a smart meter network,” 2014 International
Conference on Computing, Networking and Communications (ICNC), 2014, pp. 776–781.
18[12] Bridge Energy Group, “BRIDGE Energy Group Survey Shows Customer Calls, Not Smart
Meters, Still Primary Source of Power Outage Notification for Utilities,” BRIDGE Energy
Group, Apr. 28, 2015.
[13] P.-C. Chen, T. Dokic, and M. Kezunovic, “The use of big data for outage management in
distribution systems,” in International Conference on Electricity Distribution (CIRED)
Workshop, 2014.
[14] Bluefire Studios LLC, “PowerOutage.US,” 2019. [Online]. Available: https://poweroutage.us/.
[Accessed: Apr. 6, 2019].
[15] B. Min, Z. O’Keeffe, and F. Zhang, “Whose Power Gets Cut ? Using High-Frequency
Satellite Images to Measure Power Supply Irregularity,” The World Bank, 8131, Jun. 2017.
[16] Earth Observation Group, “Japan Earthquake & Tsunami March 2011,” Earth Observation
Group, Mar. 2011. [Online]. Available:
https://ngdc.noaa.gov/eog/data/web_data/japan/japan.html. [Accessed: Oct 2, 2018].
[17] N. Klugman, J. Rosa, P. Pannuto, M. Podolsky, W. Huang, and P. Dutta, “Grid Watch:
Mapping Blackouts with Smart Phones,” in Proceedings of the 15th Workshop on Mobile
Computing Systems and Applications, New York, NY, USA, 2014, pp. 1:1–1:6.
[18] H. Sun, Z. Wang, J. Wang, Z. Huang, N. Carrington, and J. Liao, “Data-Driven Power
Outage Detection by Social Sensors,” IEEE Trans. Smart Grid, vol. 7, no. 5, pp. 2516–2524,
Sep. 2016.
[19] C. Hultquist, M. Simpson, G. Cervone, and Q. Huang, “Using Nightlight Remote Sensing
Imagery and Twitter Data to Study Power Outages,” in Proceedings of the 1st ACM
SIGSPATIAL International Workshop on the Use of GIS in Emergency Management, New
York, NY, USA, 2015, pp. 6:1–6:6.
[20] A. Schulman and N. Spring, “Pingin’in the rain,” in Proceedings of the 2011 ACM SIGCOMM
conference on Internet measurement conference, 2011, pp. 19–28.
[21] J. Heidemann, L. Quan, and Y. Pradkin, A preliminary analysis of network outages during
hurricane sandy. University of Southern California, Information Sciences Institute, 2012.
[22] J. Simoes, A. Blanquet, and N. Santos, “Near real-time outage detection with spatio-
temporal event correlation,” 2016, pp. 3.
[23] Ecobee Inc., “Donate Your Data,” Ecobee, 2018. [Online]. Available:
https://www.ecobee.com/donateyourdata/. [Accessed: Oct 1, 2018].
[24] EIA, “Residential Energy Consumption Survey (RECS),” Energy Information Administration,
Washington, D.C., 2015.
[25] B. Huchuk, W. O’Brien, and S. Sanner, “A longitudinal study of thermostat behaviors based
on climate, seasonal, and energy price considerations using connected thermostat data,”
Build. Environ., vol. 139, pp. 199–210, Jul. 2018.
[26] A. Meier, T. Ueno, L. Rainer, M. Pritoni, A. Daken, and D. Baldewicz, “What can connected
thermostats tell us about American heating and cooling habits?,” in ECEEE 2019 Summer
Study, Hyères, France, 2019.
[27] Energy Information Administration, “Hurricane Irma cut power to nearly two-thirds of
Florida’s electricity customers - Today in Energy - U.S. Energy Information Administration
(EIA),” Today in Energy, Sep. 20, 2017. [Online]. Available:
https://www.eia.gov/todayinenergy/detail.php?id=34232#. [Accessed: Aug 2, 2018].
[28] D. Bartkowiak, “Michigan Power Outage 2017,” Click on Detroit, Mar. 2017. [Online].
Available: https://www.clickondetroit.com/michigan-power-outage-2017. [Accessed: Oct. 5,
2018].
[29] Office of Electricity Delivery, “Electric Emergency Incident and Disturbance Report.” U.S.
Department of Energy, Nov. 2014.
[30] G. Aceto, A. Botta, P. Marchetta, V. Persico, and A. Pescapé, “A comprehensive survey on
internet outages,” J. Netw. Comput. Appl., vol. 113, pp. 36–63, Jul. 2018.
19[31] A. Meier, “An Algorithm to Identify Power Outages Based on Internet Disconnects,”
Lawrence Berkeley National Laboratory, Berkeley (California), GMLC, Mar. 2017.
[32] R. J. Campbell, “The Smart Grid: Status and Outlook,” Congressional Research Service,
Washington, D.C., R45156, Apr. 2018.
[33] Energy Information Administration, “Average frequency and duration of electric distribution
outages vary by states,” Today in Energy, Apr. 5, 2018. [Online]. Available:
https://www.eia.gov/todayinenergy/detail.php?id=35652#. [Accessed: Aug. 1, 2018].
[34] P. Kafka, “Comcast, the largest broadband company in the U.S., is getting even bigger,”
Recode, Apr. 27, 2017. [Online]. Available:
https://www.recode.net/2017/4/27/15413870/comcast-broadband-internet-pay-tv-
subscribers-q1-2017. [Accessed: Oct. 16, 2018].
[35] Alpha Technologies, “Alpha Micro 350 Datasheet.” 2018.
[36] National Academy of Sciences, National Academy of Engineering, and National Research
Council, America’s Energy Future: Technology and Transformation. Washington, DC: The
National Academies Press, 2009.
[37] Walk Score, “Find Apartments for Rent and Rentals - Get Your Walk Score,” Walk Score,
2018. [Online]. Available: https://www.walkscore.com/. [Accessed: Oct 5, 2018].
20You can also read