Leduc 50-Year Growth Study: Population and Employment Projections - Updated - City of Leduc Nichols Applied Management Inc.
←
→
Page content transcription
If your browser does not render page correctly, please read the page content below
Leduc 50-Year Growth Study: Population and
Employment Projections – Updated
Submitted to:
City of Leduc
Submitted by:
Nichols Applied Management Inc.
Management and Economic Consultants
Suite 203, 11523 – 100 Avenue NW
Edmonton, Alberta T5K 0J8

June 4, 2020
Table of Contents
1.      Introduction ................................................................................................3
2.      Growth Methodology .................................................................................4
        2.1      Overview .......................................................................................4
        2.2      Key Considerations ......................................................................4
3.      Historical Growth in the City of Leduc .......................................................9
4.      Projections ...............................................................................................10
        4.1      Baseline Scenario .......................................................................10
     4.1.1          Baseline Scenario Assumptions ................................................ 10

     4.1.2          Baseline Scenario Results ........................................................ 10
        4.2         Low Scenario ..............................................................................12
     4.2.1          Low Scenario Assumptions ....................................................... 12
     4.2.2          Low Scenario Results ................................................................ 12
        4.3         High Scenario .............................................................................13
     4.3.1          High Scenario Assumptions ...................................................... 13

     4.3.2          High Scenario Results ............................................................... 13
5.      Projection Comparisons ..........................................................................15
6.      Works Cited .............................................................................................16

LIST OF FIGURES
Figure 2-1       Alberta Employment Change by Industry (%) – January to April
                 2020 ..............................................................................................5
Figure 2-2       Alberta GDP Growth Rate and Unemployment Rate Forecasts –
                 2020 ..............................................................................................6
Figure 2-3    Edmonton CMA GDP Growth Rate and Unemployment Rate
                 Forecast – 2019-2024 ..................................................................7
Figure 2-4       Aerotropolis Buildout Areas ..........................................................8
Figure 3-1       City of Leduc Historical Population Growth ..................................9
Figure 3-2       City of Leduc Historical Employment Growth ...............................9
Figure 4-1       Population Projection in the City of Leduc (2018-2070) –
                 Baseline Scenario .......................................................................11
Figure 4-2       Population Projection in the City of Leduc (2018-2070) – Low
                 Scenario .....................................................................................12
Figure 4-3       Population Projection in the City of Leduc (2018-2070) – High
                 Scenario .....................................................................................14
Figure 5-1       City of Leduc Population Projection Comparisons to 2070 ........15

LIST OF TABLES
Table 2-1           Alberta Unemployment Rates January – April 2020 ....................4
Table 4-1           Population and Employment Projections (2020-2070) – Baseline
                    Scenario .....................................................................................11
Table 4-2 Population and Employment Projections (2020-2070) – Low
Scenario .....................................................................................13
Table 4-3 Population and Employment Projections (2020-2070) – High
Scenario .....................................................................................141. Introduction
The City of Leduc (the City) is looking to better understand how Leduc has grown, how it will grow into the future,
and what the City can do to shape this growth. To this end, the City has retained Nichols Applied Management
(Nichols) to develop population and employment projections as a first step for a growth study contracted to ISL
Engineering and Land Services and Nichols. The growth study will inform future planning and development
initiatives in the City.
Nichols previously prepared population and employment projections to the City in 2019; however, two major
events have since transpired throughout the first quarter of 2020, including:
• the COVID-19 pandemic which has triggered a worldwide economic downturn; and
• the contraction of the oil and gas sector caused by a combination of market access issues, an oil price war
between Saudi Arabia and Russia, and reduced demand for energy products due to the ongoing pandemic.
Additionally, the manifestation of growth at the Edmonton International Airport (EIA) has deviated from plans
previously described in the Aerotropolis Viability Study (MXD Development Strategists 2015), upon which
previous growth forecasts for the City were based.
The changing economic environment along with the reality of development at the EIA has resulted in a request
from the City for updated projections. This report is intended to provide an overview of our updated methods and
key findings of three population and employment projection scenarios for the City to 2070.
City of Leduc 32. Growth Methodology
2.1 Overview
Population growth in communities generally consists of two core components:
• the natural rate of population growth, reflective of the fertility and mortality rates of the population; and
• in- or out-migration driven by the prevailing local/regional/provincial economic conditions and the associated
demand for labour in the community.
Nichols has developed a growth model that incorporates both the natural rate of population growth as well as a
detailed labour market that reflects the relative labour demand and supply in the City driving in- or out-migration.
This labour market is tied to overall economic conditions in the region and province overall and community-
specific family structures are used to estimate in- or out-migration associated with labour market changes.
Using the above-described methodology, the Study Team has developed three projection scenarios (baseline,
low, and high) for population and employment in the City from 2020 to 2070. A detailed description of the
assumptions and results of each scenario are provided in the following section.
2.2 Key Considerations
In the first quarter of 2020 we have seen two major economic events that are expected to have substantial
impacts on the Alberta economy, including:
• the COVID-19 pandemic which has triggered a worldwide economic downturn; and
• the contraction of the oil and gas sector caused by a combination of market access issues, an oil price war
between Saudi Arabia and Russia, and reduced demand for energy products due to the ongoing pandemic.
Both of these events have significant impacts on several key variables of community population growth such as
the unemployment rate and job availability. Recent labour force data from Statistics Canada has shown an
increase in unemployment in the province in the first four months of 2020 (Table 2-1).
Table 2-1 Alberta Unemployment Rates January – April 2020
Unemployment Rate (%)
Month (2020)
Alberta Edmonton CMA Calgary CMA
January 7.3 8.2 7.2
February 7.2 7.8 7.4
March 8.7 7.9 8.6
April 13.4 10.0 10.8
Source: Statistics Canada 2020a, 2020b, 2020c.
Employment has been impacted across all sectors in Alberta, but the largest impacts are being felt by service
industries such as accommodation and food services, retail trade, and other services (Figure 2-1).
City of Leduc 4Figure 2-1 Alberta Employment Change by Industry (%) – January to April 2020
-50.5% Accommodation and food services
-23.8% Other services
-21.3% Wholesale and retail trade
-18.7% Information, culture and recreation
-15.0% Transportation and warehousing
-13.8% Construction
-12.5% Manufacturing
-12.5% Agriculture
-11.2% Professional, scientific and technical services
-10.2% Health care and social assistance
-9.2% Educational services
-6.2% Utilities
-6.1% Business, building and other support services
-5.2% Natural resources
-4.5% Finance, insurance, real estate, rental and leasing
-1.0% Public administration
-60% -40% -20% 0%
Change in Employment (%)
Source: Statistics Canada 2020a, 2020b, 2020c.
The extent of these impacts throughout the remainder of 2020 and beyond remains to be seen. Several forecasts
have suggested that the province will experience economic contraction over 2020, resulting in negative growth in
GDP and a spike in unemployment. As compared to 2019, where GDP growth was an estimated 0.3% and the
provincial unemployment rate was approximately 6.9% (RBC Economics 2020), forecasts from RBC Economics,
TD Economics, and the Conference Board of Canada (CBOC) suggest that Alberta’s GDP growth in 2020 could
be as low as -10.5%, with the unemployment rate as high as 13.9% over the year (Figure 2-2). The Canadian
Mortgage and Housing Corporation (CMHC) has provided a relatively grim forecast, suggesting that home prices
could fall by 9% to 18% over the next year as a result of the COVID-19 pandemic (Canadian Mortgage Trends
2020a). Alternatively, Stephen Poloz, the current Bank of Canada Governor, remains optimistic and expects a
sharp upturn in economic production once public health measures are eased (Canadian Mortgage Trends 2020b).
City of Leduc 5Figure 2-2 Alberta GDP Growth Rate and Unemployment Rate Forecasts – 2020
RBC | TD | CBOC
20.0%
13.9%
15.0% 12.0%
9.3%
10.0%
Rate (%)
5.0%
0.0%
-5.0%
-5.8%
-10.0% -8.2%
-10.5%
-15.0%
GDP Growth Rate Unemployment Rate
Source: RBC Economics 2020; TD Economics 2020; Conference Board of Canada 2020a.
Indeed, energy-related sectors have suffered from a particularly rough start to 2020. The oil and gas industry has
dealt with major economic impacts caused by an oil price war between Saudi Arabia and Russia, as well as
reduced demand for energy products due to the COVID-19 pandemic. These events have had substantial short-
term impacts on the oil and gas industry. Namely, both West Texas Intermediate (WTI) and Western Canadian
Select (WCS) oil futures contracts for May 2020 hit negative prices for the first time in history. Prices have since
rebounded slightly, but the industry is expected to struggle at least through the remainder of 2020 as major capital
investment is being pulled and the country’s drilling forecast is expected to hit a 49-year record low (Global News
2020).
The CBOC has released additional city-specific forecasts for 13 major Census Metropolitan Areas (CMAs) in
Canada to 2024. The Edmonton CMA forecast, which includes the City of Leduc, is depicted below in Figure 2-3.
Like the province, Edmonton’s economy is expected to contract in 2020 with GDP growth of -5.6% and an
unemployment rate of approximately 11.1%. Sectors that are expected to experience the biggest contractions
throughout 2020 include:
• retail;
• arts and entertainment;
• accommodation and food services;
• construction; and
• industries directly tied to the energy sector (e.g. oil and gas, manufacturing, and professional services).
Conversely, public service sectors are expected to experience very little output loss. Health care services are
anticipated to grow throughout 2020 by over 3% due to additional labour needs during the COVID-19 pandemic
(CBOC 2020b).
In 2021 and beyond, the effects of the economic contractions in 2020 are anticipated to abate. It is expected that
GDP will rebound in 2021, growing by over 6%, before returning to more typical growth rates between 2022 and
City of Leduc 62024 (Figure 2-3). Similarly, the unemployment rate is expected to decline annually from 2021 to 2024 as the
economic impacts of 2020 lessen.
Figure 2-3 Edmonton CMA GDP Growth Rate and Unemployment Rate Forecast – 2019-2024
GDP Growth Rate | Unemployment Rate
12.0% 11.1%
10.0% 9.2%
8.5% 8.1%
8.0% 7.4% 7.4%
6.2%
6.0%
4.1%
4.0% 3.2% 3.4%
Rate (%)
2.0%
0.3%
0.0%
-2.0%
-4.0%
-6.0%
-5.6%
-8.0%
2019 2020 2021 2022 2023 2024
Source: Conference Board of Canada 2020b.
The long-term impacts of recent short-term shocks to oil and gas remain to be seen. Major energy projects such
as an LNG Canada export terminal and the Trans Mountain pipeline expansion will experience short-term
setbacks due to the current economic environment, but the projects are expected to maintain long-term viability
as outlooks for both natural gas and oil remain relatively stable (CBC 2020).
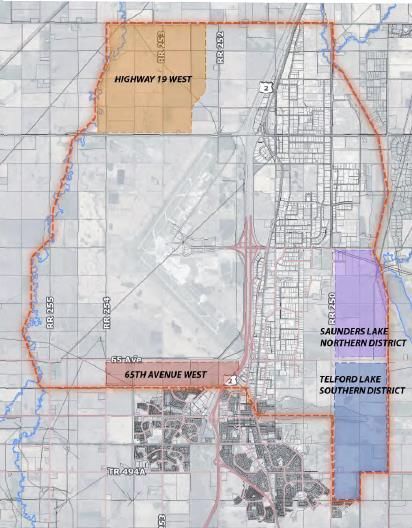
In addition to the COVID-19 pandemic and the variety of risks currently facing the energy sector, the City of Leduc
is also facing a great deal of uncertainty around competing growth near the EIA. The Aerotropolis Viability Study
(MXD Development Strategists 2015) was used to support assumptions surrounding growth near the EIA in
Nichols’ original growth forecasting. Original Aerotropolis growth was described across four priority areas:
Highway 19 West (Leduc County), Saunders Lake Northern District (Leduc County), Telford Lake Southern
District (City of Leduc), and 65th Avenue West (City of Leduc) (Figure 2-4). The development path was proposed
to occur between 2020 and 2050, with Aerotropolis lands becoming home to “economic clusters” including life
sciences, agribusiness, transportation, energy, advanced manufacturing, aerospace and aviation, education, and
ICT. It was suggested that the Aerotropolis could create over 35,000 direct jobs, as well as over 27,000 indirect
and induced jobs at full buildout.
City of Leduc 7Figure 2-4 Aerotropolis Buildout Areas
Source: MXD Development Strategists 2015.
Since the publication of the Aerotropolis Viability Study, it has become increasingly apparent that development
near the EIA is following a different path than that outlined in the Aerotropolis study (personal communication with
City of Leduc representatives 2020). Instead of growth in the major economic sectors identified in the study, most
of the growth that has taken place near the EIA has been retail-related, such as the Premium Outlet Collection
Shopping Centre and Costco. Additionally, Remington Lands owned by the City of Edmonton located directly east
of the Highway 19 Aerotropolis area are currently being developed as the Discovery Business Park (Remington
Corp 2019), including a combination of light industrial and urban commercial development. As such, it is expected
that development near the EIA is more likely to include a combination of light industrial and commercial (primarily
retail) development as opposed to the diverse, dense, campus-style development outlined in the Aerotropolis
study.
Overall, the City is facing several short- and long-term impacts that could push the City onto a different growth
path than previously expected or perhaps alter the nature of growth itself. For example:
• The negative impact of the COVID-19 pandemic is expected to be relatively short-lived but the shifts towards
working remotely and remote service delivery may persist and alter the way employment lands are used over
time.
• The current challenges faced by the energy sector may resolve in the medium-term as market access issues
relent (e.g. completion of TransMountain); however, the behaviour of OPEC and Russia is uncertain and an
American presidential candidate has vowed to limit pipeline development from Alberta.
• Ongoing development near the EIA will undoubtedly shape the demand for various commercial development
in the City over the long-term (personal communication with City of Leduc representatives 2020).
City of Leduc 83. Historical Growth in the City of Leduc
In an effort to provide context for the results and to support key assumptions relied upon in the projections, the
balance of this section provides a cursory overview of historical population and employment growth in the City of
Leduc.
Between 2001 and 2019, the City of Leduc’s population has grown from approximately 15,030 to 33,032. The
compound annual growth rate (CAGR) over this period has fluctuated (Figure 3-1), ranging from a high in the
2001 to 2008 period to a low of 3.3% in the 2013 to 2019 period, with the overall CAGR equalling approximately
4.47%.
Figure 3-1 City of Leduc Historical Population Growth
35,000
30,000
5.8% 3.3%
25,000
Number of Persons
4.6%
20,000
15,000
10,000
5,000
-
2001 2002 2003 2004 2005 2006 2007 2008 2009 2010 2011 2012 2013 2014 2015 2016 2017 2018 2019
Source: City of Leduc Municipal and Federal Censuses.
Similarly, the CAGR of employed persons in the City has fluctuated in the past, peaking between 2006 and 2011
at 7.4%, and with a CAGR between 2001 and 2016 of approximately 4.4%. (Figure 3-2).
Figure 3-2 City of Leduc Historical Employment Growth
18,000
16,000
7.4%
Number of Employed Persons
14,000
2.9%
12,000
2.9%
10,000
8,000
6,000
4,000
2,000
-
2001 2006 2011 2016
Source: Federal Censuses
City of Leduc 94. Projections
Given the profound events described in preceding sections of this report as well as the uncertainty associated
with the recovery from these events, Nichols has prepared multiple scenarios to depict growth in the City of Leduc
through to 2070. The assumptions relied upon to generate these scenarios reflect the key considerations outlined
in section 2.2 and historical conditions outlined in section 3. It should be noted that the previously held
assumption of the Aerotropolis concept as a driving force behind a specific type and magnitude of employment
growth in and around the City of Leduc has been discarded.
At the time of this writing, the recovery from COVID and the health of the energy sector are evolving rapidly. As
such, material changes to the scenarios may be appropriate as additional information comes forward.
4.1 Baseline Scenario
4.1.1 Baseline Scenario Assumptions
The major economic changes that have occurred in the first quarter in 2020 and are expected to remain at least in
the short-term. Accordingly, the Study Team has conducted population and employment calculations under a set
of “status-quo” assumptions that explicitly account for the COVID-19 pandemic and recent impacts to the oil and
gas industry in the short-term, including:
• Fertility and mortality rates based on the historical distribution of rates in the City between 2001 and 2017.
• Unemployment in the City’s labour force rising to 11% in 2020 to reflect the COVID-19 pandemic and decline
in the energy sector, with a gradual decline to a “full employment” rate of 6% over a 10-year period. This
assumption is generally in line with the CBOC’s recent forecast for the Edmonton CMA (CBOC 2020b).
• Job growth in the City’s labour force contracting in 2020 to depict the widespread job losses resulting from the
COVID-19 pandemic and decline of the energy industry. Several current forecasts are anticipating some
economic recovery starting in 2021 (e.g. CBOC 2020a, National Bank of Canada 2020). As such,
employment recovery will be modelled starting in 2021, with existing residents regaining employment
throughout the year. By 2022 job growth in the City’s labour force will return to a normalized average annual
growth rate of 2.9% until 2030, a rate that is consistent with historical growth in the City of Leduc outside of
peak (2006-2011) years and higher than recent employment growth in the Edmonton Metropolitan Region
(about 1% between 2015-2019; Statistics Canada 2020d). After 2030, the growth rate is assumed to
converge to the forecasted rate for the region of 1.6% (Government of Alberta 2016).
4.1.2 Baseline Scenario Results
Based on both natural population growth and in-migration driven by the labour market, it is expected that the
population of the City will increase to an estimated 81,210 (Figure 4-1), slightly lower than the original baseline
estimate of 86,560.
City of Leduc 10Figure 4-1 Population Projection in the City of Leduc (2018-2070) – Baseline Scenario
90,000
81,210
80,000
70,000
Number of Persons
60,000
50,000
40,000 32,440
30,000
20,000
10,000
0
The estimated compound annual growth rate for the entire period (2018-2070) is approximately 1.8%. As noted
earlier, the baseline scenario assumes a high unemployment rate and negative growth in jobs within the City’s
labour force in 2020 due to the COVID-19 pandemic and the decline in the energy sector, before recovery
beginning in 2021. The resulting total employment in the City is expected to grow to approximately 44,970 by
2070 (Table 4-1).
Table 4-1 Population and Employment Projections (2020-2070) – Baseline Scenario
Year Population Total Employment
2020 33,210 16,870
2025 36,350 19,380
2030 40,470 22,340
2035 45,380 25,270
2040 50,250 27,900
2045 54,770 30,240
2050 59,430 32,740
2055 64,130 35,440
2060 69,130 38,370
2065 74,770 41,540
2070 81,210 44,970
City of Leduc 114.2 Low Scenario
4.2.1 Low Scenario Assumptions
The Study Team has conducted population and employment calculations under a set of “low scenario”
assumptions that include the same assumptions as the baseline scenario, along with the following adjustments:
• Following the recovery from COVID-19, the energy sector experiences relatively lower growth over the 50-
year period as compared to the baseline scenario due to the long-term impacts associated with the economic
events of 2020, coupled with ongoing market-access issues faced by the sector.
• Reduced growth in the energy sector spills over to other sectors of the economy (e.g. manufacturing),
resulting in slightly reduced employment growth in non-energy related sectors of the City’s labour force
(growth at a rate of 2.8% until 2030 after which job growth converges to a rate of 1.5%).
4.2.2 Low Scenario Results
Based on both natural population growth and in-migration driven by the labour market, it is expected that the
population of the City will increase to an estimated 74,250 in the low scenario, approximately 9% lower than the
baseline scenario (Figure 4-2).
Figure 4-2 Population Projection in the City of Leduc (2018-2070) – Low Scenario
80,000 74,250
70,000
60,000
Number of Persons
50,000
40,000 32,440
30,000
20,000
10,000
0
The estimated compound annual growth rate for the entire period (2018-2070) is approximately 1.6%. The
resulting total employment in the City is expected to grow to approximately 41,220 by 2070 (Table 4-2).
City of Leduc 12Table 4-2 Population and Employment Projections (2020-2070) – Low Scenario
Year Population Total Employment
2020 33,210 16,870
2025 36,120 19,270
2030 39,730 21,970
2035 44,050 24,600
2040 48,260 26,880
2045 52,180 28,880
2050 56,150 31,000
2055 60,070 33,290
2060 64,210 35,740
2065 68,890 38,380
2070 74,250 41,220
4.3 High Scenario
4.3.1 High Scenario Assumptions
The Study Team has conducted population and employment calculations under a set of “high scenario”
assumptions that include the same assumptions as the baseline scenario, along with the following adjustments:
• Following the recovery from the events of 2020, job growth in the City’s labour force will return to a
normalized average annual growth rate of 2.9% until 2035. After 2035, the growth rate is assumed to
converge to the long-term rate of 2.4%, higher than the forecasted rate for the region of 1.6% (Government of
Alberta 2016).
4.3.2 High Scenario Results
Based on both natural population growth and in-migration driven by the labour market, it is expected that the
population of the City will increase to an estimated 109,110 in the high scenario, substantially higher (34%) than
the baseline scenario (Figure 4-3).
City of Leduc 13Figure 4-3 Population Projection in the City of Leduc (2018-2070) – High Scenario
120,000
109,110
110,000
100,000
90,000
Number of Persons
80,000
70,000
60,000
50,000
32,440
40,000
30,000
20,000
10,000
0
The estimated compound annual growth rate for the entire period (2018-2070) is approximately 2.4%. The
resulting total employment in the City is expected to grow to approximately 59,740 by 2070 (Table 4-2).
Table 4-3 Population and Employment Projections (2020-2070) – High Scenario
Year Population Total Employment
2020 33,210 16,870
2025 36,360 19,380
2030 40,520 22,360
2035 46,470 25,800
2040 53,130 29,330
2045 60,300 33,020
2050 68,110 37,180
2055 76,520 41,860
2060 85,870 47,130
2065 96,660 53,060
2070 109,110 59,740
City of Leduc 145. Projection Comparisons
The Edmonton Metropolitan Region Board (EMRB), formerly known as the Capital Region Board (CRB),
developed population projections for each of its member municipalities. Compared to the projections published by
the EMRB (updated by Nichols in 2016 to reflect 2016 census data and extended to 2070), the three scenarios
presented in this report fall between the EMRB’s low and high projections (Figure 5-1). While the Nichols
scenarios depict slightly different growth paths than those presented by the EMRB, both Nichols low and high
scenarios are relatively in line with the EMRB low and high scenarios. It is important to note that the EMRB
projections are based on dated information and have not been adjusted to account for the recent economic
environment.
Figure 5-1 City of Leduc Population Projection Comparisons to 2070
City of Leduc Actual 2016 EMRB Low Case Nichols Low
Nichols Baseline Nichols High 2016 EMRB High Case
130,000
110,000
90,000
Number of Persons
70,000
50,000
30,000
10,000
City of Leduc 156. Works Cited
Canadian Mortgage Trends. 2020a. CMHC’s Gloomy Outlook: Up to 18% Drop in Home Prices. Available at:
https://www.canadianmortgagetrends.com/2020/05/cmhcs-siddall-delivers-gloomy-outlook-up-to-18-drop-
in-home-prices-20-arrears-rate/
Canadian Mortgage Trends. 2020b. Risks to Economic Outlook “Overblown”, But Rates to Stay Low: Poloz.
Available at: https://www.canadianmortgagetrends.com/2020/05/risks-to-economic-outlook-overblown-
but-rates-to-stay-low-poloz/
CBC. 2020. Trans Mountain, LNG Canada say they are on track despite pandemic. Available at
https://www.cbc.ca/news/canada/calgary/trans-mountain-lng-canada-andrew-leach-werner-antweiler-
1.5545607
Conference Board of Canada. 2020a. Provincial Outlook Spring 2020 Preliminary Forecast. Available at:
https://www.conferenceboard.ca/focus-areas/canadian-economics/provincial-outlook
Conference Board of Canada. 2020b. Major City Insights – Edmonton. Available at:
https://www.conferenceboard.ca/focus-areas/canadian-economics/major-city-insights/edmonton
Global News. 2020. Canada’s oil and gas drilling forecast revised to 49 year low as producers cut spending.
Available at: https://globalnews.ca/news/6888324/canada-drilling-forecast-2020-psac/
Government of Alberta. 2016. Alberta Occupational Demand Outlook at 3-Digit NOC-S, 2016-2020. Available at:
https://open.alberta.ca/dataset/7937c76e-846a-4e06-9f51-74d6a4a62dc9/resource/86ccfdf2-b7a5-4eef-
bdbb-4164d9e45981/download/2016-2020-occupational-forecast-edmonton.pdf
MXD Development Strategists/Stantec. 2015. Alberta Aerotropolis – Aerotropolis Viability Study, Final Report.
National Bank of Canada. 2020. Monthly Economic Monitor – Economics and Strategy, May 2020. Available at:
https://www.nbc.ca/content/dam/bnc/en/rates-and-analysis/economic-analysis/monthly-economic-
monitor.pdf
RBC Economics. 2020. Provincial Outlook Update April 2020. Available at: https://royal-bank-of-canada-
2124.docs.contently.com/v/covid-19-recession-deepens-fast-from-coast-to-coast-report
Remington Corp. 2019. Discovery Business Park. Available at:
http://remingtoncorp.com/leasing/industrial/discovery-business-park/
Statistics Canada. 2020a. Labour Force Survey, February 2020. Available at:
https://www150.statcan.gc.ca/n1/daily-quotidien/200306/dq200306a-eng.htm
Statistics Canada. 2020b. Labour Force Survey, March 2020. Available at: https://www150.statcan.gc.ca/n1/daily-
quotidien/200409/dq200409a-eng.htm
Statistics Canada. 2020c. Labour Force Survey, April 2020. Available at: https://www150.statcan.gc.ca/n1/daily-
quotidien/200508/dq200508a-eng.htm
Statistics Canada. 2020d. Table 14-10-0096-01 Labour force characteristics by census metropolitan area,
annual.
TD Economics. 2020. Provincial Forecast Update April 2020. Available at: https://economics.td.com/pef-update
City of Leduc 16Nichols Applied Management Inc. Management and Economic Consultants Suite 302, 11523 – 100 Avenue NW Edmonton, Alberta T5K 0J8 Main Contact: Pearce Shewchuk, Principal Office: (780) 424‐0091 / Direct: (780) 409‐1759 Email: p.shewchuk@nicholsappliedmanagement.com www.nicholsappliedmanagement.com
You can also read