Lee Point Master-planned Urban Development - Water Quality Monitoring Plan
←
→
Page content transcription
If your browser does not render page correctly, please read the page content below
Draft Report

Lee Point Master-planned Urban Development – Water
Quality Monitoring Plan

Prepared for
Defence Housing Australia
October 2017

Ecology and Heritage Partners Pty Ltd
Author (Janice Taylor)

         MELBOURNE: 292 Mt Alexander Road Ascot Vale VIC 3032 GEELONG: PO Box 8048 Newtown VIC 3220
        BRISBANE: Level 22, 127 Creek Street Brisbane QLD 4000 ADELAIDE: 22 Greenhill Road Wayville SA 5034
      CANBERRA: Level 6, 39 London Circuit, Canberra ACT 2601 SYDNEY: Level 5, 616 Harris Street, Ultimo, NSW, 2007
                                        www.ehpartners.com.au | 1300 839 325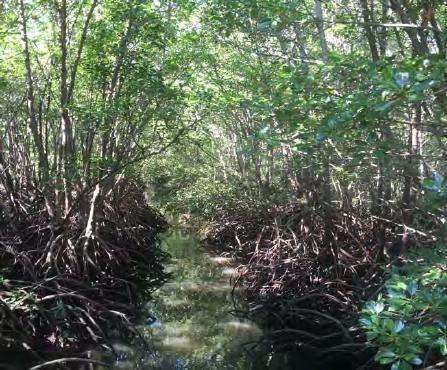
DOCUMENT CONTROL

          Assessment     Water Quality Monitoring Plan
             Address     Lee Point, Darwin, Northern Territory
   Project number        7793
  Project manager        Tom Wright
  Report author(s)       Janice Taylor
           File name     7793_LeePoint_WQMP_Final_11102017
               Client    Defence Housing Australia

  Report versions                              Comments                         Comments updated by            Date submitted

Draft 1                    Internal review                                                                 26/05/2017
Draft 2                    Updated legislation and project description          TW                         29/07/2017
Draft 3                    Address comments from DoEE                           JT                         11/10/2017
                           Address additional comments           from    DoEE
Draft 4                                                                         TW                         30/10/2017
                           regarding Buffalo Creek

                                         Copyright © Ecology and Heritage Partners Pty Ltd
                        This document is subject to copyright and may only be used for the purposes for
                        which it was commissioned. The use or copying of this document in whole or
                        part without the permission of Ecology and Heritage Partners Pty Ltd is an
                        infringement of copyright.

                                                            Disclaimer
                        Although Ecology and Heritage Partners Pty Ltd have taken all the necessary
                        steps to ensure that an accurate document has been prepared, the company
                        accepts no liability for any damages or loss incurred as a result of reliance placed
                        upon the report and its contents.

                           Lee Point Master-planned Urban Development – Water Quality Monitoring Plan                           2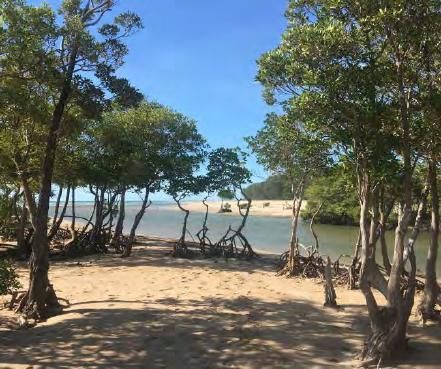
CONTENTS

1     INTRODUCTION ................................................................................................... 5
    1.1    Background ........................................................................................................................................ 5

    1.2    Purpose .............................................................................................................................................. 5
    1.3    Objectives .......................................................................................................................................... 6
    1.4    Scope of Work.................................................................................................................................... 6

    1.5    Study Area.......................................................................................................................................... 6
      1.5.1       Sandy Creek Estuary................................................................................................................... 6
      1.5.2       Buffalo Creek Estuary ................................................................................................................. 7
2     RELEVANT LEGISLATION AND POLICY, GUIDELINES ................................................... 8
3     EXISTING ENVIRONMENT ...................................................................................... 9
    3.1    Climate ............................................................................................................................................... 9
    3.2    Hydrology ........................................................................................................................................... 9
    3.3    Flora and Fauna ............................................................................................................................... 10
    3.4    Uses and Environmental Values ....................................................................................................... 11
4     POTENTIAL IMPACTS ........................................................................................... 13
5     MONITORING PROGRAM ..................................................................................... 15
    5.1    Monitoring Sites and Parameters .................................................................................................... 15

    5.2    Quality assurance and quality control .............................................................................................. 16
      5.2.1       Instrument calibration ............................................................................................................. 17
      5.2.2       Sampling technique ................................................................................................................. 17

      5.2.3       Storage and Transport ............................................................................................................. 17
6     WATER QUALITY MANAGE MENT ........................................................................... 18
    6.1    Water Quality Trigger Values ........................................................................................................... 18

    6.2    Reporting ......................................................................................................................................... 19
    6.3    Contingency ..................................................................................................................................... 21
      6.3.1       Adverse weather ...................................................................................................................... 21

      6.3.2       Human error / accidental spills ................................................................................................ 21
      6.3.3       Ineffective stormwater treatment ........................................................................................... 21
7     REFERENCES ...................................................................................................... 23

                             Lee Point Master-planned Urban Development – Water Quality Monitoring Plan                                                           3
FIGURES ................................................................................................................. 25
Lee Point Master-planned Urban Development – Water Quality Monitoring Plan 41 INTRODUCTION
1.1 Background
This Water Quality Monitoring Plan (WQMP) has been prepared by Ecology and Heritage Partners Pty Ltd to
support the Environmental Impact Statement (EIS) for the Lee Point Master-planned Urban Development
(herein referred to as ‘the Project’), including the 2CRU site and Muirhead site, located on Lee Point Road,
Lee Point, Darwin, Northern Territory (Figure 1).
The primary purpose of the Defence Housing Australia (DHA) development is to provide residential housing
with smaller sections dedicated for commercial purposes and potential tourism/hotel development. This
report details the water quality monitoring requirements for the pre-construction (baseline), construction
and occupation of the project site.
1.2 Purpose
Assessing estuary ecosystem health requires a framework for setting the objectives, selecting appropriate
indicators, monitoring and reporting to measure components of the ecosystem that contribute to its overall
health. The purpose of this WQMP is to determine baseline water quality conditions and natural variability in
both the Sandy Creek and Buffalo Creek tidal estuaries. It also provides the framework once baseline values
are obtained to conduct subsequent monitoring that will enable the detection of change in water quality and
condition of these systems during the construction and occupation of the Project. The monitoring plan is
designed to assist DHA in their determination on the cause of any change beyond natural variability (e.g.,
construction; erosion; stormwater runoff/discharge; spills) as a result of the project and what mitigation
measures are required.
As no baseline data currently exists for Sandy Creek, it is advised that if any works take place prior to the
implementation of this monitoring plan, that the DHA refer to the default guideline trigger values provided in
Tables 3.3.4-3.3.5 for Tropical Australia in the Australian and New Zealand Guidelines for Fresh and Marine
Water Quality (ANZECC, 2000) (herein referred to as ‘the guidelines’). The guidelines recommend trigger
values, which represent bioavailable concentrations or unacceptable levels of contamination, that if
exceeded, trigger the incorporation of additional information or further investigation to determine whether
or not a real risk to the ecosystem exists and, where possible, to adjust the trigger values into regional, local
or site-specific guidelines (ANZECC, 2000). In the case of Buffalo creek, baseline data can be extrapolated
from previous monitoring conducted by both the NT Government and Power and Water Corporation (PWC),
as per the data described within the various Darwin Harbour, Shoal Bay and Buffalo creek report cards
(2009-2016).
The ability to delineate influences on these systems from pre-, during- and post-construction activities versus
other natural and human influences presents a challenge. The WQMP takes into account that no data has
been collected for Sandy creek to date and Buffalo creek is influenced by multiple cumulative industry
discharges. Seasonal constraints (i.e Wet and Dry season) are reflected in how the monitoring data will be
collected and used to determine baseline variability for these systems. It is important to recognise that the
Lee Point Master-planned Urban Development – Water Quality Monitoring Plan 5Sandy Creek catchment currently forms part of a slightly-moderately disturbed system, and the Buffalo Creek
catchment forms part of a highly disturbed system with multiple urban and industrial (waste) point sources.
1.3 Objectives
The objectives of the monitoring plan, as per Section 5.3.1 of the Terms of Reference (ToR) for the EIS,
include:
To ensure that surface water resources and quality are protected both now and in the future, such
that ecological health and land uses, and the health, welfare and amenity of people are maintained.
Available water supplies will be sufficient to fulfil the Project needs over the predicted life of the
Project, both construction and occupation, without causing environmental or social impacts.
Ensure minimal sedimentation and turbidity increases as a result of Project activities.
1.4 Scope of Work
As per section 5.3 of the ToR, this water quality monitoring plan will form part of the overall Construction
Environment Management Plan (CEMP), to:
Identify surface water values (environmental, baseline and trigger values) within Sandy Creek
estuary and Buffalo Creek estuary.
Identify potential surface water impacts.
Identify clear thresholds and management (contingency) measures in response to potential impacts.
Implement the surface water monitoring plan to achieve environmental objectives and protect
environmental values.
Provide relevant water quality data and information collected to assess the effectiveness of the
Erosion and Sediment Control Plan (ESCP) and Stormwater Management Plans (SMPs).
The monitoring plan will also outline contingency measures that will be implemented over the stages of the
Project in the event that a significant change in the environmental values is detected.
1.5 Study Area
1.5.1 Sandy Creek Estuary
Sandy Creek estuary is located approximately 13 kilometres north north-east of Darwin city and forms part of
the Darwin Harbour Watershed and Finniss River Catchment. The creek originates in the suburb of Lyons and
flows past the Royal Darwin Hospital before entering the Casuarina Coastal Reserve where its channel flows
parallel to the western boundary of the 2CRU site through to Darwin Harbour.
Sandy Creek’s catchment area has been substantially altered by previous urban developments; however, as
the water quality has not been monitored the impact of urban development is not known. As only a small
portion of the Sandy Creek catchment is within the area proposed for the current development and all
stormwater discharge will be managed through a detention basin shown on the master plan in the south-
Lee Point Master-planned Urban Development – Water Quality Monitoring Plan 6west corner of the 2CRU site, the developments contribution to cumulative impacts is expected to be
relatively minor.
1.5.2 Buffalo Creek Estuary
Buffalo Creek is located approximately 14 km north north-east of Darwin’s CBD and forms part of the Darwin
Harbour Watershed (Figure 2). This tidal influenced creek flows into Shoal Bay, listed by the Northern
Territory (NT) Government as a Site of International Significance (NRETAS, 2007) for a number of reasons
including:
Extensive tidal flats providing important feeding and roosting area for migratory shorebirds
Small inland freshwater wetlands frequented by up to 5,000 waterbirds
Patches of rainforest around the margin of the tidal flats
Threatened species including three plants, ten vertebrates and one invertebrate.
Buffalo Creek is a highly disturbed tributary, as a result of a number of past and present land uses including
the Leanyer-Sanderson Sewerage Treatment Plant (LSSTP) that continues to discharge secondary treated
sewage directly into Buffalo Creek since 1971, untreated urban stormwater, landfills, recreational activities
(including a caravan park, a water park and recreational boating), a historic quarry mine, and historical use as
a military training range (Drewry, 2010).
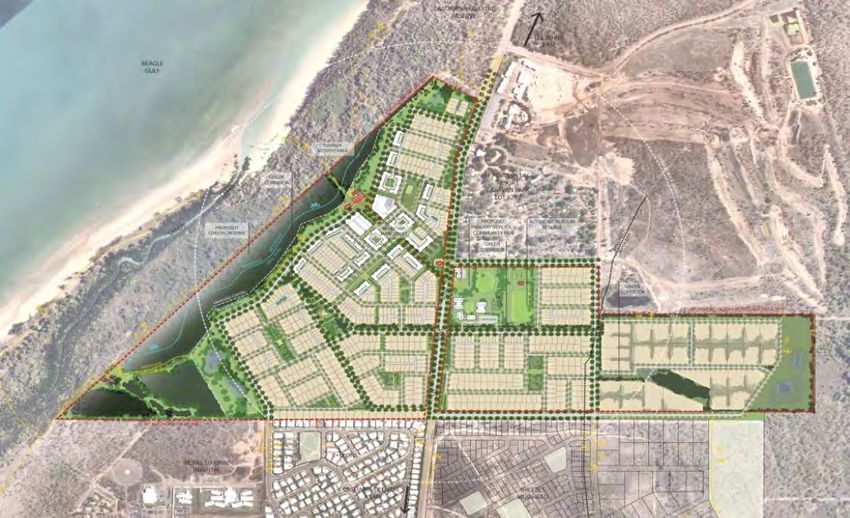
The areas proposed for development occur across both Buffalo Creek and Sandy Creek catchments and
drainage lines (Figure 2). Surface water from the western portion of the 2CRU site currently drains west to
Sandy Creek via overland flows, gullies and minor drainage lines, with the main point of discharge occurring
in the southwestern corner of the site to a drainage line that flows through Casuarina Coastal Reserve and
into Sandy Creek. Surface water from the eastern portion of the Muirhead site currently drains east to
Buffalo Creek via overland flows, gullies and minor drainage lines, with the main point of discharge occurring
in the south-eastern corner of the site to a drainage line that flows through Buffalo creek management area
Reserve and into Sandy Creek. Both the Sandy Creek and Buffalo Creek catchments currently receive
stormwater discharge from existing urban/residential areas and Buffalo Creek also receives discharge of
treated sewage effluent from the Leanyer Sanderson Wastewater Treatment Ponds approximately 5 km
upstream of the mouth.
Lee Point Master-planned Urban Development – Water Quality Monitoring Plan 72 RELEVANT LEGISLATION AND POLICY, GUIDELINES
The principal legislative basis for water quality management in the Northern Territory is the Water Act 1992.
The legislation includes a process for:
Identifying and declaring beneficial uses or environmental values. These include environment,
cultural and human use values; and
Establishing corresponding water quality objectives or water quality standards to protect identified
beneficial uses.
Water Quality Objectives (WQOs) can be declared under Part 7, Section 73 of the Act. This declaration allows
natural resource managers and regulators to use WQOs as benchmarks for regulation to protect beneficial
uses and for their use as performance measures for monitoring and reporting.
Other relevant strategies, guidelines and policies include the:
National Water Quality Management Strategy (NWQMS) 1992;
Australian and New Zealand Guidelines for Fresh and Marine Water Quality (ANZECC and ARMCANZ,
2000);
National Water Initiative (2005)
Environmental Assessment Act 2013
Territory Parks and Wildlife Conservation Act 2014 (TPWC Act)
Lee Point Master-planned Urban Development – Water Quality Monitoring Plan 83 EXISTING ENVIRONMENT The main coastal landforms in the Casuarina Coastal Reserve include intertidal sandflats, offshore reefs, dune, beach ridges, estuarine fringes and waterways including Sandy, Rapid and Buffalo Creeks (Parks and Wildlife, 2016). Sandy Creek is tidally influenced and is dominated primarily by mangroves and salt tolerant vegetation. The intertidal sandflats provide habitat for marine invertebrates, migratory waders and turtles. This area also receives the highest level of visitor use in the Reserve. Buffalo Creek begins as a freshwater system gradually mixing into an estuarine tidal system consisting of a long, narrow channel gently meandering near its confluence with Shoal Bay, containing a large intertidal sand bar (Haese, et al., 2009). In its upper reaches, it splits into two tributaries, fed by stormwater drains and dominated by salt flats and fringing closed grassland / sedgeland communities. Towards the mid to lower reaches, the creek is fringed by mangroves in its intertidal zone, consisting mostly of Rhizophora stylosa, Bruguiera exaristata and Camptostemon schultzii closed to open forest. The following sections describe the existing environment, potential impacts and proposed water quality monitoring and management of Sandy Creek and Buffalo Creek tidal estuary. 3.1 Climate Darwin has a tropical monsoonal climate with distinct wet and dry seasons. Climate data has been extracted from the Bureau of Meteorology (BOM) Darwin Airport station (Site number: 014015). The dry season is typical of a semi-desert climate, which runs from April/May to October, experiencing an annual maximum temperature of 39°C with an annual mean of 32°C, which varies very little year-round and is generally recorded over 30°C most days of the year (BOM, 2017). Darwin experiences a mean annual rainfall of 1722 mm, with the highest recorded rainfall occurring over the Wet season between November and April with humidity highest in the morning at between 72-83%. The Wet season is also known as cyclone season for its cooling tropical rainstorms. 3.2 Hydrology There is little known information regarding the hydrology of the catchment area of Sandy Creek. It is a short narrow channel situated within a mangrove-dominated coastal reserve, with a few drainage lines and no connected tributaries (Plate 1 and 2). It lies within an area with a mesotidal or low-macrotidal range (>4 m tidal range). There is no available data on the freshwater inputs and water quality data for the system. NT Government report cards that describe the condition of Buffalo creek from 2009-2016, state an overall water quality rating of ‘E’, (i.e. Very poor water quality. No water quality indicators meet desired levels)), where
2010). There are, however, other sources of pollution including the direct discharge of untreated urban
runoff directly into the creek in the upper reaches resulting in cumulative impacts.

Plate 1. Sandy Creek estuary directly below 2CRU             Plate 2. Sandy Creek estuary at Casuarina Beach
(Ecology and Heritage Partners Pty Ltd 31/05/2016).          (Ecology and Heritage Partners Pty Ltd 31/05/2016).

Plate 3. Buffalo Creek estuary near the LSSTP (DENR
2010).

3.3 Flora and Fauna
Sandy Creek flows into Casuarina Beach that forms part of Shoal Bay, which is listed by the NT Government
as a Site of International Significance (NRETAS, 2007) for a number of reasons. Six sites in Shoal Bay are listed
on the Register of the National Estate for their natural values including Casuarina Beach-Lee Point-Buffalo
Creek Area (Australian Heritage Council).
There are approximately 273 native plant species, 266 native vertebrate species, and 213 species of birds
recorded in the Reserve (Parks and Wildlife, 2016). This includes two threatened flora species and at least 10
threatened fauna species (DLRM, 2014; Parks and Wildlife, 2016). The Reserve supports a wide variety of
coastal habitats that are typical of the area, with Lee Point, Sandy Creek and Buffalo Creek all recognised as
nationally and internationally important sites for migratory and resident shorebirds (Chatto R. 2003, Parks
and Wildlife, 2016). These sites are used for feeding and roosting by shorebirds, making this an important
shorebird area over the dry season and especially over the wet season. The migratory shorebirds that use

                       Lee Point Master-planned Urban Development – Water Quality Monitoring Plan                  10
the Reserve are protected under several bilateral agreements including the Convention of Migratory Species
of Wild Animals (Bonn Convention), Japan-Australia Migratory Bird Agreement (JAMBA), China-Australia
Migratory Bird Agreement (CAMBA) and Republic of Korea-Australia Migratory Bird Agreement (ROKAMBA),
as it forms part of the East Asian-Australasian Flyway. Flatback Chelodina depressa, Olive Ridley Lepidochelys
olivacea and Green turtles Chelodina mydas are known to use Casuarina Beach and the waters of the
Reserve. These marine turtles are listed on the Bonn Convention for the Protection of Migratory Species of
Wild Animals and Marine and Migratory under the EPBC Act.
Buffalo Creek provides important aquatic habitat, known to contain two species of national and regional
significance, namely the Dwarf Sawfish (Pristis clavata) and the Green Sawfish (P .zijsron), listed as
Vulnerable under the EPBC Act; and Vulnerable by the NRETAS (Larson, et al., 2011; Aurecon 2013). Buffalo
Creek is also a known bird watching location, as one of the most important sites for migratory shorebirds in
the Darwin region. It is both an important feeding and roosting location with extensive sandy beach
connected to sandflats where thousands of shorebirds feed at low tide. Overall, Buffalo Creek has important
Aquatic Ecosystem value as it drains into Shoal Bay, which is listed by the NT Government as being of
International Significance.
3.4 Uses and Environmental Values
Environmental Values (EV) are those qualities of a waterway that make it suitable to support particularly
aquatic ecosystems and human uses, also known as beneficial uses. These are divided into a variety of
categories reflecting the types of human use (e.g recreational activities, boating, swimming etc.) while
aquatic ecosystem EVs are divided into condition classes reflecting the degree of modification from natural
conditions. These values can be categorised as high conservation/ecological value systems ‘HCV or HEV’ (e.g.
national parks, conservation reserves), slightly-moderately disturbed systems ‘SMD’ (e.g. minor changes but
are not considered so degraded as to be highly disturbed) and highly disturbed system ‘HD’ (e.g. degraded
systems with lower levels of naturalness) (NWQMS, 1998).
Darwin Harbour, between Charles Point and Lee Point, is managed to maintain aquatic ecosystem
protection, recreational water quality and aesthetics beneficial uses, as declared under section 73(1) of the
Water Act. The management of water resources in the Reserve is consistent with the declared beneficial
uses and the environmental values for Darwin Harbour and are therefore applicable to Sandy Creek (Table
1). The environmental values specific to the area of Sandy Creek would come under the slightly-moderately
disturbed systems.
Table 1 Sandy Creek – applied environmental values
Potential Comments
Environmental application to
Examples of use
values of water Sandy Creek
(Yes or No)
Maintenance of aquatic Sandy creek estuary mouth provide
ecosystems; Fish breeding and important habitat for migratory birds of
Aquatic ecosystems spawning; Biodiversity Yes international significance
conservation; Aquaculture; Eco-
tourism
Primary industry Irrigated agriculture; Aquaculture; No N/A
Human consumption of aquatic
Lee Point Master-planned Urban Development – Water Quality Monitoring Plan 11foods; Stock drinking water
Recreation and Fishing and Boating occurs. Used as a
Swimming; Recreational fishing;
aesthetics (primary Yes recreation area for bird watching also.
Boating; Visual amenity
and secondary)
Industrial water Washing; Cooling; Processing No N/A
Sacred sites; spiritual use; N/A
presence of certain plant and
Cultural and spiritual No
animal communities; traditional
use
Shoal Bay, between Lee Point and Gunn Point, is managed to maintain aquatic ecosystem protection,
recreational water quality and aesthetics beneficial uses, as declared under section 73(1) of the Water Act.
The management of water resources in the Reserve is consistent with the declared beneficial uses and the
environmental values for Shoal Bay and Darwin Harbour and are therefore applicable to Buffalo Creek (Table
2). The environmental values specific to the area of Buffalo Creek would come under the highly disturbed
systems.
Table 2 Buffalo creek – applied environmental values
Potential Comments
Environmental application to
Examples of use
values of water Buffalo Creek
(Yes or No)
Buffalo Creek provides an important
aquatic habitat for two fish species of
Maintenance of aquatic national and regional significance
ecosystems; Fish breeding and (Pristis clavata and P. Zijsron). Buffalo
Aquatic ecosystems spawning; Biodiversity Yes Creek discharges into Shoal Bay, which
conservation; Aquaculture; Eco- is listed as being of International
tourism Significance as well as provide
important habitat for migratory birds
listed of international significance
Irrigated agriculture; Aquaculture; N/A
Primary industry Human consumption of aquatic No
foods; Stock drinking water
Fishing does occur in the lower
Recreation and reaches.
Swimming; Recreational fishing;
aesthetics (primary Yes
Boating; Visual amenity Buffalo creek is a recreation area, and
and secondary)
is a known bird watching location.
Industrial water Washing; Cooling; Processing No N/A
There is a recorded sacred site, under
Sacred sites; spiritual use; the Northern Territory Sacred Sites Act
presence of certain plant and at Buffalo Creek.
Cultural and spiritual Yes
animal communities; traditional A World WWII observation post is
use situated at Buffalo Creek and is listed
on the Register of the National Estate.
Lee Point Master-planned Urban Development – Water Quality Monitoring Plan 124 POTENTIAL IMPACTS
The Project has the potential to alter local hydrology and water quality that may impact on the Casuarina
Coastal Reserve and both Buffalo and Sandy Creek estuary ecosystems abutting the Reserve. Potential
impacts may include but are not limited to the short-term direct effects from increased freshwater inputs to
the estuaries (e.g. increased runoff of poor water quality, altered flow), followed by spatial and/or temporal
changes in water quality (e.g. reduced light penetration, decrease in water temperature, alteration of mixing
zones). This can result in impacts for flora and fauna both within the estuaries themselves and along the
beach of the Casuarina foreshore and coastal reserve, containing protected migratory shorebird habitat.
Increased urbanisation and construction activities such as land clearing, earthworks, dewatering and
establishment of a stormwater drainage system, detention basin and discharge system has the potential to
increase sediment and nutrient loads entering both creeks and the reserve via runoff and discharge.
Construction works could also increase the potential for environmental incidents such as hydrocarbon and
chemical spills associated with the refuelling of plant and equipment or leakage from fuel storages which can
temporarily impact on the quality of receiving surface waters and sensitive receptors. The Engineering
Services report prepared by SMEC (2015) indicates that the design philosophy for drainage shall ensure that
downstream discharges are limited to existing flows.
The main areas of erosion risk have been determined as occurring in the south-west corner of the 2CRU site
in association with an existing overland flow path and along the existing low escarpment where steep slopes
are present. If erosion of soils were to occur this could cause siltation and reduction of water quality in Sandy
Creek with subsequent effects upon the connected shorebird habitat. To date, there is no known water
quality information for Sandy Creek.
The key contaminants of concern from construction activities and urbanisation include:
Hydrocarbons and other chemicals,
Heavy metals,
Nutrients; and
Sediments.
Urban development can impact on catchment hydrology and the deterioration of local water quality.
Construction activities can result in increased erosion and sedimentation issues and potential for spills, whilst
post-development can result in a multitude of pollutants from stormwater runoff being introduced to
aquatic ecosystems, including:
Toxicants (heavy metals, hydrocarbons, ammonia);
Nutrients (phosphorus, nitrogen, carbon);
Oxygen depleting substances (organic material, sulphides);
Physical contaminants (suspended solids);
Trace organic compounds (insecticides, herbicides, personal care products);
Lee Point Master-planned Urban Development – Water Quality Monitoring Plan 13 Gross pollutants (plastics products, cigarette butts, vegetation etc.); and,
Altered hydrology (e.g. water levels, frequency).
With respect to stormwater drainage, the Project has designed a pit and pipe stormwater system that will
extend along the road network, and will carry stormwater to a detention basin in the south-west corner of
2CRU (Figure 3). The detention basin will collect all post-development stormwater flow prior to discharge to
an existing drainage line through to Sandy Creek and Buffalo Creek estuary. During construction, erosion and
sediment control measures will be implemented to collect and direct runoff as per the ESCP.
Several drains from the neighbouring suburbs, the hospital precinct and Charles Darwin University currently
feed into the coastal reserve and into Sandy Creek. Whilst Buffalo Creek receives stormwater from drainage
directly upstream from two main tributaries as well as secondary effluent from the LSSTP. These pollution
point sources have the potential to create erosion, sedimentation or pollution issues upstream of the
Projects discharge location. It is noted that water quality issues that may occur upstream can have flow on
effects for downstream aquatic health and beneficial values as stated above.
Potential cumulative impacts may include:
Deteriorated water quality from additional stormwater discharge and runoff contaminant
contributions (e.g. increased sedimentation (suspended solids), high nutrient loads, bacteria, metals,
hydrocarbons etc.);
Altered hydrology (e.g. increased flow inputs);
Altered ecosystem processes and services;
Deterioration of habitat, shorebird feeding and roosting sites and food web dynamics;
Landform structural failure/erosion from increased flows at inappropriate times of year (i.e. dry
season) or lack of vegetation and protection;
Spread of pest species (flora and fauna); and
Increased mosquitoes/biting midge and breeding opportunities.
Lee Point Master-planned Urban Development – Water Quality Monitoring Plan 145 MONITORING PROGRAM
Water quality exhibits distinct differences between the wet and dry seasons in waterways and estuaries in
the northern tropics of Australia. High rainfall in the wet season produces large freshwater inflows with
associated nutrients, sediments and pathogens dispersed via high volumes of runoff resulting in poor water
clarity and deteriorated water quality.
This monitoring plan has been developed to obtain data for physico-chemical and some biological
parameters for monitoring the water quality within both the Sandy Creek and Buffalo Creek estuary, as well
as directly at the three discharge locations.
As per Section 5.3.4 of the EIS ToR Guidelines, the Stormwater Management Plan and ESCP outline details of
monitoring programs that would be implemented throughout the construction and post-construction phase.
This is to determine the effectiveness of the mitigation measures including the Stormwater Management
Plan and ESCP.
5.1 Monitoring Sites and Parameters
Water quality monitoring sites have been identified and defined based upon the two discharge locations
situated in the north-west and south-west corner of the 2CRU site, and single discharge location situated in
the south-east corner of the Muirhead site. Monitoring sites include a point source monitoring location at
the discharge locations as well as both upstream and downstream monitoring locations in the affected
creeks (Figure 3). A second monitoring point is included for the discharge location in the north-west of 2CRU
as stormwater does not discharge into a permanent water bodies.
At each monitoring location, measurements will be collected in situ using a multi-parameter water quality
meter and any other related instruments (e.g. turbidity meter, secchi disk) within the upper and lower water
column within 1 hr of the slack of both flood and ebb tides. All physico-chemical parameters as stated within
this plan will be recorded on a data sheet.
Baseline monitoring and sampling will be undertaken on a monthly basis at Sandy Creek for up to a period of
6 months prior to construction during the wet season and twice during the dry season (during neap spring
tides). This will assist in determining current water quality values to use for tentative baseline data. If there is
not sufficient baseline data collected prior to the commencement of construction, the project will revert to
the default guideline trigger values provided in Tables 3.3.4-3.3.5 for Tropical Australia for reporting
exceedances.
During construction, monitoring will continue at the same frequency (six times in wet season, twice in dry
season). After occupation, monitoring will continue until there is at least twelve months of monitoring data
with no exceedances recorded.
The monitoring field program will be undertaken before or after, but not during the slack of the tide (1 hr
either side of high or low tide). Monitoring will be undertaken for both flood and ebb tidal flows during both
the wet and dry seasons (if water is present). Prior to field deployment, staff will record recent rainfall
(within 24 hrs), tide type (flood or ebb), time of day and weather conditions. It is important to take into
Lee Point Master-planned Urban Development – Water Quality Monitoring Plan 15account tidal influence, time of day, stratification/mixing zones during monitoring as these can influence the
data collected and compared over time.
In situ monitoring parameters will include:
- Water level (m) of upper and lower column depth
- Flow measurements
- Total depth (m)
- Temperature (°C)
- pH
- Conductivity (EC) and Salinity
- Dissolved oxygen (DO) (% Saturation) and (mg/L)
- Chlorophyll a
- Turbidity (NTU)
- Light penetration using Secchi disk
Sampling parameters for the Laboratory program include:
- The In situ measurements
- Total Suspended Solids (TSS)
- Total nutrients (TN and TP), ammonia, nitrite and nitrate
- Biochemical oxygen demand (BOD)
- Bacteria – microbiological indicators
- Total and Filtered dissolved metals
Grab samples will be taken from the middle of the water column and sent off to a NATA certified laboratory.
Water quality monitoring can be used as an indicator of the environmental values likely to be supported by a
system and in turn can indicate how much change is acceptable to maintain those values. This will also assist
in defining Water Quality Objectives (WQOs) and site-specific guideline trigger values, where required (i.e.
Sandy Creek). All data recorded on site and received from the laboratory will be maintained in a Project
Database.
5.2 Quality assurance and quality control
Quality assurance and quality control (QA/QC) measures are a set of operating and sampling procedures
carried out by the monitoring team that help to ensure that calibration, sampling techniques, storage,
transport and analysis of samples are consistent. This is to ensure there is minimal variation in results due to
incorrect procedures or contamination (e.g. handling error). The QA/QC results will be uploaded and stored
in the Projects database and compared to the results from a reference site for each monitoring date.
Lee Point Master-planned Urban Development – Water Quality Monitoring Plan 165.2.1 Instrument calibration
Instrument calibration and records of calibration will be maintained prior to each monitoring session. Staff
must follow the instructions of the instrument manufacturer to calibrate instruments. The likely range of
values being measured are to be noted and calibrate accordingly. The instrument will perform better if it is
calibrated for the data ranges expected in the field, which will be obtained during the pre-construction
monitoring period.
5.2.2 Sampling technique
The NATA certified laboratory engaged for the Project, will provide specific instructions to follow when
sampling as well as a Chain of Custody (CoC). Duplicate, field and trip blank samples will be taken at a
nominated sampling site allowing results to be compared and any inconsistencies identified.
5.2.3 Storage and Transport
Collection and storage of samples will be discussed with the laboratory to ensure adequate volumes are
collected, storage is appropriate and adequate field and laboratory QA/QC procedures are in place.
Lee Point Master-planned Urban Development – Water Quality Monitoring Plan 176 WATER QUALITY MANAGEMENT
The mitigation and management measures to be implemented during construction will be included within
the ESCP and CEMP and align with best practice measures. All water affected by sediment or stormwater
originating from site will be treated via the detention system designed in the Stormwater Management Plans
and released in conjunction with existing flows. Water quality management triggers can be specified using a
three tier hierarchy management response when an exceedance from the ANZECC guideline trigger values
(or tentative baseline values) is detected, including:
Level 1: Identify, investigate and continue to monitor;
Level 2: No change in condition, prepare to stop works and continue to monitor or investigate
further; and.
Level 3: Condition deteriorating and impacting sites of significance, act and manage accordingly.
The monitoring plan includes a reporting framework to ensure timely notification of water quality results and
any identified exceedances and non-compliances of the monitoring plan. Reports will be provided to both
the DHA and the relevant authorities until the relaxation of management measures as a response to
recovery of the water quality.
In accordance with ToR, DHA has made a strong commitment to implementing the WQMP until the water
quality returns within range of the ANZECC guideline trigger values (or the tentative baseline values, if
appropriate). This can be summarised as part of an annual report including an assessment of all monitoring
data collected as part of the WQMP and all exceedances and management actions implemented over the
duration of the monitoring period.
In addition, the Area Plan within the Master Plan shows an area of 21.8 ha that will be zoned Conservation
(CN) as part of the planning application. This area of land will be transferred to the Northern Territory
Government to become part of the Casuarina Coastal Reserve. It is intended that excluding this land from
development will assist in avoiding impacts to the sensitive Monsoon Vine-thicket vegetation and provide a
buffer to potential storm surge inundation and biting insect breeding areas.
6.1 Water Quality Trigger Values
Water quality trigger values for all indicators will be determined by taking into account the level of
protection (high, moderate or low as a result from its level of disturbance). For physical and chemical
stressors and toxicants in water, the approach to deriving trigger values follows the following order:
Use of biological effects data;
Then local reference data (mainly physical and chemical stressors); and
Finally (least preferred) the tables of default values provided in the ANZECC Guidelines.
When using local reference data (baseline) for physical and chemical stressors, ANZECC guidelines
recommend using 3 years of data or 3-5 reference sites, from which you would determine upper (80th
percentile) and lower limits (20th percentile) for upstream and downstream sites to derive a range of values.
This would incorporate spatial and temporal variations (e.g. wet/dry seasons), to create site-specific
Lee Point Master-planned Urban Development – Water Quality Monitoring Plan 18guideline trigger values that incorporates natural variability of the area. For Sandy creek estuary however
there is approximately 6 months remaining over the wet season prior to construction commencing on site.
Sandy creek is also already potentially influenced by runoff from urban and industrial areas that may
potentially discharge into the upper reaches of the creek (e.g. Royal Darwin Hospital and existing
urban/commercial developments).
As such, the collection of baseline data is unlikely to be attainable in accordance with ANZECC guidelines;
nonetheless, pre-construction monitoring will occur and commence in late 2017. All data collected will be
used to define the WQOs for Sandy Creek, as the derived data would be more accurate of local conditions
than deferring to the ANZECC guidelines. For monitoring periods when baseline data could not be obtained,
data will be compared against For Sandy Creek estuary refer to Table 3.3.4-3.3.5 in the ANZECC Guidelines
for tropical Australia for slightly to moderately disturbed ecosystems (Table 3).
Buffalo creek has been regularly monitored and reported on by the NT Government and the Power and
Water Corporation. In addition, pre-construction monitoring of Buffalo Creek will commence in late 2017.
Given the proposed staging plan envisages construction in Muirhead North would not commence until April
2019 (see Table 3 in the EIS/PER), it is possible that a full twelve months of monitoring data could be
collected before any run-off from the site reaches Buffalo Creek.
In the event that pre-construction monitoring cannot be completed over a full year period, than WQOs and
trigger values for Buffalo Creeks will be extrapolated from NT Government and Power and Water
Corporation data. Monitoring at the discharge location before entering Buffalo Creek will be compared
against the ANZECC values for tropical Australia for slightly to moderately disturbed ecosystems (Table 3).
As the second discharge location in 2CRU does not discharge into a creek or water body, pre-construction
monitoring will not be undertaken. Rather, the trigger values from ANZECC guidelines for tropical Australia
for slightly to moderately disturbed ecosystems will be adopted (Table 3).
Prior to the commencement of construction, DHA will notify the NT EPA and DoEE in writing of the WQOs
and trigger values which will be use to compare the post-construction monitoring data for Sandy Creek and
Buffalo Creek against.
Table 3 ANZECC values for tropical Australia for slightly to moderately disturbed ecosystems
DO DO
+ pH pH Turb
Type Chl a TP FRP TN NOx NH4 %Sat %Sat
Lower Upper NTU
Lower Upper
Estuaries 2 20 5 250 30 15 80 120 7.0 8.5 1-20
6.2 Reporting
Water quality data collected including both field and laboratory results will be presented in a table and graph
format and interpreted against the baseline values and ANZECC Guideline trigger values as part of an annual
report. This report will contain other information as collected in the field, including weather and tidal
information, limits of reporting (LOR) and measures of uncertainty, any calculations and any results that
exceed the trigger values as well as a comparison against a summary of the previous month’s results.
The annual report will be made available to the NT EPA and DoEE.
Lee Point Master-planned Urban Development – Water Quality Monitoring Plan 19All monitoring reports will be been prepared with reference to the NT EPA’s Guideline for the Reporting on
Environmental Monitoring (NT EPA 2016) and the ANZECC Australian Guidelines for Water Quality
Monitoring and Reporting (ANZECC & ARMCANZ 2000b).
In the event of any exceedance, a report will be prepared and submitted to NT EPA and DoEE within one
week of DHA becoming aware of the exceedance.
Lee Point Master-planned Urban Development – Water Quality Monitoring Plan 206.3 Contingency
Contingency measures have been developed in case of the following events which have potential to
adversely affect water quality:
Adverse weather (i.e. cyclone or severe storm causing overflow, abnormal erosion and
sedimentation issues)
Human error / accidental spills
In effective stormwater treatment.
6.3.1 Adverse weather
Even with properly installed erosion and sedimentation control measures, overflow and higher than normal
runoff events could occur as a result of unexpected extreme weather events (i.e cyclone, severe storm). This
could result in collapse of silt fencing, overflow or bypass of barriers and detention basins, slope failures, and
other problems which could lead to higher than expected sedimentation flowing into the creeks. If
sedimentation occurs, immediate action will be taken to temporarily contain the sediment as quickly as
practical. When site conditions allow, permanent protection measures will be installed on affected and
potentially vulnerable surfaces. If the erosion and sedimentation resulted from a construction-related
activity, the activity will cease immediately until management have rectified the situation and water quality
recovers to guideline values.
6.3.2 Human error / accidental spills
During construction, an accidental spill of fluids may occur, of which the impact of the spill will depend upon
the magnitude and extent, and the environmental and socio-economic conditions in which it takes place.
Upon accidental release of any hydrocarbon-based construction fluid, DHA in conjunction with the site
contractor will immediately determine the magnitude and extent of the spill and immediately take measures
to contain it. Release of sediment will also be treated as a potential spill depending on the magnitude and
extent. Spills will be immediately reported to the head contractor.
Spill containment equipment will be readily available, especially near watercourses such as Sandy creek and
Buffalo creek. Personnel will be trained in the use of spill containment equipment.
6.3.3 Ineffective stormwater treatment
Stormwater Management Plans have been developed for the project, and have been designed to comply
with relevant Guidelines for treatment of stormwater. Testing of the Stormwater Management Plans show
they would adequately remove sufficient quantities of Total Suspended Solids, Total Nitrogen, Total
Phosphorous and Gross Pollutants. In the event that exceedances of water quality are detected, ineffective
stormwater treatment will be considered (provided all other reasonable factors have been ruled out).
As part of the monitoring and reporting program (see Section 6.2), any detected exceedances will include a
review of the effectiveness of stormwater treatment. In consultation with a hydrologist, the following
changes to the stormwater treatment may be required:
Bioretention/Detention Basin size.
Lee Point Master-planned Urban Development – Water Quality Monitoring Plan 21 Replace Ecosol Net Guards.
Construct additional WSUD treatments such as bioswales and rain gardens.
Lee Point Master-planned Urban Development – Water Quality Monitoring Plan 227 REFERENCES
ANZECC & ARMCANZ (2000a). Australian and New Zealand Guidelines for Fresh and Marine Water Quality.
National Water Quality Management Strategy Paper No. 4, Australian and New Zealand Environment and
Conservation Council & Agriculture and Resource Management Council of Australia and New Zealand,
Canberra ACT.
ANZECC & ARMCANZ (2000b). Australian Guidelines for Water Quality Monitoring and Reporting. National
Water Quality Management Strategy Paper No. 7, Australian and New Zealand Environment and
Conservation Council & Agriculture and Resource Management Council of Australia and New Zealand,
Canberra ACT
Aurecon 2013. Buffalo Creek Water Quality Improvement Plan, Project: Muirhead Residential Development.
Reference: 38110. Prepared for the Defence Housing Australia, Revision 0. 25 January 2013
Australian Heritage Database. Darwin Foreshores, Darwin NT, Australia – Register of the National Estate.
Place ID 16107.
Bureau of Meteorology (2017). Climate statistics for Australian locations; Darwin Airport. Viewed 26 May
2017 online:http://www.bom.gov.au.
Chatto R. (2003). The distribution and status of shorebirds around the coast and coastal wetlands of the
Northern Territory. Technical Report 73. Parks and Wildlife Commission of the Northern Territory, Northern
Territory Government, Darwin.
DLRM (2013) Darwin Harbour Region Report Card 2013 [Report]. - Palmerston, NT, Australia: Department of
Land Resource Management., 2013. Online:
https://denr.nt.gov.au/__data/assets/pdf_file/0010/254755/Darwin-Harbour-Report-Card-A4-March-
2014_13.3.14_online.pdf.
DLRM (2014) Darwin Harbour Region Report Card 2014 [Report]. - Palmerston, NT, Australia: Department of
Land Resource Management., 2014. Online:
https://denr.nt.gov.au/__data/assets/pdf_file/0006/397509/Darwin-Harbour-Report-Card-A4-Feb-19.pdf
DLRM (2015) Darwin Harbour Region Report Card 2015 [Report]. - Palmerston, NT, Australia: Department of
Land Resource Management., 2015. Online:
https://denr.nt.gov.au/__data/assets/pdf_file/0020/262127/darwin-harbour-region-report-card-2015.pdf
DENR (2016) Darwin Harbour Region Report Card 2016 [Report]. - Palmerston, NT, Australia: Department of
Environment and Natural Resources., 2015. Online:
https://denr.nt.gov.au/__data/assets/pdf_file/0010/397108/Darwin-Harbour-Report-Card-
2016_V2_lowres.pdf
Haese R R., and Smith J. (2009). The role of sediments in nutrient cycling in the tidal creeks of Darwin
Harbour [Journal] // Geoscience Australia, AusGeo News. - 2009. - 95.
Harrison L., McGuire L., Ward S., Fisher A., Pavey C., Fegan M. and Lynch B. (2009). An inventory of sites of
international and national significance for biodiversity values in the Northern Territory. Department of
Natural Resources, Environment, The Arts and Sport, Northern Territory Government.
Lee Point Master-planned Urban Development – Water Quality Monitoring Plan 23Fortune, J (2015). Supplement to the 2014 Darwin Harbour Region Report Card. Report No. 01/2015D.
Aquatic Health Unit, Department of Land Resource Management. Palmerston, NT. Website:
www.nt.gov.au/lrm/water/aquatic/index.html (Online:
https://denr.nt.gov.au/__data/assets/pdf_file/0007/397510/RC-supp-2014.pdf)
Fortune, J and Patterson, R (2016). Darwin Harbour Region 2015 Report Card Water Quality Supplement.
Report No. 4/2016D. Aquatic Health Unit, Department of Land Resource Management. Palmerston, NT.
Website: http://www.lrm.nt.gov.au/water/darwin-harbour/reportcards (Online:
https://denr.nt.gov.au/__data/assets/pdf_file/0003/262128/darwin-harbour-water-quality-supplement.pdf)
Fortune, J. (2016). Darwin Harbour Region 2016 Report Card Water Quality Supplement. Report No.
22/2016D. Aquatic Health Unit, Department of Environment and Natural Resources. Palmerston, NT.
Website: http://www.denr.nt.gov.au/water/darwin-harbour/reportcards (Online:
https://denr.nt.gov.au/__data/assets/pdf_file/0011/397109/WQ-Supp-2016_V0.pdf)
Mauraud, N. (2013): Darwin Harbour Water Quality: Supplement to the 2013 Darwin Harbour Region Report
Card. Report No 12/2013D. Aquatic Health Unit, Department of Land Resource Management, Northern
Territory Government.
NRETAS (2009) Shoal Bay and Buffalo Creek Report Card 2009 [Report]. - Palmerston, NT, Australia:
Department of Natural Resources, Environment, The Arts and Sport., 2009. Online:
https://denr.nt.gov.au/__data/assets/pdf_file/0007/254725/shoalbay_buffalocreek.pdf
NRETAS (2010) Shoal Bay and Buffalo Creek Report Card 2010 [Report]. - Palmerston, NT, Australia:
Department of Natural Resources, Environment, The Arts and Sport, 2010. Online:
https://denr.nt.gov.au/__data/assets/pdf_file/0009/254736/reportcard_shoal_bay_buff_ck.pdf
NRETAS (2011) Shoal Bay and Buffalo Creek Report Card 2011 [Report]. - Palmerston, NT, Australia:
Department of Natural Resources, Environment, The Arts and Sport., 2011. Online:
https://denr.nt.gov.au/__data/assets/pdf_file/0003/254748/Shoal-Bay-and-Buffalo-Creek.pdf
NRETAS (2012) Shoal Bay and Howard Creek Report Card 2012 [Report]. - Palmerston, NT, Australia:
Department of Natural Resources, Environment, The Arts and Sport., 2012. Online:
https://denr.nt.gov.au/__data/assets/pdf_file/0011/254765/2012-11-shoal-bay-report-card.pdf
NRETAS (2007) Sites of Conservation Significance in the NT [Online] // Natural Resources, Environment, The
Arts and Sport. - 2007. – Accessed Online: July 2017.
NRETAS (2010) Water Quality Objectives for the Darwin Harbout Region - Background Document [Report]. -
Darwin : Northern Territory Government, 2010.
NT EPA (2016). Northern Territory Environment Protection Authority Guideline for the Reporting on
Environmental Monitoring. May 2016. Version 1.0
Parks and Wildlife (2016) Casuarina Coastal Reserve Management Plan, April 2016. Parks and Wildlife
Commission of the Northern Territory
Skinner, L., Townsend, S., and Fortune, J. (2009). The impact of urban land-use on total pollutant loads
entering Darwin Harbour. Department of Natural
Lee Point Master-planned Urban Development – Water Quality Monitoring Plan 24FIGURES
Lee Point Master-planned Urban Development – Water Quality Monitoring Plan 25Legend
Project area
Localities
Local Government Areas
Lee Point
Figure 1
Darwin (C)
Location of project area
Environmental Impact
Statement water quality
monitoring plan, Lee Point,
Northern Territory
¹ 0 900
Metres
Map Scale: 1:50,000
1,800
Coordinate System: MGA Zone 52 (GDA94)
Service Layer Credits: Sources: Esri, HERE, DeLorme, TomTom, Intermap, increment P Corp.,
Darwin GEBCO, USGS, FAO, NPS, NRCAN, GeoBase, IGN, Kadaster NL, Ordnance Survey, Esri Base data sourced from data.gov.au. Used under Creative
Commons licences 3.0 and 4.0. Date 25/05/2017.
Japan, METI, Esri China (Hong Kong), swisstopo, MapmyIndia, © OpenStreetMap Project area derived from client provided information.
contributors, and the GIS User Community Ecology and Heritage Partners makes effort to ensure maps
Esri, HERE, DeLorme, MapmyIndia, © OpenStreetMap contributors, and the GIS user are free of errors. However, it does not warrant the map and
features are spatially or temporally accurrate or fit for a
particular use.
7793_Fig01_Location 25/05/2017 melsleyAerial source: Nearmap 2017
Legend
Area Zoned Conservation
Proposed development areas
2CRU
Muirhead North
Catchments
Buffalo Creek
Sandy Creek
Waterways / assumed
drainage lines
Buffalo Creek
k
ree
yC
nd
Sa
Figure 2
Royal Darwin Site location and surface
Hospital water sensitive receptors
Environmental Impact
Statement water quality
monitoring plan, Lee Point,
Northern Territory
LSSTP
¹ 0 400
Metres
Map Scale: 1:24,000
800
Coordinate System: MGA Zone 52 (GDA94)
Base data sourced from data.gov.au. Used under Creative
Commons licences 3.0 and 4.0. Date 25/05/2017.
Project area derived from client provided information.
Ecology and Heritage Partners makes effort to ensure maps
are free of errors. However, it does not warrant the map and
features are spatially or temporally accurrate or fit for a
particular use.
7793_Fig02_SiteLoc_SurfWater 5/10/2017 melsleyAerial source: Nearmap 2017
Legend
G
F Monitoring point
Area Zoned Conservation
Detention basin
Dam
Waterway
Sandy North 2 Assumed drainage lines
G
F Proposed development areas
Sandy North 1 2CRU
G
F Muirhead North
Sandy Creek 4
G
F
Buffalo Creek
ek
re
Buffalo Ck 4
yC
G
F
nd
Sa
Sandy Creek 3
G
F
Sandy Creek 1 G
F Buffalo Ck 2
F Buffalo Ck 1
Figure 3
G G
F
Buffalo Ck 3
G
F Surface monitoring
locations
Environmental Impact
Statement water quality
monitoring plan, Lee Point,
Royal Darwin Northern Territory
Hospital
Sandy Creek 2
¹ 0 250
Metres
Map Scale: 1:18,000
500
G
F Coordinate System: MGA Zone 52 (GDA94)
Base data sourced from data.gov.au. Used under Creative
LSSTP Commons licences 3.0 and 4.0. Date 25/05/2017.
Project area derived from client provided information.
Ecology and Heritage Partners makes effort to ensure maps
are free of errors. However, it does not warrant the map and
features are spatially or temporally accurrate or fit for a
particular use.
7793_Fig03_MonLoc 13/10/2017 melsleyYou can also read