LIFE CYCLE ASSESSMENT OF TECHNICAL BUILDING SERVICES OF LARGE RESIDENTIAL BUILDING STOCKS USING SEMANTIC 3D CITY MODELS
←
→
Page content transcription
If your browser does not render page correctly, please read the page content below
ISPRS Annals of the Photogrammetry, Remote Sensing and Spatial Information Sciences, Volume VI-4/W1-2020, 2020
               3rd BIM/GIS Integration Workshop and 15th 3D GeoInfo Conference, 7–11 September 2020, London, UK

       LIFE CYCLE ASSESSMENT OF TECHNICAL BUILDING SERVICES OF LARGE
         RESIDENTIAL BUILDING STOCKS USING SEMANTIC 3D CITY MODELS

                                          H. Harter1, ∗, B. Willenborg2 , W. Lang1 , T. H. Kolbe2
                                  1
                                  Institute of Energy Efficient and Sustainable Design and Building,
              Technical University of Munich (TUM), Munich, Germany - (hannes.harter, sekretariat.enpb.bgu)@tum.de
    2
      Chair of Geoinformatics, Technical University of Munich (TUM), Munich, Germany - (b.willenborg, thomas.kolbe)@tum.de

                                                      Commission VI, WG VI/4

KEY WORDS: Life Cycle Assessment (LCA), Technical Building Services, Energy Demand Calculation, Sustainable Building,
Sustainable City Development, Semantic 3D City Models, CityGML, Urban Simulation

ABSTRACT:

Reducing the demand for non-renewable resources and the resulting environmental impact is an objective of sustainable develop-
ment, to which buildings contribute significantly. In order to realize the goal of reaching a climate-neutral building stock, it must
first be analyzed and evaluated in order to develop optimization strategies. The life cycle based consideration and assessment of
buildings plays a key role in this process. Approaches and tools already exist for this purpose, but they mainly take the operational
energy demand of buildings and not a life cycle based approach into account, especially when assessing technical building services
(TBS). Therefore, this paper presents and applies a methodical approach for the life cycle based assessment of the TBS of large
residential building stocks, based on semantic 3D city models (CityGML). The methodical approach developed for this purpose
describes the procedure for calculating the operational energy demand (already validated) and the heating load of the building,
the dimensioning of the TBS components and the calculation of the life cycle assessment. The application of the methodology is
illustrated in a case study with over 115,000 residential buildings from Munich, Germany. The study shows that the methodology
calculates reliable results and that a significant reduction of the life cycle based energy demand can be achieved by refurbishment
measures/scenarios. Nevertheless, the goal of achieving a climate-neutral building stock is a challenge from a life cycle perspective.

                      1. INTRODUCTION                                  TBS (but with lower output from the heat generators), or to
                                                                       the trend towards reducing building automation and lowering
Worldwide, buildings and construction account for about 35%            energy consumption through the use of more passive building
of final energy consumption and are responsible for almost 40%         measures (orientation of buildings, natural ventilation, indoor
of energy related carbon dioxide (CO2 ) emissions. Buildings           light control). In both cases this leads to more material re-
thus account for 30% (22% residential buildings) of global fi-         sources beeing needed to fulfill the task of increasing energy
nal energy consumption and 28% (17% residential buildings)             efficiency and decreasing CO2 -emissions in the buildings use
of global energy-related CO2 -emissions by sector (UN Envir-           stage. Thus, it can happen that for buildings, that have a very
onment and IAE, 2017).                                                 low energy consumption in the use stage, it is no longer the
These numbers clearly indicate the urgent need to cut down en-         energy consumption in this stage that accounts for the largest
ergy consumption and CO2 -emissions of the worldwide build-            share over the entire life cycle, but rather the life cycle phases
ing stock. For that reason, the European Union has set the goal        before and after the use of the building (Cabeza et al., 2014).
to achieve a climate-neutral building stock in its 2050 long-term      Consequently, when talking about sustainable building or city
strategy (EU Commission, 2018). However, it must be kept in            development, the ecological and energetic performance of
mind, that these numbers and goals generally only reflect the          buildings must be evaluated and analyzed over the whole life
energy consumption and CO2 -emissions related to the opera-            cycle. For this purpose, Life Cycle Assessment (LCA) meth-
tion of buildings. All energy consumptions and CO2 -emissions          ods can be used. However, the implementation of LCA has not
resulting from life cycle stages before and after the building’s       yet been made mandatory in legislation at neither the European
use stage are generally not taken into account.                        nor German national level. For this reason, a LCA for buildings
                                                                       is very rarely calculated in practice and is hardly included in
With tightening regulations concerning the reduction of build-         the decision-making process of building planning. In addition,
ing energy consumption, e. g. the Energy Performance of                even if LCAs are performed for buildings, in most cases this
Building Directive (EU Commission, 2018) on the European               is only done on the basis of a single building considering only
level, or the Energy Saving Ordinance (EnEV) (German Fed-              the building construction, without consideration of the technical
eral Ministry of EAE, 2013) on the German national level, min-         building services (TBS). As life cycle based analysis allows for
imum energy efficiency standards for (non-)residential build-          the identification of savings potentials and to support political
ings are defined. The introduction of these regulations led to a       decision making regarding regulations, it is important to calcu-
decrease in energy consumption during the use stage of build-          late LCAs for large building stocks.
ings. However, the decreasing energy consumption in the use            This study presents a methodological approach for an auto-
stage is related, for example, to an increasing use of insula-         mated calculation of life cycle based energy assessment of TBS
tion materials and efficient, more complex components of the           of large residential building stocks based on semantic 3D city
∗   Corresponding author                                               models according to the CityGML standard.

           This contribution has been peer-reviewed. The double-blind peer-review was conducted on the basis of the full paper.
                     https://doi.org/10.5194/isprs-annals-VI-4-W1-2020-85-2020 | © Authors 2020. CC BY 4.0 License.                   85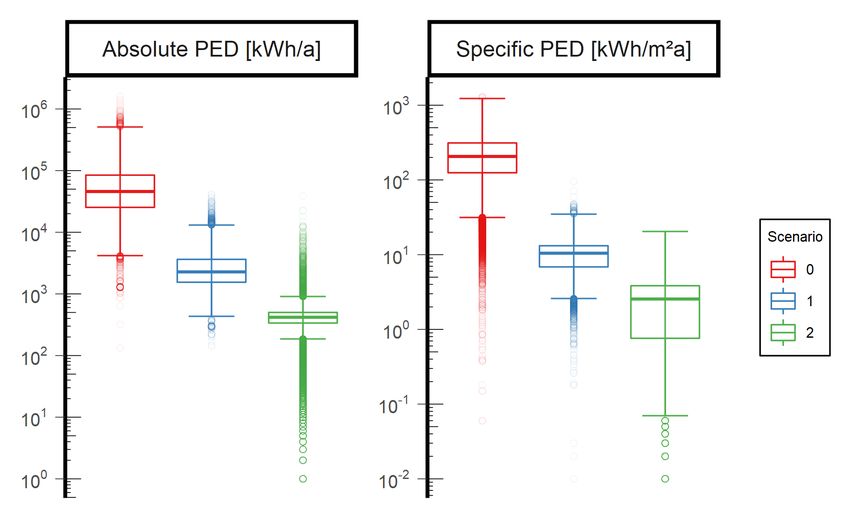
ISPRS Annals of the Photogrammetry, Remote Sensing and Spatial Information Sciences, Volume VI-4/W1-2020, 2020
             3rd BIM/GIS Integration Workshop and 15th 3D GeoInfo Conference, 7–11 September 2020, London, UK

1.1   Related work                                                   are evaluated using rather small data sets that only contain a few
                                                                     buildings. Bigger studies with several thousands of buildings or
The use of semantic 3D city models for energetic considera-          even at the city scale are rare.
tions and assessment of the building stock is an active field of
research. Several projects are based on the EnergyADE, an ex-
                                                                                  2. THEORETICAL BACKGROUND
tension of the CityGML standard for urban energy modeling
and simulation (Nouvel et al., 2015a).                               The method introduced in this work is based on a series of
In his PhD thesis Kaden developed EnEV-compliant methods             standards and existing tools, which are briefly listed in the fol-
(German Federal Ministry of EAE, 2013) for the estimation of         lowing sections.
the heat demand and saving potentials by refurbishing as well
as for the estimation of electricity and warm water demand of        2.1    Standards and tools for building energy and LCA
residential buildings, based on the Energy Atlas of the City of
Berlin. The input and energy demand values were modeled ac-          The methodical approach for calculating the energy demand,
cording to the EnergyADE (Kaden, 2014). In 2018, the work            heating load and dimensioning of TBS components is based
of Kaden was re-implemented using the software FME by Safe           on the standards and norms listed in the following reference.
Software resulting in a fully automated workflow for building        In the Method section, the associated standards and norms are
energy demand estimation. Moreover, a solar potential analysis       listed again for each defined calculation step (DIN EN ISO
tool was included to improve the energy demand estimation            14040:2009-11, 2009, German Federal Ministry of EAE, 2013,
with more realistic solar energy estimations that include local      DIN EN 15978:2012-10, 2012, DIN V 4108-6:2003-06, 2003,
climate conditions and the surrounding 3D topography (Fuchs,         DIN V 4701-10:2003-08, 2003, DIN EN 12831-1:2017-09,
2018, Willenborg et al., 2017).                                      2017, DIN V 18599-5:2018-09, 2018, DIN V 18599-8:2018-
Another example based on CityGML’s EnergyADE is the urban            09, 2018). For the LCA calculation the Ökobaudat database is
energy simulation platform SimStadt. It offers a highly modu-        used. With the Ökobaudat platform , the German Federal Min-
lar and flexible workflow-driven architecture. Its first version     istry of the Interior, Building and Community provides stake-
contained workflows for solar and PV potential analysis, en-         holders with a standardised database for the LCA of buildings.
ergy demand and CO2 emission calculation, and refurbishment          At the centre of the platform is the online database with LCA
scenario generation and simulation (Nouvel et al., 2015b).           data sets on building materials, construction, transport, energy
At Ecole Polytechnique Fédérale de Lausanne (EPFL) a build-        and disposal processes. This database is used for all LCA re-
ing energy simulation database using CityGML EnergyADE               lated calculations in this study (Federal Ministry of IBC, 2020).
was developed, including the integration of outdoor human            2.2    Semantic 3D City Models
comfort, urban micro-climate and its impact on human activit-
ies and well-being (Coccolo et al., 2016, Walter, Kämpf, 2015).     Semantic 3D city models describe the spatial, visual, and them-
Another approach offering dynamic simulation of the heat de-         atic aspects of the most common objects of cities and land-
mand using the simulation framework Modelica was presented           scapes. The real world objects are decomposed and classified
at RWTH Aachen. CityGML data of more than 2,800 buildings            according to a semantic data model, that represents them in an
were enriched with statistical data and then converted to a Mod-     ontological structure by thematic classes with attributes includ-
elica model for the simulation (Remmen et al., 2016).                ing their aggregations and interrelations. CityGML is an inter-
One of the few tools which offer simulations on city-scale is        national standard by the Open Geospatial Consortium (OGC)
City Building Energy Saver (CityBES), a web-based data and           and an open data model and encoding specification for repres-
computing platform, focusing on energy modeling and analysis         enting and exchanging semantic 3D city models (Kolbe, 2009,
of a city’s building stock. CityBES uses CityGML to repres-          Open Geospatial Consortium, 2012).
ent and exchange 3D city models and employs EnergyPlus to            Today, CityGML is widely adopted and offers a good variety
simulate building energy use and savings from energy efficient       of tools to edit, analyze and visualize 3D city model data, that
retrofits (Chen et al., 2017).                                       increasingly becomes available, in many cases as open data. A
The Urban Modeling Interface (UMI) (Reinhart et al., 2013),          study from 2015 identified more than 29 use cases including
developed at the Massachusetts Institute of Technology, is one       more than 100 applications of 3D city models (Biljecki et al.,
of the few tools that can perform analyses at the city and neigh-    2015). The method and implementation introduced in the fol-
borhood level, using a life cycle-based approach. However, the       lowing is based on citygml4j1 , an open source library reflecting
LCA does not go into detail about the TBS.                           the CityGML data model to the programming language Java.
                                                                     Moreover, the SharedWallSurface calculator developed by Sin-
1.2   Distinction from other work                                    dram for Kaden (Kaden, 2014) and the Voluminator 2.0 (Sin-
                                                                     dram et al., 2016) are integrated for shared wall surface and
The existing tools and models are mainly specialized in calcu-
                                                                     building volume calculation. For creating 3D browser visual-
lating the energy demand during the building’s use stage on the
                                                                     izations of the city model data and the method results the open
building block or city quarter level. Approaches for LCA do ex-
                                                                     source tool chain of the 3D City Database, the 3D City DB Im-
ist, but only with the help of a large number of building specific
                                                                     porter/Exporter and the 3D City DB Web-Map-Client is applied
input parameters for the assessment, which make extrapolation
                                                                     (Yao et al., 2018).
to large existing building stocks difficult. Furthermore, none of
these tools allow for the important life cycle based assessment
of TBS. As described above, semantic 3D city models are used                                     3. METHOD
for urban energy simulations in different ways. Many applica-
tions use the city model data as an input for existing tools based   The presented method allows the life cycle based energy and
on Modelica or Energy Plus. However, only a few approaches           environmental assessment of the TBS of large residential build-
use the city model as a data integration platform and export the     ing stocks. A life cycle based energy and environmental assess-
simulation results back to the model, which offers various be-       ment means, in the scope of this study, that the energy demand
nefits that will be discussed later. Moreover, most applications     1   https://www.3dcitydb.org/3dcitydb/citygml4j/

         This contribution has been peer-reviewed. The double-blind peer-review was conducted on the basis of the full paper.
                   https://doi.org/10.5194/isprs-annals-VI-4-W1-2020-85-2020 | © Authors 2020. CC BY 4.0 License.                   86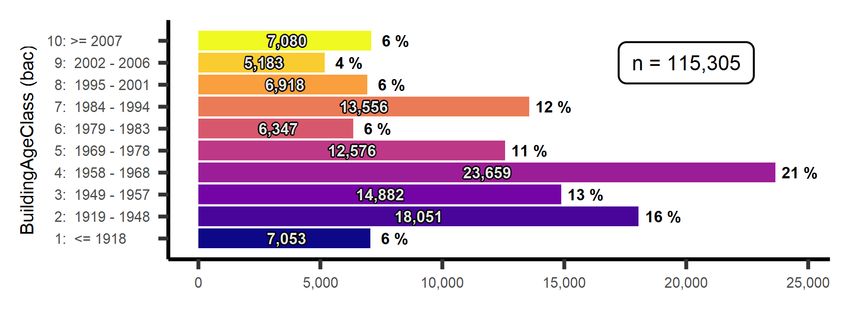
ISPRS Annals of the Photogrammetry, Remote Sensing and Spatial Information Sciences, Volume VI-4/W1-2020, 2020
             3rd BIM/GIS Integration Workshop and 15th 3D GeoInfo Conference, 7–11 September 2020, London, UK

and emissions of the manufacturing (A1-A3), use (B4 & B6)              ing stock are heated with gas boilers and 20% with oil boil-
and end-of-life (EOL) (C2 & C4) stages, according to DIN EN            ers, then exactly this percentage distribution of energy systems
15978 (DIN EN 15978:2012-10, 2012) of the TBS compon-                  is used for all calculations at building level. Similarly, the re-
ents are calculated and considered for the assessment. These           spective primary energy factors (PEF) are used to calculate the
LCA stages have been selected based on the data available in           primary energy demand (PED).
the Ökobaudat database, because consistent data is available          9) To distribute the refurbishment of all considered residential
for all selected LCA stages across all TBS components con-             buildings over the period of the refurbishment scenario, a se-
sidered. The calculation of further LCA stages can be carried          quence of refurbishment is defined. The sequence results from a
out analogously to the methodology described here, insofar as          three-dimensional decision space between the building’s year of
consistent data is available for the new LCA stage for all TBS         construction, specific primary energy heating demand and ab-
components. The implementation of the LCA is based on the              solute primary energy heating demand. The sequence is based
principles defined in DIN 14040 (DIN EN ISO 14040:2009-11,             on the fact that the oldest buildings with the highest specific and
2009). To achieve this, a methodological approach based on a           absolute heating requirement are refurbished first and are then
few input data and definitions was developed. In the following,        graded in a similar way. In addition, the total number of build-
the main steps of the method and related standards are briefly         ings to be refurbished is divided by the development period to
described. The methodology was implemented in Java to cre-             obtain the number of buildings to be refurbished per year.
ate a usable tool. We named our developed tool urbi+ (urban            10) The PEF required to calculate the PED can be adjusted over
improvement +) and use this name for further explanations in           the development period. The PEF does not change abruptly
the text. In the calculation of large residential building stocks      in the course of a building refurbishment, but adapts gradually
all energy demand, heating load and LCA calculations are car-          over time by calculating the difference between the old and new
ried out iteratively for each defined scenario for each residential    PEF, distributed over the entire period.
building to be considered. In turn, this means that theoretically      11) When calculating the LCA of the TBS, the buildings that
the life cycle based energy and environmental assessment of in-        were refurbished first during the refurbishment period may re-
dividual buildings can also be carried out using this method.          quire further replacement of components within the develop-
                                                                       ment period. If, for example, a reference service life (RSL)
3.1   Assumptions                                                      of 15 years is assumed for an instantaneous water heater, then
                                                                       in year 16 of the development period, the water heaters of the
Before the individual methodological steps are explained, the          buildings refurbished in year one of the development period are
following assumptions are made:                                        replaced, insofar as they are installed in those buildings. The
1) The Energy Demand Calculation and Heating Load Calcu-               energy demand for the EOL and manufacturing stage of the new
lation are based on a single zone model. No building specific          water heaters and the resulting emissions are calculated in LCA
floor plan or zoning is used for the calculations, since this in-      stage B4 and included in the energy balance of the 16th year of
formation is generally not available on a large building stock         the development period. In the scope of this research the RSLs
level.                                                                 are defined based on the sustainable building assessment system
2) Since the information on the refurbished standard of build-         (BNB) (Federal Ministry of IBC, 2019).
ings is also generally not available, we assume that the ener-
getic standard of the building, described by U-values, refers to       3.2   Methodological Approach
its year of construction.
                                                                       Data Collection The overall methodical process starts in
3) The energy demand calculation refers to the German Energy
                                                                       the first step with data collection. This works in two ways:
Saving Ordinance (EnEV) and therefore to DIN V 4108-6 and
                                                                       CityGML files and user input from the graphical user interface
DIN V 4701-10 (used for energy demand calculation of resid-
                                                                       (GUI) of urbi+, as shown in Table 1. The GUI also allows the
ential buildings). Specifically, the heating period procedure is
chosen as an approach within DIN V 4108-6. The length of the             Data/Information                                            CityGML   GUI
                                                                         Building geometry (walls, ground, roof)                         X      -
heating period is defined in the norm to 185 days.                       Building year of construction                                   X      -
4) The CityGML model used must be available in level of de-              Building usage/function                                         X      -
tail 2 (LoD2). This means, that the cubature of the building,            Building roof type                                              X      -
                                                                         Building’s storeys above ground                                 X      -
including the roof shape, is available, but no information about         Building’s geographic location (ZIP-Code)                       X      -
windows or internal walls, etc. is given.                                Range of year of construction for assessment                    -      X
5) Underground car parks are excluded from the calculation. It           Percentage of heated top floors                                 -      X
                                                                         Percentage distribution of energy systems                       -      X
is assumed that they are not thermally relevant/not heated.              Percentage distribution of heat transfer systems                -      X
6) In the refurbishment scenario it is assumed that the cubature         RSL of all considered TBS components                            -      X
of the buildings does not change, i. e. that there is no increase in     Primary energy factors of considered energy sources             -      X
                                                                         Percentage share (non-)renewable energy of energy sources       -      X
height (urban redensification) and that no additional new build-
ings are added. All buildings are assumed to be refurbished
                                                                                 Table 1. Input data sources for the calculations.
and not demolished and rebuilt. An in depth refurbishment of
buildings has proven to be the more ecological and less energy-        definition of further building, energy sources and TBS specific
intensive option (Weiler et al., 2017).                                data. The data from the CityGML file is building-specific data,
7) The refurbishment of wall, ground and roof surfaces is rep-         whereas the user input data from the GUI defines average val-
resented by the improvement of the U-values. When refurbish-           ues for all considered buildings. The average values replace
ing the TBS components, it is assumed that all components are          missing building-specific data (e. g. exact definition of the heat
replaced completely.                                                   generator) which in most cases is not available in CityGML data
8) In case of refurbishment of a large building stock, the aver-       for large building stocks.
age of the energy systems defined for the entire building stock
is used for the iterative calculation at building level. This means    Data Processing and Precalculations All collected data is
that if 80% of the residential buildings of the considered build-      either cached or used for precalculations, to have all data avail-

         This contribution has been peer-reviewed. The double-blind peer-review was conducted on the basis of the full paper.
                   https://doi.org/10.5194/isprs-annals-VI-4-W1-2020-85-2020 | © Authors 2020. CC BY 4.0 License.                                87
ISPRS Annals of the Photogrammetry, Remote Sensing and Spatial Information Sciences, Volume VI-4/W1-2020, 2020
3rd BIM/GIS Integration Workshop and 15th 3D GeoInfo Conference, 7–11 September 2020, London, UK
able for the following Energy Demand Calculation and Heating The procedure for calculating the primary energy requirement
Load Calculation: for DHW is the same as for heating. The time component of the
1) All residential buildings to be assessed are selected accord- heating period of 185 days is taken into account for all calcula-
ing to their use/function and area from the year of construction. tions.
2) The area of wall, ground and roof surfaces is computed based
on the geometry of the CityGML model. Heating Load Calculation The heating load calculation
3) With the information about roof type, percentage of heated refers to DIN 12831. Equation 2 shows the main considered
top floors and geometry, the building’s net volume is calculated. variables. The calculation refers to the minimum temperature of
4) The information of storeys above ground is used to calculate the year. This ensures that the calculated heating load for satis-
the building’s living area. Therefore, the ground surface area fying the heating energy requirement is guaranteed even on the
is multiplied with the number of storeys above and the factor coldest days. Multiplied by the average efficiency, which res-
0.89, according to (Bogenstätter, 2007). ults from the percentage share of efficiency of the energy sys-
5) Using the SharedWallSurface calculator the external wall tem distribution at building stock level, this gives the required
areas, which are ’shared’ between buildings are calculated. heating load to be covered.
6) Building volumes are calculated using Voluminator, which X X X
allows the building volumes to be determined, even if the build- ΦHL,build = (ΦT,i )+ΦV,build + (Φhu,i )− (Φgain,i ) (2)
ing topology is not correct.
7) The information about the year of construction of the build- where ΦHL,build = heating load building [kW]
ing is used to sort the building to a specific building age class. ΦT,i = transmission heat losses [kW]
According to the specific class, U-values are sourced from a self ΦV,build = infiltration heat losses [kW]
developed and integrated LCA-database and cached for calcu- Φhu,i = heating capacity [kW]
lation. Both, the building age classes as well as the U-values Φgain,i = heat gains [kW]
are based on the definitions developed by Loga et al. in the
TABULA project (Loga et al., 2015). Dimensioning TBS components All considered TBS com-
8) The living area and building age class are used to calculate ponents are dimensioned on the basis of different assumptions
the approximate window area. As (Heinrich, 2019) defined, ac- and norms, which are briefly presented in the following.
cording to (Diefenbach et al., 2010) and (Loga et al., 2005), The dimensioning or required power of the heat generator is
approximate window areas refer to the living area of residential derived from the rounded value of the calculated heating load
buildings of different building age classes. These values were for heating and DHW multiplied by the efficiency of the con-
used for the extrapolation. The resulting window area is dis- sidered heat generator. The dimensioning of the oil tank results
tributed evenly over the difference between the total area of all from dividing the building specific PED by the energy content
external walls and the shared wall surface area. of heating oil. The energy content of the heating oil is assumed
9) Based on the geographical location (ZIP-Code), the min- to be 10 kWh/l.
imum outside air temperature of the region is taken from the The length of earth probes is calculated by dividing the heat
LCA-database. These temperatures are defined in DIN 12831. pump extraction capacity by the specific extraction capacity.
The heat pump heat extraction rate is calculated from the heat-
Energy Demand Calculation The energy demand calcula- ing load of the building and the coefficient of performance
tion for heating and domestic hot water (DHW) is based on DIN (COP) of the heat pump. The COP is assumed to have an aver-
V 4108-6 and DIN V 4701-10. Equation 1 describes the first age value of 3.1. For the specific extraction capacity, an average
basic step in energy demand calculation. The transmission heat value of 50 W/m across all types of flooring is assumed (see
losses are calculated using the U-values and areas of all wall, guideline VDI 4640 (VDI, 2019)). The length of the earth col-
ground and roof surfaces. The infiltration losses and internal lector and the depth of the water well is calculated according
heat gains are calculated by using the building’s net volume to the power of the associated sole-water, or water-water heat
and multiplying it with a respectively given factor, defined in pump, based on technical specification in LCA-datasets of the
DIN V 4108-6. The solar gains are calculated by multiplying Ökobaudat.
the window area with an average solar irradiation value from all The heating load of the building divided by the average heat
directions, also according to DIN V 4108-6. output of a radiator results in the length of radiators required to
transfer the heat output into the rooms. On the basis of further
Qu =Ql −η p (Qs +Qi ) (1) assumptions regarding average length, height, width and mater-
ial, the material mass of the radiators can be calculated. When
where Qu = useful energy demand [kWh] dimensioning the floor heating pipes, the installation distance
Ql = heat losses (transmission + infiltration) [kWh] of the pipes is decisive. A distinction is made between 100 and
η p = utilization factor [-] 200mm. According to this, the heat output transferred into the
Qs = solar heat gains [kWh] room can be calculated. Based on the installation distance and
Qi = internal heat gains [kWh] the living area, the material mass of the floor heating pipes can
also be calculated. These calculations are also based on tech-
In addition, the heat losses as well as the auxiliary energies for nical specification in Ökobaudat LCA-datasets.
the transfer of heat into the room and for heat storage and dis- Four different pipe systems are used to calculate the pipe
tribution are added to the useful energy demand. The resulting lengths for heating. A distinction is made between floor ring
sum is then multiplied by the product of the heat generator cost type, floor distributor type radiators, floor distributor type, riser
figure and the degree of coverage for heating, both defined in pipe type (average values multiplied by the defined share of ra-
DIN V 4701-10. The resulting value is then multiplied by the diators via GUI) and floor heating (multiplied by a defined share
PEF. This finally results in the PED of the building. For the PED of floor heating via GUI). The respective pipe lengths are cal-
calculation of DHW a useful energy demand of 12.5 kWh/m2 *a culated by multiplying the living area with specific fixed calcu-
is assumed as the initial value (according to DIN V 4701-10). lation parameters according to DIN V 18599-5. Three different
This contribution has been peer-reviewed. The double-blind peer-review was conducted on the basis of the full paper.
https://doi.org/10.5194/isprs-annals-VI-4-W1-2020-85-2020 | © Authors 2020. CC BY 4.0 License. 88ISPRS Annals of the Photogrammetry, Remote Sensing and Spatial Information Sciences, Volume VI-4/W1-2020, 2020
3rd BIM/GIS Integration Workshop and 15th 3D GeoInfo Conference, 7–11 September 2020, London, UK
piping systems are used to calculate the pipe lengths for DHW. demand calculations at the level of individual buildings from
A distinction is made between decentralized supply (multiplied urbi+ with results from already established building simulation
by a defined share of instantaneous water and gas storage heat- software IDA ICE (EQUA Solutions AG, 2020) and the already
ers), riser line type and level type (multiplied by the remaining mentioned tool UMI. As the results differed only slightly, first
proportion of DHW systems). The respective pipe lengths are results were calculated for a ’small’ district with about 300 res-
calculated by multiplying the living area with specific fixed cal- idential buildings. Again, the calculation results have shown
culation parameters according to DIN V 18599-8. correct trends. However, the investigations have shown that
The material volume of the pipe insulation for heating and different assumptions and definitions have to be made for the
DHW pipes is calculated using the formula for the volume of investigations at building stock level than for the calculation at
a hollow cylinder. The diameters used for the calculation are individual building level (Harter et al., 2020).
derived from the previously calculated average pipe diameter
and the insulation standard, based on the energy standard after
refurbishment. 5. CASE STUDY MUNICH
The dimensioning of heat storage tanks for heating water is cal-
culated according to DIN V 18599-5, whereby the daily standby The case study used to apply the method consists of 115,305
heat loss results from DIN 4701-10. residential buildings in Munich, Germany. This covers 81% of
The dimensioning of heat storage tanks for DHW is calculated all residential buildings, when comparing the number of resid-
according to DIN V 18599-8. The standard defines assumptions ential buildings of 2018 published by Statista (Statista, 2019).
for the daily energy demand for hot water, the usage factor and The discrepancy in the number of residential buildings is caused
cold and hot water temperatures required for the calculation. by different data sources and data pre-processing steps. While
The solar collector area is calculated according to (SBZ Mon- the CityGML LoD2 data where provided by the Bavarian State
teur, 2020). An average value is calculated for vacuum tube Office for Digitization, Broadband and Surveying3 (Project:
and flat plate collectors. The values for the average German ir- Geomassendaten), all other building-specific parameters (e. g.
radiation intensity are sourced from the German meteorological year of construction) where provided by the Planning Depart-
service (DWD, 2020). ment of the Bavarian State Capital Munich4 . The matching of
data was carried out by using a geometric intersection opera-
Life Cycle Assessment In the LCA, the grey energy and tion between the building ground surfaces and house coordin-
emissions of the TBS components under consideration are then ates with statistical values attached as attributes, which resulted
calculated and combined with the energy demand of the use in losing some unmatched buildings. In addition, the paramet-
stage and the resulting emissions. The calculated dimensions ers required for calculations were not available for all buildings,
of the TBS components are offset against the LCA datasets. which also resulted in the exclusion of further buildings. The
The LCA data sets from the LCA database naturally refer to the following average values resulting from the Data Processing
same unit that results from the dimensioning of the TBS com- and Precalculations characterize the building stock under in-
ponents. For each TBS component and LCA stage considered, a vestigation.
specific average value calculated on the basis of the Ökobaudat
database is stored in the LCA database. Equation 3 shows the 5.1 Definitions
exemplary calculation of the embedded PED for the LCA stages
production, EOL and recycling/reuse of the heat generator. 1) Average number of floors is 2.6. (min: 1, max: 29). Since
X the citizens’ decision in 2004, no buildings taller than 100m are
P E grey, hg = P E A1-A3, C2, C4, D, hg × P heat generator (3) allowed to be built in Munich, the tallest residential building
has 29 floors.
where P E grey, heat generator = grey primary energy [kWh] 2) Average living space per building 415m2 , i. e. average 130m2
P E A1-A3, C2, C4, D = LCA-values [kWh/kW] living space per floor.
P heat generator = power of heat generator [kW] 3) Mean building volume 1,522m3 , i. e. mean value 499m3
volume per floor (without consideration of interior walls and
intermediate ceilings).
Result data preparation All relevant calculated (intermedi-
ate) results are exported back to an Excel file as well as to the These data seem consistent when comparing the distribution of
original CityGML file. The values are appended to each build- buildings over the age classes in Figure 2 with the distribution
ing object as newly defined generic attributes. This way they of building volumes over their living area in Figure 1. Figure 2
are persistently stored in the model and can be used for visualiz- shows that about 35% of the residential buildings were con-
ation purposes and any further investigations and analyses. For structed before 1957 and that building age class 4 (bac 4) is the
visualization appearances of the data are defined using a color most strongly represented age class with about 21%. This is
scale for the buildings according to their energy demand. For likely due to the fact that the shortage of materials caused by
this purpose we have set up a Github repository2 , with a link to the Second World War was slowly overcome at the beginning
a 3D Web Map Client project, where the results can be viewed of the bac 4. Figure 1 shows a correlation between building
in the browser. The coloring of all buildings is set according to volume and living area. In addition, the distribution shows that
their specific PED [kWh/m2 a] from red to green for the status buildings with a low building age class, i. e. older buildings,
quo and a renovation or development scenario. have a larger volume per square meter of living area. That is
plausible, because in older buildings, high ceilings and fewer
4. VALIDATION floors were preferred. The consideration of the distribution of
the building age classes in the context of the distribution of the
The methodological block for energy demand calculation has 3
already been validated by comparing the results from energy https://www.ldbv.bayern.de/
4 https://www.muenchen.de/rathaus/Stadtverwaltung/Referat-fuer-
2 https://github.com/tum-gis/LCA-TGA Stadtplanung-und-Bauordnung.html
This contribution has been peer-reviewed. The double-blind peer-review was conducted on the basis of the full paper.
https://doi.org/10.5194/isprs-annals-VI-4-W1-2020-85-2020 | © Authors 2020. CC BY 4.0 License. 89ISPRS Annals of the Photogrammetry, Remote Sensing and Spatial Information Sciences, Volume VI-4/W1-2020, 2020
3rd BIM/GIS Integration Workshop and 15th 3D GeoInfo Conference, 7–11 September 2020, London, UK
Figure 3. Comparison of absolute and specific PED for the three
scenarios.
biomass; 100% district heating
4) heat transfer system: 100% radiators; radiators 50%, floor
heating 50%; floor heating 100%
5) U-values [W/m2 K]: according to bac (see Subsection 3.2);
wall: 0.24, window: 1.3, roof: 0.24, base plate: 0.35; wall:
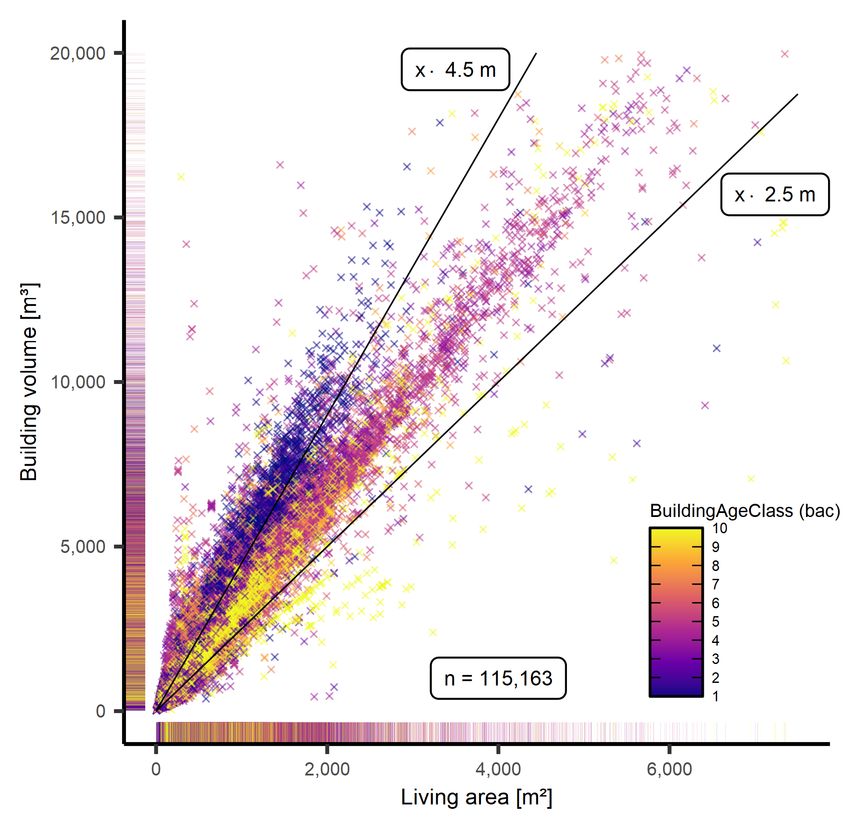
Figure 1. Distribution of building volume vs. living area. 147 0.15, window: 0.85, roof: 0.15, base plate: 0.3
buildings with volume > 20, 000 m3 , living area > 7, 500 m2 6) g-value Window [-]: according to bac; 0.6; 0.5
filtered out for better visibility. The range of plausible floor 7) PEFs: gas: 1.1, oil: 1.1; gas: 1.1, environmental heat and
heights (2.5 − 4.5 m) lies between the two black lines. solar radiation: 0.0, biomass: 0.2, electricity: 0.5, district heat-
ing: 0.5; solar radiation: 0.0, district heating: 0.1.
8) reference service life [years]: gas-boiler: 20, oil-boiler 20,
gas-storage heaters: 20, instantaneous flow heaters: 15, DHW
and heating pipes: 50, pipe insulation: 25, heat storage tanks:
25, radiators: 50; gas-boiler: 20, all heat-pumps: 20, biomass-
boiler 20, earth probes and collectors: 50, DHW and heating
pipes: 50, pipe insulation: 25, heat storage tanks: 25, radiators
and floor heating: 50; district heating connection station: 20,
floor heating: 50, DHW and heating pipes: 50, pipe insulation:
Figure 2. Distribution of buildings over building age classes. No 25, heat storage tanks: 25.
filtering as in Figure 1 applied. 9) share of renewable and non-renewable energy of energy
sources: gas: 10% / 90%, oil: 0% / 100%; gas: 30% / 70%,
ratios between building volume and living area as well as the electricity: 50%, 50%, environmental heat and solar radiation:
already mentioned average values thus result in a coherent pic- 100%, 0%, biomass: 100%, 0%; district heating: 90%, 10%,
ture. However, the number of buildings with ceiling heights of solar radiation: 100%.
more than 4.5 meters has to be examined more closely for fu-
ture investigations, as there may be discrepancies between the 5.3 Results
number of floors and the building height between the data of the
Bavarian State Office for Digitization, Broadband and Survey- Figure 3 shows the improvement of the absolute and specific
ing and the Planning Department of the Bavarian State Capital PED of the buildings’ use stage through the refurbishment of
Munich (different up-to-dateness of the data). the entire building stock in the two scenarios (scenario 1 and
2) on a logarithmic scale. The results of the status quo (scen-
5.2 Parameter Definition for Simulation ario 0) are shown next to it as a reference value. It can be seen
that the fluctuation range of the values changes according to the
In order to carry out a life cycle based assessment of the build- ratio of the numbers within a scenario and that a significant re-
ing stock for the status quo and two refurbishment scenarios, duction can be achieved for both the absolute and the specific
the input parameters for the simulations must be defined first. PED (−96% & −99%). The mean value of the specific PED
The development period of both refurbishment scenarios is set has fallen from 238 to 11, or 3 kWh/m2 a and the mean value of
to 30 years, which means that until 2050 all residential build- the absolute PED from 6,5377 to 2,823, or 361 kWh/a. Among
ings are refurbished to defined values. The definitions used for other things, this is due to the very strongly improving primary
the calculation are based on assumptions that serve to explain energy factors (PEFs). Table 2 shows the changes of the dif-
the methodological approach (status quo = scenario 0; develop- ferent TBS component dimensions in the different scenarios,
ment scenario 1; development scenario 2): referring always to the average values over all buildings. Due
1) percentage heated top floors: 20%; 80%; 80% to the reduction of the heating load and the use of efficient and
2) DHW: 20% gas, 40% oil, 10% gas-storage heaters, 10% elec- modern heat generator technologies and systems, the connec-
tric flow heaters; 20% gas, 30% heat pumps (hp), 40% solar, ted load of the heat generators has been reduced from 43 kW
10% district heating; 30% solar, 70% district heating. to 14 kW and 11 kW respectively. Oil tanks are only existing
3) heating: 80% gas, 20% oil; 20% gas, 40% air-water hp, 5% for the status quo and account for an average volume of 2,018
hp earth collector, 5% hp earth probe, 20% water-water hp, 10% liters. DHW’s storage accounts for around 95% of hot water
This contribution has been peer-reviewed. The double-blind peer-review was conducted on the basis of the full paper.
https://doi.org/10.5194/isprs-annals-VI-4-W1-2020-85-2020 | © Authors 2020. CC BY 4.0 License. 90ISPRS Annals of the Photogrammetry, Remote Sensing and Spatial Information Sciences, Volume VI-4/W1-2020, 2020
3rd BIM/GIS Integration Workshop and 15th 3D GeoInfo Conference, 7–11 September 2020, London, UK
storage (heating & DHW). The basic need for DHW does not
change with a building refurbishment, only the efficiency and
the type of technical connection of the systems that produce the
DHW. Because of this, the average value only decreases slightly
over the scenarios. Solar systems for DHW exist only in scen-
ario 1 & 2. The number of square meters is adjusted mainly
on the basis of the defined degree of coverage for the genera-
tion of DHW from solar systems. The earth collectors, probes
and pipes for the sole-water and water-water heat pumps only
appear in scenario 1. The earth collectors are logically much
longer than the probes. The mass of the pipes of the water-water
heat pump is calculated based on the calculation of the LCA. By
adapting the heat transfer through radiators, their mass portion
is reduced when comparing status quo with scenario 1. The op-
posite is the case when calculating the length of the floor heat-
ing pipes. Both are caused by the before mentioned definition
of the heat transfer system. The length of DHW pipes, given in
meters per square meter of living area, increases in comparison. Figure 4. Comparison PED (TPE H + TPE DHW) with the
This is due to the fact that in the status quo more decentralized embedded PED (TPE E) for both development scenarios.
energy systems were used for DHW provision, which require
significantly shorter pipe lengths and are installed downstream most of these buildings have been refurbished, the course will
at the tap. With the switch to more decentralized energy sys- flatten out. The small bend around the year 2040 results from
tems for DHW generation, the average pipe length increases. the fact that the TBS components of the buildings which have
The length of heating pipes, also given in meters per square been renovated in the first years already have to be replaced, be-
meter of living area, is the exact opposite. This is due to the cause they have reached the end of their RSL. A closer look at
fact that in the status quo, 100% of the heating is provided by the figures of scenario 1 & 2 shows that in the third year of re-
radiators and therefore pipes have to be added to each radiator furbishment, i. e. 2023, the investment in embedded energy will
installed. With the increasing use of floor heating systems, the have amortized by comparison with the savings achieved. This
average pipe length decreases, as pipes only have to be laid per will not change over the further course of the refurbishment
heated room. The pipe insulation adapts to the sum of these scenarios. However, it must be noted that embedded energy is
two values and is expressed in cubic meters per meter of pipe not taken into account for the renovation of the building envel-
length. The embedded energy and emissions of the manufac- ope which must be investigated in following research. Even if
there is a significant reduction in the energy demand through
TBS component Status quo Scenario 1 Scenario 2
heat generator [kW] 43 14 11
the ambitious renovation of all residential buildings to a high
oil tank [l] 2,018 - - energy standard and with efficient technologies in the two scen-
heat storage tank [l] 469 457 453 arios, a PED of around 325.5 million (m) kWh in scenario 1 and
solar [m2 ] - 1.68 10.12 41.5 m kWh in scenario 2 still remains. This results in around
earth collector [m] - 34.2 255.4 m kg CO2 -eq./a for scenario 1 and 71.4 m kg CO2 -eq./a
earth probe [m] - 9.3 - for scenario 2 (calculated on the basis of Ökobaudat-database
pipes water-water hp [kg] - 4.11 -
values) and this does not yet include embedded energy for the
radiators [kg] 1,489 349 -
pipes floor heating [m/m2 ] - 2.17 1.33
building construction.
pipes DHW [m/m2 ] 2.9 3.2 3.2
pipes heating [m/m2 ] 3.62 3.33 3.03
pipes insulation[m3 /m] 0.0023 0.0022 0.0011 6. DISCUSSION
Table 2. Dimensions TBS components. The case study shows, that the introduced method can be ap-
plied to large building stocks by using semantic 3D city mod-
turing, use and EOL stage are calculated on the basis of the els. Due to the standardization (CityGML) of the city model
building-specific dimensions of the TBS components. If these the approach can easily be applied to other cities. In general,
values are combined with those of the use stage, i. e. for the it can be seen that if we assume that all residential buildings
operation of the building, and considered over the course of the will be refurbished to an ambitious energy standard, there will
year over the development period of the refurbishment scen- be a significant reduction in PED and emissions. However, it
arios, the results are as shown in Figure 4. Over the course is very difficult to achieve a climate-neutral building stock, es-
of 30 years, around 3,843 residential buildings are refurbished pecially when including the embedded energy resulting from
each year, so that by 2051 all buildings have been refurbished. LCA. Even if the PED can be reduced by using renewable en-
The graph clearly shows the significant reduction in the total ergy technologies, PEDs and emissions are still generated in the
PED (heating tpe h and DHW tpe dhw) of all building-specific manufacturing, use and EOL stage. With regard to the refur-
use stages as a result of the refurbishment. In addition, the total bishment of the TBS, however, it can be said that, at least in the
amount of embedded energy tpe e for the EOL of old systems scenarios considered, a rapid amortisation of the embedded en-
to be disposed in the course of refurbishment and manufactur- ergies has been achieved. In order to focus more strongly on the
ing of the new systems is also listed. It can be seen that the use of solar thermal energy and photovoltaics, it is planned to
course is much steeper in the first years and then makes a small integrate an already developed solar tool into the framework of
bend around the year 2040. This is because the selection of urbi+. In the course of a refurbishment, not only the TBS com-
buildings described in chapter 3.1 will first refurbish all the old ponents but also the building envelope will be refurbished, thus
buildings with a high specific and absolute PED. As soon as the LCA of the building construction will be integrated in future
This contribution has been peer-reviewed. The double-blind peer-review was conducted on the basis of the full paper.
https://doi.org/10.5194/isprs-annals-VI-4-W1-2020-85-2020 | © Authors 2020. CC BY 4.0 License. 91ISPRS Annals of the Photogrammetry, Remote Sensing and Spatial Information Sciences, Volume VI-4/W1-2020, 2020
3rd BIM/GIS Integration Workshop and 15th 3D GeoInfo Conference, 7–11 September 2020, London, UK
work. Experience has shown that a large proportion of embed- Federal Ministry of IBC, 2019. Federal Ministry of Interior Building and
ded energy and emissions are generated in this process. Apart Community (IBC) - Sustainable Building Assessment System (BNB).
https://www.bnb-nachhaltigesbauen.de/. Online; accessed 2019-08-28.
from this, the life cycle cost (LCC) assessment plays an import-
Federal Ministry of IBC, 2020. Federal Ministry of Interior Building
ant role in construction projects. Especially with regard to the
and Community (IBC) - ÖKOBAUDAT. www.oekobaudat.de/. Online;
upcoming pricing of CO2 -emissions, it makes sense to integrate accessed 2020-04-05.
LCC into urbi+. A big advantage of the introduced method is Fuchs, D., 2018. Berechnung des Energiebedarfs von Wohngebäuden auf
that the results are fed back to the CityGML building objects as Basis von semantischen 3D-Stadtmodellen am Beispiel der Gemeinde Po-
ing. Bachelorarbeit, Technische Universität München, München.
generic attributes. This way, the result figures are persistently
German Federal Ministry of EAE, 2013. German Federal Ministry of
stored in the city model linked to the specific real world objects Economy Affairs and Energy (EAE) - Energy Saving Ordinance (EnEV).
they belong to and are thus available for subsequent analysis Harter, H., Banihashemi, F., Kierdorf, D., Vollmer, M., Lang, W., 2020.
including other data source or software. One example of this Comparison of different energy demand calculation models on urban
approach can be found in the work of (Fuchs, 2018), where ref- scale. (Accepted at BauSim2020 Conference in Graz).
erence values for solar heat gains in the heat demand calculation Heinrich, M. A., 2019. Erfassung und Steuerung von Stoffströmen im
have been replaced with results of the solar potential analysis urbanen Wohnungsbau. Dissertation, Technical University of Munich.
tool described in (Willenborg et al., 2017). By using the more Kaden, R., 2014. Berechnung der Energiebedarfe von Wohngebäuden
und Modellierung energiebezogener Kennwerte auf der Basis se-
detailed results of the solar tool including the 3D topography mantischer 3D-Stadtmodelle. Dissertation, TU München.
surrounding the buildings, the accuracy of heat demand calcu- Kolbe, T. H., 2009. Representing and Exchanging 3D City Models with
lation could be improved significantly. Moreover, the results CityGML. J. Lee, S. Zlatanova (eds), 3D Geo-Information Sciences, Lec-
can easily be visualized using the 3DCityDB WebMapClient. ture Notes in Geoinformation and Cartography, Springer Berlin Heidel-
berg, Berlin, Heidelberg, 15–31.
Loga, T., Diefenbach, N., Knissel, J., Born, R., 2005. Entwicklung
ACKNOWLEDGEMENTS eines vereinfachten, statistisch abgesicherten Verfahrens zur Erhebung
von Gebäudedaten für die Erstellung des Energieprofils von Gebäuden.
Kurzverfahren Energieprofil.
The authors would like to thank Ordnance Survey GB Loga, T., Stein, B., Diefenbach, N., Born, R., 2015. Deutsche
(www.ordnancesurvey.co.uk) and 1Spatial (www.1spatial.com) Wohngebäudetypologie - Beispielhafte Maßnahmen zur Verbesserung der
for sponsoring the publication of this paper. Energieeffizienz von typischen Wohngebäuden. IWU, Darmstadt.
Nouvel, R., Bahu, J.-M., Kaden, R., Kaempf, J., Cipriano, P., Lauster, M.,
Häfele, K.-H., Munoz, E., Tournaire, O., Casper, E., 2015a. Development
REFERENCES of the citygml application domain extension energy for urban energy sim-
ulation. Building Simulation 2015 - 14th IBPSA Conference, India.
Biljecki, F., Stoter, J., Ledoux, H., Zlatanova, S., Çöltekin, A., 2015. Nouvel, R., Brassel, K.-H., Bruse, M., Duminil, E., Coors, V., Eicker,
Applications of 3D City Models: State of the Art Review. ISPRS Interna- U., Robinson, D., 2015b. SimStadt, a new workflow-driven urban energy
tional Journal of Geo-Information, 4(4), 2842–2889. simulation platform for CityGML city models. Proceedings of Interna-
Bogenstätter, U., 2007. Flächen- und Raumkennzahlen. tional Conference CISBAT 2015, LESO-PB, EPFL, 889–894.
www.ifbor.eu/3.html. Online; accessed 2020-02-12. Open Geospatial Consortium, 2012. OGC City Geography Markup Lan-
Cabeza, L. F., Rincón, L., Vilariño, V., Pérez, G., Castell, A., 2014. Life guage (CityGML) Encoding Standard 2.0.
cycle assessment (LCA) and life cycle energy analysis (LCEA) of build- Reinhart, C., Dogan, T., Jakubiec, A., Rakha, T., Sang, A., 2013. UMI
ings and the building sector: A review. Renewable and Sustainable En- - an urban simulation environment for building energy use, daylight and
ergy Reviews, 29, 394–416. walkability. 13th IBPSA Conference, Chambéry, France.
Chen, Y., Hong, T., Piette, M. A., 2017. Automatic generation and simula- Remmen, P., Lauster, M., Mans, M., Osterhage, T., Müller, D., 2016.
tion of urban building energy models based on city datasets for city-scale CityGML import and export for dynamic building performance simula-
building retrofit analysis. Applied Energy, 205, 323–335. tion in modelica. Proceedings of BSO Conference, Newcastle University.
Coccolo, S., Mauree, D., Kämpf, J., Scartezzini, J.-L., 2016. Integration SBZ Monteur, 2020. Wirkungsgrad von Solaranlagen. www.sbz-
of outdoor human comfort in a building energy simulation database using monteur.de/gut-zu-wissen/wirkungsgrad-von-solaranlagen. Online; ac-
CityGML Energy Ade. SBE Regional Conference Zurich. cessed 2020-04-11.
Diefenbach, N., Cischinsky, H., Rodenfels, M., Clausnitzer, K.-D., 2010. Sindram, M., Machl, T., Steuer, H., Pültz, M., Kolbe, T. H., 2016. Volu-
Datenbasis Gebäudebestand. Datenerhebung zur energetischen Qualität minator 2.0 - Speeding up the Approximation of the Volume of Defective
und zu den Modernisierungstrends im deutschen Wohngebäudebestand. 3D Building Models. ISPRS Annals, III-2.
Institut Wohnen und Umwelt (IWU). Darmstadt.
Statista, 2019. Wohngebäude in München - Bestand bis 2018.
DIN EN 12831-1:2017-09, 2017. Energy performance of buildings - https://de.statista.com/statistik/daten/studie/260455/umfrage/bestand-an-
Method for calculation of the design heat load - Part 1. wohngebaeuden-in-muenchen. Online; accessed 2020-04-15.
DIN EN 15978:2012-10, 2012. Sustainability of construction works - As- UN Environment and IAE, 2017. Towards a zero-emission, efficient, and
sessment of environmental performance of buildings. resilient buildings and construction sector.
DIN EN ISO 14040:2009-11, 2009. Environmentalmanagement - Life VDI, 2019. Verein Deutscher Ingenieure (VDI) - Thermal use of the un-
cycle assessment - Principles and framework. derground Ground source heat pump systems VDI 4640 Blatt 2.
DIN V 18599-5:2018-09, 2018. Energy efficiency of buildings - Calcu- Walter, E., Kämpf, J., 2015. A verification of CitySim results using the
lation of the net, final and primary energy demand for heating, cooling, BESTEST and monitored consumption values. Proceedings of 2nd BSA
ventilation, domestic hot water and lighting - Part 5. Conference.
DIN V 18599-8:2018-09, 2018. Energy efficiency of buildings - Calcu- Weiler, V., Harter, H., Eicker, U., 2017. Life cycle assessment of build-
lation of the net, final and primary energy demand for heating, cooling, ings and city quarters comparing demolition and reconstruction with re-
ventilation, domestic hot water and lighting - Part 8. furbishment. Energy and Buildings, 134.
DIN V 4108-6:2003-06, 2003. Thermal protection and energy economy Willenborg, B., Sindram, M., Kolbe, T. H., 2017. Applications of 3d city
in buildings – Part 6. models for a better understanding of the built environment. M. Behnisch,
DIN V 4701-10:2003-08, 2003. Energy efficiency of heating and ventila- G. Meinel (eds), Trends in Spatial Analysis and Modelling, Geotechno-
tion systems in buildings – Part 10. logies and the Environment, Springer International Publishing, Berlin,
Heidelberg, 167–191.
DWD, 2020. Deutscher Wetterdienst - Globalstrahlungskarten.
www.dwd.de/DE/leistungen/solarenergie/lstrahlungskarten mi.html. Yao, Z., Nagel, C., Kunde, F., Hudra, G., Willkomm, P., Donaubauer, A.,
Online; accessed 2020-04-11. Adolphi, T., Kolbe, T. H., 2018. 3DCityDB - a 3D geodatabase solution
for the management, analysis, and visualization of semantic 3D city mod-
EQUA Solutions AG, 2020. IDA ICE - Simulation Software — EQUA.
https://www.equa.se/de/ida-ice. Online; accessed 2020-04-02. els based on CityGML. Open Geospatial Data, Software and Standards.
EU Commission, 2018. A Clean Planet for all - A European strategic
long-term vision for a prosperous, modern, competitive and climate neut-
ral economy. Technical report, European Commission, Brussels.
This contribution has been peer-reviewed. The double-blind peer-review was conducted on the basis of the full paper.
https://doi.org/10.5194/isprs-annals-VI-4-W1-2020-85-2020 | © Authors 2020. CC BY 4.0 License. 92You can also read


