Life cycle assessment study on the treatment of plastic and aluminum packaging for beverages 2018
←
→
Page content transcription
If your browser does not render page correctly, please read the page content below
2018

Life cycle assessment study on the
treatment of plastic and aluminum
packaging for beverages
FACULTY OF ENVIRONMENTAL TECHNOLOGY, UCT PRAGUE

VLADIMÍR KOČÍ

                                      1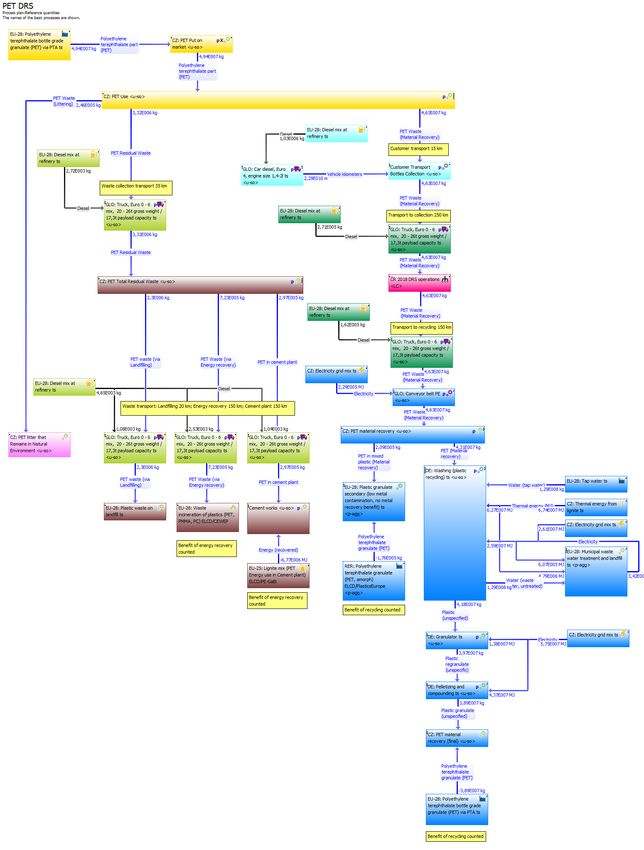
Life cycle assessment study on the treatment of plastic and aluminum packaging for beverages

Prague, Czech Republic

© Vladimír Kočí, December 2018

                                                 2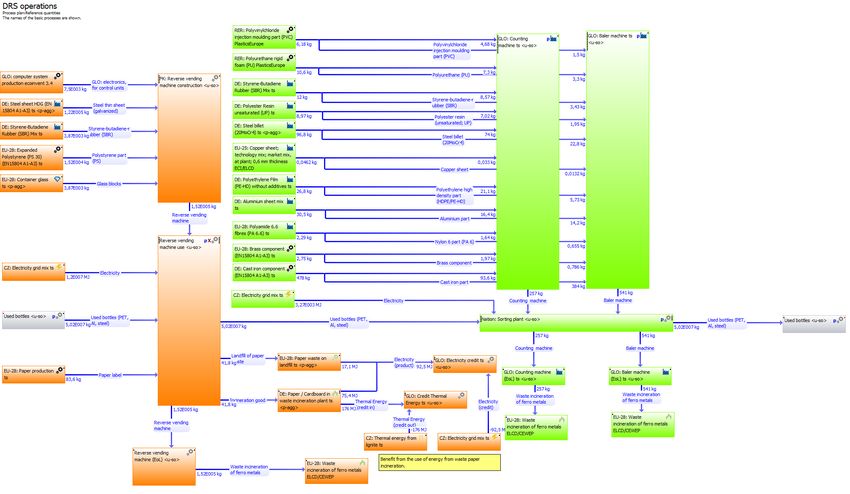
Author

University of Chemistry and Technology in Prague
public university established in accordance with Act No. 111/1998 Coll., on universities

having its registered office at: Technická 1905/5, 160 00 Prague 6

represented by:                    Ing. Ivana Chválná, Bursar

Bank account details:              ČSOB, a.s.

Account No.:                       130197294/0300

ID No.:                            60461373

VAT No.:                           CZ60461373 (VAT-payer)

Specialist researcher              doc. Ing. Vladimír Kočí, PhD, MBA, Faculty of Environmental
Technology

hereinafter referred to as the “Contractor”

Client

Karlovarské minerální vody, a.s.

having its registered office at: Horova 1361/3, 360 01 Karlovy Vary

represented by: Alessandro Pasquale, Statutory Director

Bank account details: ČSOB, a.s., Account No.: 117905233/0300

ID No.: 14706725

VAT No.: CZ14706725

                                                       3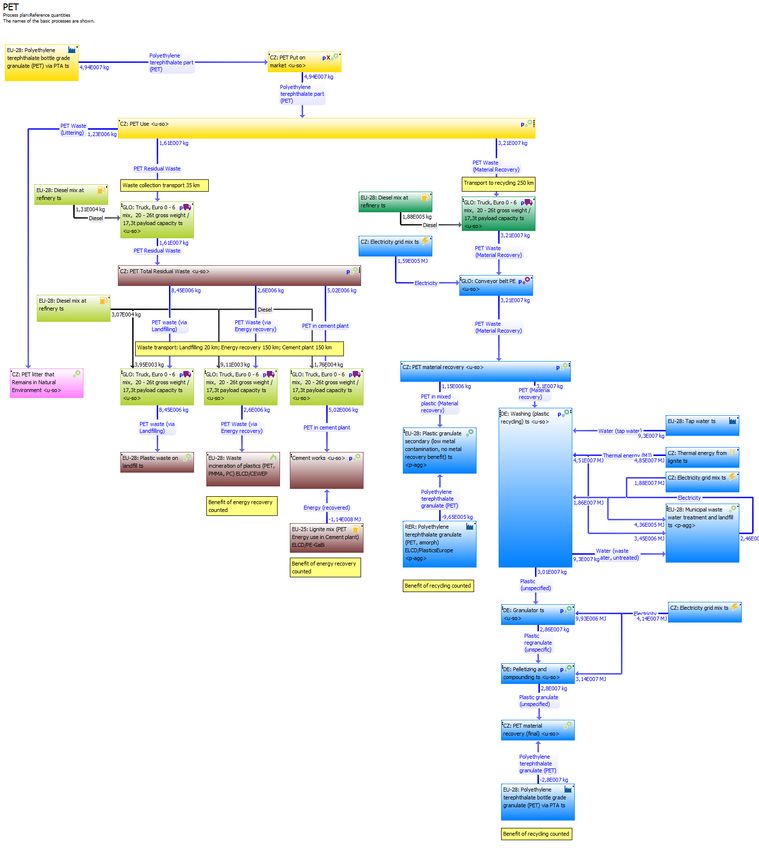
Summary
The study used the Life Cycle Assessment (LCA) method in accordance with ČSN ISO 14040 to carry
out an assessment of the possible environmental impacts of two applied treatment systems for used
beverage PET, aluminum and steel bottles. The two systems examined were a deposit-refund scheme
and a non-deposit-refund scheme. The environmental impacts of both assessed systems were
determined based on a life cycle inventory analysis, followed by description using the ReCiPe
methodology. The conclusiveness of the differences between results was tested using the stochastic
Monte Carlo method, whereupon it was demonstrated that the differences between the systems are
statistically significant, with the exception of the impact category “human toxicity”.

Based on the data obtained, it may be concluded that the implementation of a deposit-refund
system would result in a decrease of environmental impacts related to beverage packaging by up to
approx. 28%. Compared to the non-deposit-refund system, the deposit-refund system shows lower
environmental impacts in the following impact categories: climate changes/global warming, fossil
fuel depletion, ionizing radiation, metal depletion, particulate matter formation, photochemical
oxidant formation, terrestrial acidification, terrestrial ecotoxicity and water depletion.

The largest influence on the total environmental impacts of non-deposit-refund and deposit-refund
systems comes from the following impact categories: climate changes (global warming) both on
ecosystem and human health levels; loss of fossil fuel raw materials; loss of metals and particulate
matter formation. The implementation of a deposit-refund system would result in a statistically
significant decrease in the indicator result values of all assessed impact categories, with the
exception of the impact category “human toxicity”, where both systems are assessed as comparable.

The main limitation of this study is represented by the fact that multi-colored PET bottles have
limited recyclability and secondary use potential, which has not been taken into consideration in the
study due to the lack of relevant data (the usability of PET bottles as a secondary raw material would
increase if colorless PET bottles were used.). The repeated use of PET bottles has not been
considered in this study. The model is based upon processing PET bottles as a secondary raw material
that substitutes the primary raw material.

                                                    4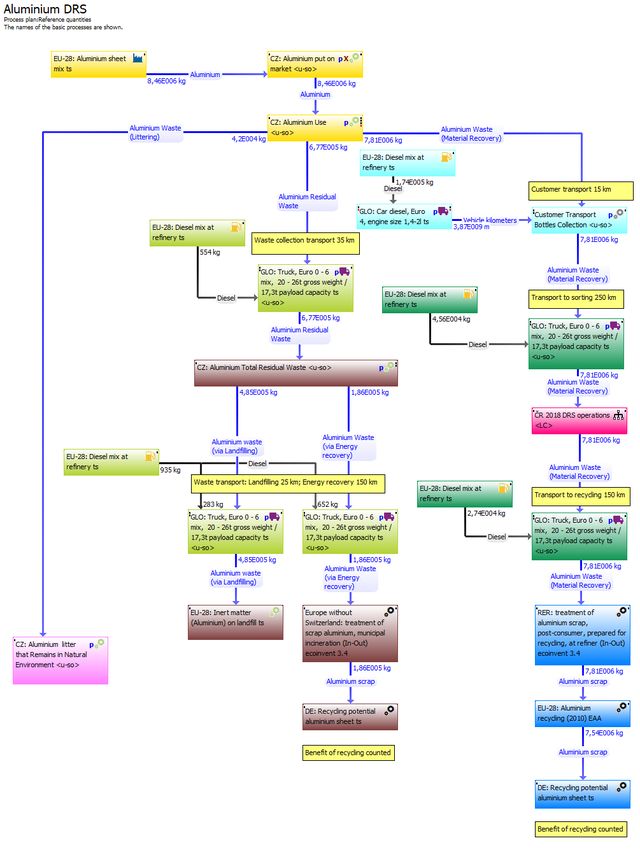
Contents
1     Introduction .......................................................................................................................... 7

2     Description of the assessed systems – system boundary .......................................................... 9

3     Definition of the aims and scope of the study .........................................................................11

    3.1     The aim of the LCA study ...............................................................................................11

    3.2     Definition of the scope of the LCA study .........................................................................11

      3.2.1        Function of the assessed products ..........................................................................11

      3.2.2        Functional unit.......................................................................................................11

      3.2.3        Time span ..............................................................................................................11

      3.2.4        Geographical scope ................................................................................................11

      3.2.5        Reference flow.......................................................................................................11

    3.3     Applied impact categories ..............................................................................................12

    3.4     Applied LCA software.....................................................................................................15

    3.5     Assumptions made and limitations on the validity of the study ........................................15

4     Life cycle inventory analysis ..................................................................................................17

    4.1     Data collection ..............................................................................................................17

    4.2     Unit processes of the LCA model and specific values of the assumptions made .................17

      4.2.1        Littering.................................................................................................................17

      4.2.2        Transport distances ................................................................................................19

      4.2.3        Return of bottles by customers ...............................................................................19

      4.2.4        Number of containers ............................................................................................20

      4.2.5        Sorting line/conveyor belt ......................................................................................20

      4.2.6        RVM ......................................................................................................................21

      4.2.7        Bottle counting and pressing centers.......................................................................22

      4.2.8        Cement Plant .........................................................................................................23

    4.3     LCA model schemes .......................................................................................................23

    4.4     Life cycle inventory analysis outputs – depletion of raw material resources ......................31

5     Life cycle impact evaluation ..................................................................................................32

                                                                      5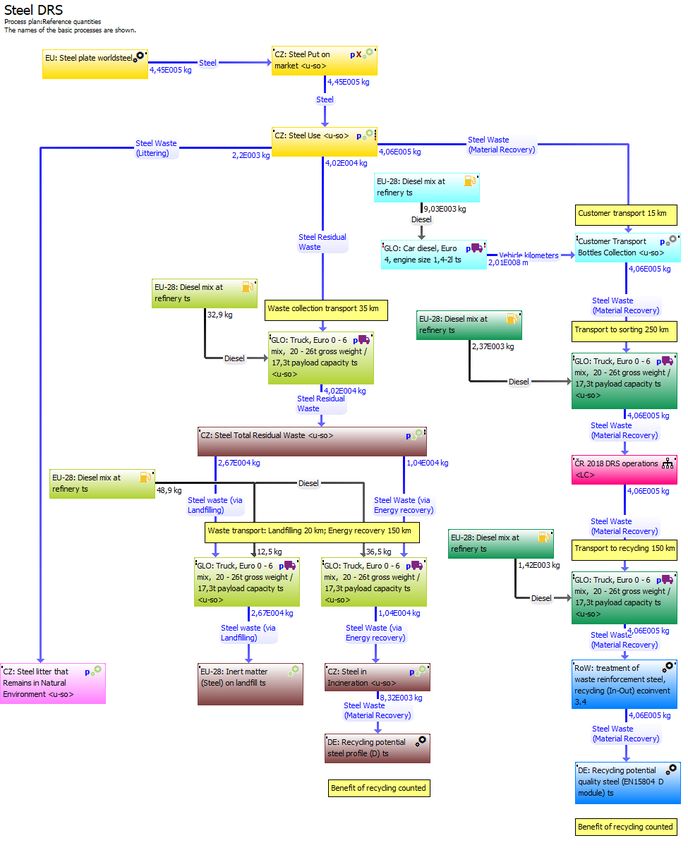
5.1       Life cycle impact evaluation results ................................................................................32

    5.2       Verification of the concordance rate of the results of individual systems using the Monte
    Carlo methodology ...................................................................................................................45

    5.3       Standardized and weighted results .................................................................................56

    5.4       Influence of particular technology spheres......................................................................62

6      Interpretation of the LCA study .............................................................................................64

    6.1       Formulation of significant findings..................................................................................64

    6.2       Sensitivity analyses – alternative scenario results ............................................................65

       6.2.1        Sensitivity analysis on bottle weight and size changes ..............................................65

       6.2.2        Sensitivity analysis on changes in quantities of returned bottles ...............................67

       6.2.3        Sensitivity analysis to transport distance changes ....................................................69

       6.2.4        Sensitivity analysis summary...................................................................................71

7      Conclusion ...........................................................................................................................72

                                                                      6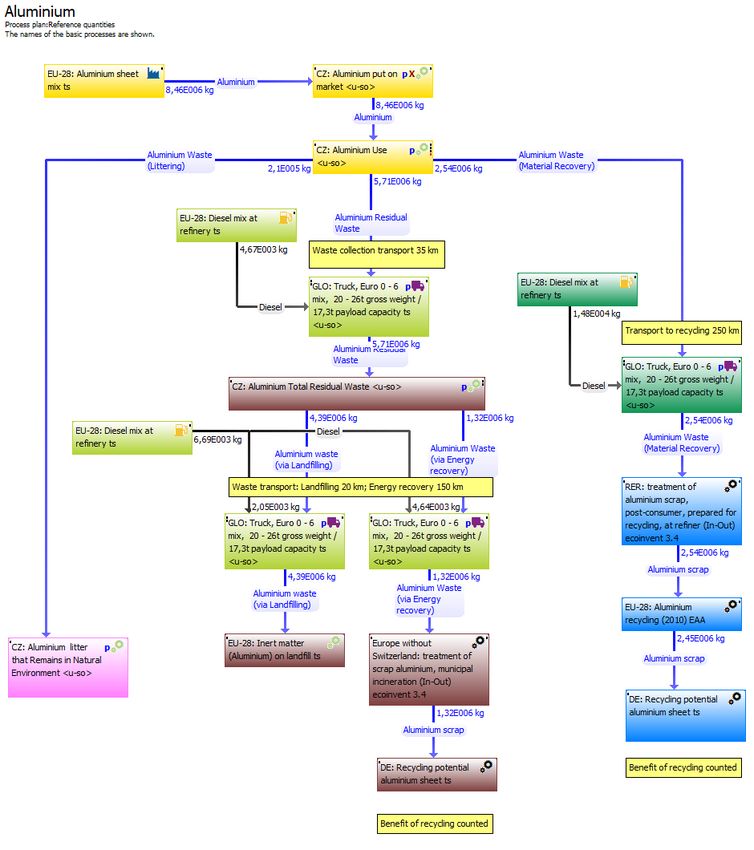
1 Introduction
The goal of this study is to compare, using the Life Cycle Assessment (LCA) method and within the
Czech context, the possible environmental impacts of the current treatment system for used
beverage bottles made of PET, aluminum and sheet steel with an alternative scenario for such
bottles involving a deposit-refund system. This study is part of a project awarded by Karlovarské
minerální vody, a.s. in 2018 and performed in cooperation with INCIEN, Institut cirkulární ekonomiky,
z.ú. and the company Eunomia, and must be regarded in the context of the project as a whole.

The Life Cycle Assessment (LCA) method is an analytic tool based on measuring the technological,
operational and environmental parameters of particular organizations or industrial enterprises which
are involved in the production, transport, operation or disposal of any material, equipment, fuel or
energy carrier entering at any stage of a product life cycle. The LCA method is performed in
accordance with ČSN EN ISO 140401 and ČSN EN ISO 140442, and represents a robust and transparent
tool for quantifying the possible environmental impacts associated with particular input and output
materials and energy. LCA is an internationally used method that is promoted by UNEP 3 and is being
currently discussed in connection with the transition to the circular economy. The basis of the LCA
method lies in determining material and energy flows inwards towards and outwards from the
assessed system, where their quantity, composition, character and importance for the environment
are monitored. From the identified volume of material and energy flows we derive their causes and
effects, and these are then used for determining the resulting possible changes in the environment.

The selected functional unit of the study, i.e. the quantified expression of the magnitude of the
function of the assessed system, was the treated quantity of bottles made of PET, aluminum and
sheet steel that represented the annual placement onto the market in the Czech Republic in 2017. All
data for the beverage packaging flow in 2017 come from the official data of the company EKO-KOM
a.s. The basic assessment scenario is the current method used for treating used bottles at landfill
sites, in waste-to-energy facilities, cement plants and recycling lines. This basic scenario is denoted as
“Baseline” in the study. The scenario considering a deposit-refund for bottles is denoted as “DRS”
(Deposit Refund System).

The LCA study is designed to be attributional, it aims to assess the possible environmental impacts of
the scenarios being assessed. The outcomes that would result from the implementation of the

1
  ČSN EN ISO 14040 Environmental management – Life Cycle Assessment – Principles and Framework, ČNI
2006.
2
  ČSN EN ISO 14044 Environmental management – Life Cycle Assessment – Requirements and Guidelines, ČNI
2006.
3
  http://www.uneptie.org/pc/sustain/lcinitiative/

                                                    7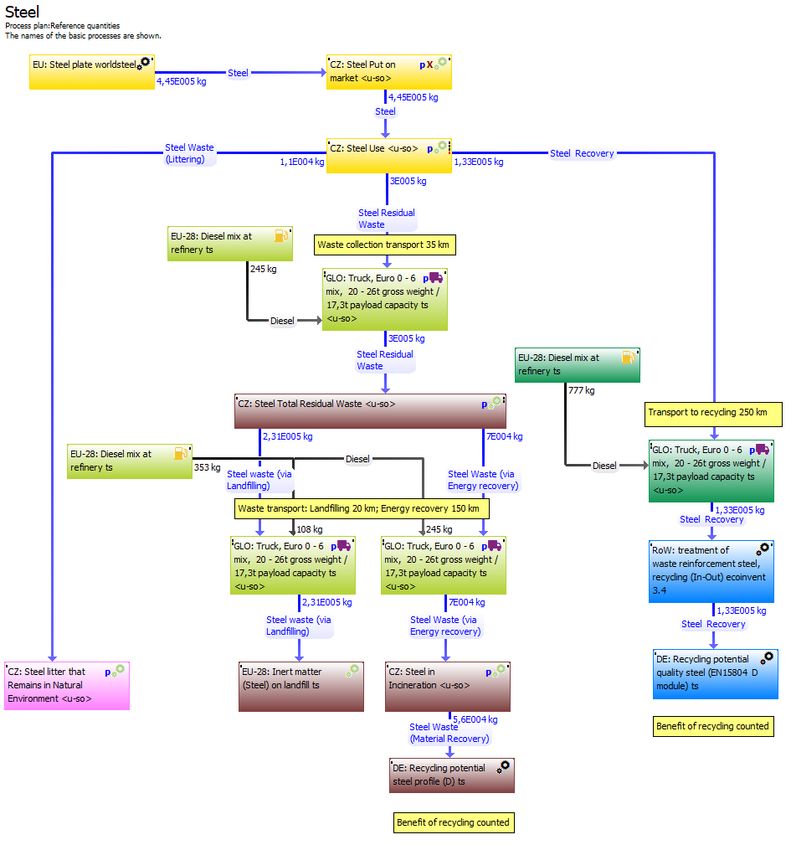
deposit-refund system, for example on the system for waste management or for recycled plastics
within the current waste management system, have not been included into the study because of the
unavailability of verifiable data and with respect to the planned scope of the work. To process such a
LCA, it would have been necessary to acquire additional data the acquisition of which was beyond
the scope of this study.

                                                  8
2 Description of the assessed systems – system boundary
Two systems for the treatment of used beverage packaging made of PET, aluminum and steel sheet
are the subject this assessment of their potential impact.
a) The current system (Baseline), where a bottle used in a non-deposit-refund system is the
subject of waste management and is disposed of either in landfill or used in waste-to-energy
facilities, or recycled and used as waste-to-material. A proportion of bottles enter the
environment in the form of littering.
b) A deposit-refund system (DRS), where a refundable deposit is applied to beverage packaging
and the deposit is refunded upon the return of the packaging. A smaller part of bottles (than
in the Baseline system) is disposed of by landfill, is used in waste-to-energy facilities or enters
the environment in the form of littering.
The basic material flow scheme of both assessed systems is identical, it differed in the amount of
respective flows that end in material or energy utilization or at a landfill site or as litter in the
countryside or public spaces (littering). The groups of operations involved in the system boundaries
are specified in the following scheme. The processes in blue are included in the system boundaries,
the processes in red are not. The processes involved in filling bottles or their distribution to the
customer may be considered the same for both variants, and thus may be excluded from the system
boundaries.
Figure 1 Processes included in the system boundaries
Výroba materiálu
(PET, Al, ocel)
Výroba lahve,
plnění, distribuce ke
spotřebiteli, užití
Svoz a doprava
Recyklace /
Littering Skládkování Energetické využití
materiálové využití
To perform the LCA modelling and assess both systems, the assumption was made that the
implementation of a deposit-refund system would result in a decrease in the amount of littered
9bottles (in the countryside and elsewhere), landfilled bottles and bottles used in waste-to-energy
facilities. It is also assumed that the implementation of the deposit-refund system will increase the
waste-to-material ratio of used bottles, which is depicted in the following figure by the varying width
of arrows, showing the smaller or a larger size of the waste material flow. Changes in the quantities
of the respective flows before and after implementation of a deposit-refund system were defined by
the company Eunomia (see Table 1 and Table 2 in the next section).
Figure 2 Example of changes in material flow sizes after the implementation of DRS (arrow widths are merely indicative).
Výroba materiálu Výroba materiálu
(PET, Al, ocel) (PET, Al, ocel)
Výroba lahve, Výroba lahve,
plnění, distribuce ke plnění, distribuce ke
spotřebiteli, užití spotřebiteli, užití
Svoz a doprava Svoz a doprava
Recyklace / Recyklace /
Littering Skládkování Energetické využití Littering Skládkování Energetické využití
materiálové využití materiálové využití
Baseline (nezálohový systém) DRS (zálohový systém)
103 Definition of the aims and scope of the study
3.1 The aim of the LCA study
This study is intended for the company Karlovarské minerální vody, a.s. and is aimed at helping
determine whether the implementation of a deposit-refund system for beverage bottles would result
in a decrease in the environmental impacts of manufacturing and disposing beverage bottles in the
Czech Republic, and thus whether there would be any sense in implementing a deposit-refund
system from the environmental point of view.
3.2 Definition of the scope of the LCA study
3.2.1 Function of the assessed products
For the purposes of this study, the function of product systems means the provision of materials for
manufacturing beverage packaging and the subsequent treatment of used beverage packaging, incl.
possible waste-to-material or waste-to-energy utilization.
3.2.2 Functional unit
In the LCA studies, a functional unit is a reference value which is used to compare the respective
product system variants. For this LCA study, as our functional unit we selected the treatment of the
amount of PET, aluminum or steel packaging that corresponded with the amount of such packaging
placed on the Czech market over one calendar year.
3.2.3 Time span
The calendar year 2017 was chosen as the time span of this study.
3.2.4 Geographical scope
The geographical scope of the study is not limited by imported raw materials and thus can be
considered global. With respect to the processing of used beverage bottles, it is assumed that bottles
will be processed or disposed of in the Czech Republic. Transport distances considered in the
calculations are detailed below.
3.2.5 Reference flow
The reference flow is represented by the quantity of assessed products necessary for realizing the
functional unit. The following table clearly show the values of respective flows as determined by the
company Eunomia 4 based on the underlying MFA (Mass Flow Analysis) data of the company EKO-
4
Eunomia Research & Consulting, 70 Cowcross Street, London, EC1M 6EJ, United Kingdom,
http://www.eunomia.co.uk/
11KOM a.s., processed by INCIEN, Institut cirkulární ekonomiky, z.ú. These values were subsequently
used for LCA modelling in this study.
Table 1 Reference flow values of particular commodities, Baseline4
Baseline, Flow Weight, Tons PET Steel Al
Market placement 49,446.0 444.5 8,455.0
Total Recycling 32,148.0 133.4 2,536.5
Mixed plastics/Metal 1,148.0 133.4 2,536.5
PET 31,000.0 0.0 0.0
Waste Management 16,068.0 300.1 5,708.2
Waste-to-Energy 2,598.0 69.5 1.322.6
Cement Plant 5,020.0 0.0 0.0
Landfilling 8,450.0 230.6 4,385.6
Littering 1,230.0 11.1 210.3
Table 2 Reference flow values of particular commodities, DRS 4
DRS, Flow Weight, Tons PET Steel Al
Market placement 49,446.0 444.5 8,455.0
Total Recycling 46,324.0 406.0 7,810.9
Mixed plastics/Metal 82.2 406.0 7,810.9
PET 46,241.7 0.0 0.0
Waste Management 3,322.3 40.2 676.9
Waste-to-Energy 722.9 10.4 186.3
Cement Plant 297.1 3.1 5.6
Landfilling 2,302.3 26.7 484.9
Littering 246.0 2.2 42.1
3.3 Applied impact categories
The possible environmental impacts of inventory outputs were expressed by means of the ReCiPe
method, which is currently considered the best designed comprehensive approach for assessing life
12cycle impacts. This study uses the ReCiPe 1.08 characterization model5,6 which compared to the
newer ReCiPe 2016 version, also offers – to a certain extent and with certain level of simplification –
standardization and weighting factors enabling the inter-comparison of results for different impact
categories. The ReCiPe methodology includes inventory data expressed as possible impacts on the
following midpoint and endpoint impact categories. The midpoint evaluation is based on comparing
the effects of respective emissions with a reference substance, and is expressed as kilograms of
equivalents of this reference substance. The endpoint evaluation is based on quantification of
measurable changes in the environment that are considered as unfavorable.
Table 3 Environmental impact categories used in the study. The applied model is ReCiPe 1.08 (E).
Impact Name of Name of Brief description
category endpoint impact midpoint impact
category [unit] category [unit]
Climate Climate change Climate change, The midpoint potential of global warming
changes/Global Ecosystems, default, excl (GWP), which is expressed in kg CO2-eq, is
warming default, excl biogenic carbon the basic indicator of the carbon footprint.
biogenic carbon [kg CO2-Equiv.] The endpoint level involves climate changes
[species.yr] and consequent biodiversity losses
Climate change [species.yr] or increase of damage to human
Human Health, health expressed as Disability-Adjusted Life
default, excl Years (DALY).
biogenic carbon
[DALY]
Fossil fuel Fossil depletion [$] Fossil depletion Fossil fuel depletion is expressed monetarily
depletion [kg oil eq] at the endpoint level (usually in USD) and as
kilograms of oil equivalents at the midpoint
level.
Freshwater Freshwater Freshwater The effects of toxic substances on the
ecotoxicity ecotoxicity ecotoxicity [kg balance of freshwater ecosystems is
[species.yr] 1,4-DB eq] expressed in quantities of biological species
of animals affected in the territory
multiplied by the number of years under
such influence at the endpoint level. At the
midpoint level, ecotoxicity is expressed by
the quantity of kilograms of 1.4-
dichlorobenzene equivalents.
5
Mark A.J. Huijbregts, Zoran J.N. Steinmann, Pieter M.F. Elshout, Gea Stam, Francesca Verones, Marisa Vieira,
Michiel Zijp, Anne Hollander, Rosalie van Zelm. ReCiPe2016: a harmonized life cycle impact assessment method
at midpoint and endpoint level. International Journal of LCA, DOI 10.1007/s11367-016-1246-y.
6
https://www.rivm.nl/en/Topics/L/Life_Cycle_Assessment_LCA/Downloads
13Impact Name of Name of Brief description
category endpoint impact midpoint impact
category [unit] category [unit]
Freshwater Freshwater Freshwater The pollution of freshwater ecosystems by a
eutrophication eutrophication eutrophication [kg surplus of nutrients and biodegradable
[species.yr] P eq] substances – eutrophication – is expressed
in quantities of biological species of animals
affected in the territory multiplied by the
number of years under such influence at the
endpoint level. At the midpoint level, it is
expressed by kilograms of phosphorus
equivalents.
Human toxicity Human toxicity Human toxicity [kg The emission of substances toxic to humans
[DALY] 1,4-DB eq] is expressed as the number of Disability-
Adjusted Life Years (DALY) at the endpoint
level. At the midpoint level, human toxicity is
expressed by the quantity of kg of 1.4-
dichlorobenzene equivalents.
Ionizing Ionizing radiation Ionizing radiation The emission of ionizing radiation is
radiation [DALY] [kg U235 eq] expressed as the number of Disability-
Adjusted Life Years (DALY) at the endpoint
level. At the midpoint level, it is expressed
by kilograms of U235 uranium equivalents.
Metal depletion Metal depletion [$] Metal depletion Metal depletion is expressed monetarily at
[kg Fe eq] the endpoint level (usually in USD) and as
kilograms of metal equivalents at the
midpoint level.
Ozone depletion Ozone depletion Ozone depletion The decomposition of stratospheric ozone is
[DALY] [kg CFC-11 eq] expressed as the number of Disability-
Adjusted Life Years (DALY) at the endpoint
level. At the midpoint level, it is expressed
by kilograms of CFC11 Freon equivalents.
Particulate Particulate matter Particulate matter The adverse impacts of particulate matter
matter formation [DALY] formation [kg formation and its release into the
formation PM10 eq] atmosphere is expressed as the number of
Disability-Adjusted Life Years (DALY) at the
endpoint level. At the midpoint level, it is
expressed by kilograms of PM10 particulate
matter equivalents.
Photochemical Photochemical Photochemical The release of reactive and radical emissions
oxidant oxidant formation oxidant formation into the atmosphere is expressed as the
formation [DALY] [kg NMVOC] number of Disability-Adjusted Life Years
(DALY) at the endpoint level. At the midpoint
level, it is expressed by kilograms of volatile
hydrocarbons (with exclusion of methane).
Terrestrial Terrestrial Terrestrial The effects of acid-forming substances on
acidification acidification acidification [kg the balance of terrestrial ecosystems is
[species.yr] SO2 eq] expressed at the endpoint level in the
number of biological species of animals
affected in the territory multiplied by the
number of years under such influence. At
the midpoint level, terrestrial acidification is
expressed in kilograms of sulfur dioxide
equivalents.
14Impact Name of Name of Brief description
category endpoint impact midpoint impact
category [unit] category [unit]
Terrestrial Terrestrial Terrestrial The effects of toxic substances on the
ecotoxicity ecotoxicity ecotoxicity [kg balance of terrestrial ecosystems are
[species.yr] 1,4-DB eq] expressed at the endpoint level in the
numbers of biological animal species
affected in the territory multiplied by the
number of years under such influence. At
the midpoint level, terrestrial ecotoxicity is
expressed in kilograms of 1,4-
dichlorobenzene equivalents.
Marine - Marine The pollution of marine ecosystems by a
eutrophication eutrophication [kg surplus of nutrients and biodegradable
N-Equiv.] substances is not expressed at the endpoint
level. At the midpoint level, it is expressed
by kilograms of nitrogen equivalents.
Water depletion Water depletion Water depletion is assessed at the midpoint
[m3] level only, and is expressed in m 3 of depleted
water.
3.4 Applied LCA software
Dedicated software and an inventory data database are used for calculations and to model the life
cycles of products or organizations. Professional GaBi 8 7 LCA software was used in this study.
3.5 Assumptions made and limitations on the validity of the study
When making the model for this LCA study, it was necessary to make certain assumptions.
The HDPE PET bottle caps have not been included into the model. This is a material flow that
would operate identically (share the same scenario) in the deposit refund system being
considered as it does in the current state. When comparing the current state and the
deposit-refund system, it is therefore a constant that may be excluded from the assessed
system.
Secondary and tertiary packaging has not been included in the system boundaries, since they
would represent identical items for both the current system and for the deposit-refund
system.
Other partial assumptions related to the respective processes are specified in more detail in
the following section, devoted to inventorying the life cycle. In general, a so-called
conservative approach to the choice of assumptions was selected for the study. By a
conservative attitude, we mean making such assumptions that would rather favor the
7
https://www.thinkstep.com/software/gabi-lca/
15current system, i.e. treatment of used bottles without a deposit-refund system. Assessing the
new alternative – the deposit-refund system – must be done conservatively, i.e. with a
greater degree of caution.
The effect of some assumptions influencing the resulting evaluation of the assessed systems
is described in the following table. The symbol ↘ means that the stated assumption
decreases the resulting values of environmental impacts and it “helps” or “favors” the
system involved in the assessment. The symbol ↗ means that the stated assumption
increases the resulting values of the environmental impacts of the system involved.
Table 4 Effects of some assumptions influencing the resulting values of the environmental indicators of both assessed
systems. The symbol ↗ means that the stated assumption increases the resulting values of the environmental impacts of the
system involved.
Assumption Current Deposit-
system Refund System
(DRS)
Containers for the separate collection of plastics have not been ↘ ↗
included in the system boundaries. Containers for plastics are not
necessary for bottles in the deposit-refund system.
1 paper return ticket for returning 5 pcs of bottles ↘ ↗
Exclusion of the possible impacts of microplastics released into the ↘ ↗
environment from littering
More conservative estimates of transport distances ↘ ↗
In this study, the fact that multicolored PET bottles have limited recycling ability and
secondary use has not been considered. The usability of PET bottles as a secondary raw
material would only increase if single-color (or colorless) PET bottles were used.
The repeated use of PET bottles has not been considered in this study. The model is based
upon processing PET bottles as a secondary raw material that substitutes the primary raw
material. Re-using bottles (repeated filling of bottles with beverages) would result in impact
category indicator achieving even lower results in the case of a deposit-refund system, since
the process that dominates the resulting environmental impacts is the manufacture of PET
materials (as will be explained below).
164 Life cycle inventory analysis
4.1 Data collection
All generic processes used for the LCA modelling derive from the database of the GaBi Professional
Software (thinkstep) and from the Ecoinvent 3.4 database.
Specific material flow values for beverage bottles entering the Czech market and particular waste
management operations, as well as operations related to waste-to-material and waste-to-energy
utilization have been determined by the company Eunomia; see paragraph 3.2.5.
Specific values related to the manufacture and operation of collection facilities (RVM – Reverse
Vending Machine) have been acquired from the manufacturer (Tomra). Other specific information
related to waste collection has been acquired from the organization Pražské služby, a.s. Specific
values for particular processes of the LCA model are stated in the following paragraph, which
describes unit processes.
4.2 Unit processes of the LCA model and specific values of the assumptions made
The LCA model comprises partly general (generic/database) processes and partly processes created
for specific (site specific) operations. Processes that had to be created for this study are described in
more detail in the following paragraphs.
4.2.1 Littering
In the case of PET, littering has not been part of environmental impact assessment since there are no
relevant characterization factors for plastics in the environment (including microplastics) available.
Also, information about the particular adverse effects of microplastics on biota is rare. The amount of
plastics released into the environment has only been inventoried and expressed by weight in this
study. According to the Eunomia data, the implementation of DRS would result in decrease of plastics
released into the environment from 1,230 tons to 246 tons. The implementation of DRS would result
in a decrease of plastics released into the environment from beverage bottles by 80%.
With regard to adding a quantification of the environmental impacts of littering aluminum and sheet
steel bottles, the characterization would be made based on the material composition of bottles
provided by Department of Metals and Corrosion Engineering of UCT Prague8. The aluminum bottle
is made from two alloys. The case is made from Al-Mn (max. approx. 2% Mn) and the cap is Al-Mg
(approx. 3% by weight Mg). With respect to the steel bottle/can, poorer quality steel than stainless
8
doc. Ing. Pavel Novák, Ph.D., Department of Metals and Corrosion Engineering of UCT Prague.
17steel is assumed, i.e. the following composition may be expected in these bottles: 0.05–1% C; 0.2–2%
Mn; to 6% Cr; 0.3–2% Si; to 3% Mo; to 3% V; to 5% Ni; traces of sulfur and phosphorus (usually to
0.01%) and the rest is made by iron. All numbers in % by weight. To characterize environmental
impacts, the assumption was made that 1/3 of weight will be released into agricultural or forest land,
1/3 of weight will be released into industrial land and 1/3 into surface water. The specific values of
elementary flows released by littering into particular environment components are stated in the
following tables.
Table 5 Aluminum bottle littering
Amount of released elementary flow into
the environmental component from 1 kg of
Elementary flow [environmental component] littering, kg
Aluminum [Inorganic emissions to industrial soil] 0.316667
Aluminum [Inorganic emissions to fresh water] 0.316667
Aluminum [Inorganic emissions to agricultural soil] 0.316667
Magnesium [Inorganic emissions to industrial soil] 0.01
Magnesium [Inorganic emissions to fresh water] 0.01
Magnesium [Inorganic emissions to agricultural soil] 0.01
Manganese [Heavy metals to industrial soil] 0.006667
Manganese [Heavy metals to fresh water] 0.006667
Manganese [Heavy metals to agricultural soil] 0.006667
Table 6 Steel bottle littering
Amount of released elementary flow into
the environmental component from 1 kg of
Elementary flow [environmental component] littering, kg
Chromium [Heavy metals to industrial soil] 0.016667
Chromium [Heavy metals to fresh water] 0.016667
Chromium [Heavy metals to agricultural soil] 0.016667
Iron [Heavy metals to industrial soil] 0.273333
Iron [Heavy metals to fresh water] 0.273333
Iron [Heavy metals to agricultural soil] 0.273333
Manganese [Heavy metals to industrial soil] 0.006667
Manganese [Heavy metals to fresh water] 0.006667
Manganese [Heavy metals to agricultural soil] 0.006667
Molybdenum [Heavy metals to industrial soil] 0.01
Molybdenum [Heavy metals to fresh water] 0.01
Molybdenum [Heavy metals to agricultural soil] 0.01
Nickel [Heavy metals to industrial soil] 0.016667
Nickel [Heavy metals to fresh water] 0.016667
Nickel [Heavy metals to agricultural soil] 0.016667
Vanadium [Heavy metals to industrial soil] 0.01
Vanadium [Heavy metals to fresh water] 0.01
18Vanadium [Heavy metals to agricultural soil] 0.01
4.2.2 Transport distances
Conservative transport distances were used in models, which meant using greater distances than
actually expected. Thus, the total concept of the model overvalues the importance of transport
environmental impacts. In the real-life situation, we expect the influence of transport to be lower
than the influence arising from the results of this study. Here, we might as well confirm that, based
on the below-stated results, with respect to LCA, transport distances have no significant influence on
the environmental impacts of the system as a whole, nor therefore on the evaluation and inter-
comparison of both assessed systems (see Section 5.4 Influence of particular technology spheres).
The more conservative estimates for transport distances were especially considered for DRS. Specific
distances applied in calculations for the LCA model are given in the following table.
Table 7 Transport distances applied in calculations for the basic LCA model
Type of transport Current system DRS – deposit-refund
system
Return of bottles by customers – 15 km
Collection of waste in containers 35 km 35 km
Transport to a landfill site 20 km 20 km
Transport for waste-to-energy use (to a 150 km 150 km
waste-to-energy facility, cement plant)
Transport to a collection center 250 km
Transport to a recycling line 200 km 150 km
According to information provided by waste-to-energy plants (ZEVO)9, the collection rounds in
Prague represent approx. 35 km and the collection round is completed twice a day. To transport the
average waste in Prague, a distance of 35 km must be travelled by the collection vehicle. However, in
the Czech Republic, there are regions where waste is transported longer distances (more than 100
km) to a waste incinerator (SAKO Brno).
4.2.3 Return of bottles by customers
More attention should be paid to modelling the method for the transport of used bottles by
consumers to a buyback point. Information regarding people’s average transport distance to
purchase points (especially with respect to the return of bottles) is not available. The variability in
driving distances and the variability in numbers of returned bottles creates significant uncertainty in
9
Ing. Tomáš Baloch, ZEVO Praha Malešice
19the system. To model the deposit-refund system, the following conservative approach has been
adopted:
The driving distance to a buyback point has been given a value of 15 km, which is most probably an
overstated value (conservative approach) since a significant number of people go shopping on foot,
or do the shopping when returning by car from work or during another car drive. The number of
returned bottles in one drive was estimated at 10 pcs. If the number was smaller, inhabitants would
most probably walk when returning the bottles, or do so during another drive past a shop/buyback
point. Since it may be assumed that most drives related to the return of bottles will not be made for
the sole purpose of bottle returning, but also for purposes of shopping, it is necessary to split
(allocate) the transport environmental impacts between the returned bottles and the shopping itself.
To allocate the environmental impacts between the purchased goods and returning of bottles, an
allocation rule based on the ratio of the weight of purchased goods and the weight of returned
bottles has been selected. The weight of bottles has been determined by multiplying the weight of
one bottle by the quantity returned (10 pcs) and the weight of purchased goods has been selected as
30 kg. The weight of 30 kg for purchased goods may be considered as rather low and conservative (a
higher weight of purchased goods would result in a lower allocation of impacts related to bottle
returning in the model). To illustrate, it is worth mentioning that when returning 10 pieces of 1.5L
PET bottles and buying the same quantity of full bottles, the purchased goods will weigh at least
10*1.5 = 15 kg.
4.2.4 Number of containers
The number of containers necessary for collecting a certain quantity of bottles may vary a lot and will
depend on the overall logistics of the system and priorities of involved parties. The necessary number
of containers may also vary significantly depending on consumer behavior, for example, whether
bottles are returned to containers compressed or in their original condition. Containers for separate
collection have not been included in the system boundaries. Because DRS does not use containers for
deposited bottles, this assumption is to the detriment of DRS.
4.2.5 Sorting line/conveyor belt
The sorting line has been modelled as a conveyor belt having a specific energy consumption. Energy
consumption has been determined based on data provided by the company Respono 10, a.s. Annual
energy consumption for sorting has been determined from the known volume of sorted plastics
(2,099 tons in 2016; 2,769.33 tons in 2017), conveyor belt power input (0.55 kW)11, lighting power
10
Zuzana Ambrožová; Respono, a.s., https://www.respono.cz/
11
Conveyor belt 6.0 m CXL6000 HD
20input, and the number of hours of a 2-shift operation for one calendar year. Since the ratio of PET to
the total amount of plastics in separated plastics represents approx. 0.8/(5.7+0.8) = 0.12 12, a value of
12% of electricity consumed for sorting has been assigned to PET.
4.2.6 RVM
The number of machines for the return of bottles (denoted as RVM – Reverse Vending Machine)
necessary to ensure DRS in the Czech Republic is estimated by the company Eunomia at 3.808 pieces.
A reverse vending machine has been modelled based on data given in the following table:
Table 8 Inputs of the unit process for manufacturing a reverse vending machine
Inputs
Parameter Flow Quantity Amount Unit
Polystyrene part (PS) [Plastic parts] Mass 65 kg
Steel sheet 1.5mm hot dip galvan. (0.01mm;1s)
[Metals] Mass 520 kg
Styrene-butadiene-rubber (SBR) [Plastics] Mass 16.5 kg
Glass blocks [Minerals] Mass 16.5 kg
GLO: electronics, for control units [allocatable
product] Mass 32 kg
Outputs
Parameter Flow Quantity Amount Unit
Number of
Reverse vending machine [Assemblies] pieces 1 pcs.
The reverse vending machine is powered by electricity. According to the manufacturer, the RVM
TOMRA T-9 needs 65 W in its sleep mode. A more conservative value of 100 W has been used for
model calculations. Total annual energy consumption is determined at 876 kWh. In comparison with
the value of 525 kWh used in the Norwegian study13 and provided by the RVM manufacturer
Tomra14, this value is higher, i.e. also more conservative. The life cycle of the paper necessary for
printing deposit-refund tickets has been included in the model. A situation in which one ticket is
issued for returning 5 bottles has been used in calculations. Again, this is a conservative estimate and
it may be assumed that customers will return a higher number of bottles in one buyback. This
conservative estimate leads to a higher consumption of paper when returning bottles, and therefore
it increases possible DRS impacts.
12
http://www.nemcicenh.cz/files/zivotni-prostredi/vysledky_rozboru_nemcice_nad-hanou.pdf
13
Hanne Lerche Raadal, Ole Magnus Kålås Iversen and Ingunn Saur Modahl: LCA of beverage container
production, collection and treatment systems. Østfoldforskning, Kråkerøy 2016, ISBN no.: 978 -82-7520-746-1
14
https://www.tomra.com/
214.2.7 Bottle counting and pressing centers
Based on data provided by the organization Eunomia, it will be necessary to build 2 centers
containing 5 counting machines and 2 presses. The values used in creating the LCA processes for the
manufacture of machines for counting and pressing bottles are stated in the following table. The
energy consumption for the manufacture of machines has not been included into the model. The
energy consumption for the operation of machines forms a part of the model.
Table 9 Inputs of the unit process for the manufacture of a machine for counting bo ttles (Counting machine)
Inputs
Parameter Flow Quantity Amount Unit
Aluminum part [Metal parts] Mass 9.831143 kg
Brass component [Metal parts] Mass 1.179737 kg
Cast iron part [Metal parts] Mass 56.17796 kg
Copper sheet [Metals] Mass 0.019803 kg
Nylon 6 part (PA 6) [Plastic parts] Mass 0.983114 kg
Polyester resin (unsaturated; UP) [Plastics] Mass 4.213347 kg
Polyethylene high density part (HDPE/PE-HD) [Plastic
parts] Mass 12.64004 kg
Polyurethane (PU) [Plastics] Mass 4.381881 kg
Polyvinylchloride injection molding part (PVC) [Plastic
parts] Mass 2.808898 kg
Steel billet (20MoCr4) [Metals] Mass 44.38059 kg
Styrene-butadiene-rubber (SBR) [Plastics] Mass 5.140283 kg
Outputs
Parameter Flow Quantity Amount Unit
Number
Counting machine [Assemblies] of pieces 1 pcs.
Table 10 Inputs of the unit process for the manufacture of a machine for counting bottles (Baler machine)
Inputs
Parameter Flow Quantity Amount Unit
Aluminum part [Metal parts] Mass 14.15685 kg
Brass component [Metal parts] Mass 0.786491 kg
Cast iron part [Metal parts] Mass 383.8827 kg
Copper sheet [Metals] Mass 0.013202 kg
Nylon 6 part (PA 6) [Plastic parts] Mass 0.65541 kg
Polyester resin (unsaturated; UP) [Plastics] Mass 1.947503 kg
Polyethylene high density part (HDPE/PE-HD) [Plastic
parts] Mass 5.730152 kg
Polyurethane (PU) [Plastics] Mass 3.295774 kg
Polyvinylchloride injection molding part (PVC) [Plastic
parts] Mass 1.498079 kg
Steel billet (20MoCr4) [Metals] Mass 22.8457 kg
22Inputs
Parameter Flow Quantity Amount Unit
Styrene-butadiene-rubber (SBR) [Plastics] Mass 3.426855 kg
Outputs
Parameter Flow Quantity Amount Unit
Number
Baler machine [Assemblies] of pieces 1 pcs.
4.2.8 Cement Plant
The use of PET in cement plants has been modelled as the substitution of another fuel (brown coal)
based on the energy contents of waste PET material.
4.3 LCA model schemes
Based on the input information, the following life cycle models of the individually assessed scenarios
for non-deposit-refund and deposit-refund systems for the treatment of beverage packaging were
made, and were subsequently used for calculating environmental indicators. Behind each process
illustrated in the figure is a dynamically linked database of environmental impacts that is used for the
calculations. The respective processes are divided into the following groups (distinguished by color)
reflecting their affiliation to a given technology unit. The groups have been established as follows:
Yellow: manufacturing and the use of materials used for manufacturing beverage bottles.
Light green: transport as part of waste management.
Dark green: transport as part of utilizing materials.
Brown: waste management, incl. benefits gained by utilizing waste management outputs
(e.g. waste-to-energy in the case of landfill gases).
Pink: littering.
Light blue: Return of deposited bottles by customers.
Blue: Recycling of bottles.
In the case of the scheme showing operations involved in the deposit-refund system (Figure 9 – DRS
operations), the following colors have been used to illustrate the grouping of the processes involved:
Orange: Manufacture, operation and removal of reverse vending machines, incl. the
manufacture and disposal of paper deposit-refund tickets.
Green: Manufacture, operation and disposal of a sorting station.
23Figure 3 Life cycle scheme of a non-deposit-refund system for PET bottles (PET Baseline)
24Figure 4 Life cycle scheme of a deposit-refund system for aluminum bottles (Aluminum Baseline)
25Figure 5 Life cycle scheme of a deposit-refund system for steel bottles (Steel Baseline)
26Figure 6 Life cycle scheme of a deposit-refund system for PET bottles (PET DRS)
27Figure 7 Life cycle scheme of a deposit-refund system for aluminum bottles (Aluminum DRS)
28Figure 8 Life cycle scheme of a deposit-refund system for steel bottles (Steel DRS)
29Figure 9 Life cycle scheme of operations involved in deposit-refund system operation
304.4 Life cycle inventory analysis outputs – depletion of raw material resources
The life cycle inventory analysis outputs set out data on the demands of the individually assessed
systems on raw material resources and data indicating the quantities of particular substances
emitted to the environment. Since this is a rather large data file and since the consumption values of
energy resources, incl. oil, are of primary significance for this study, only the results for energy raw
materials are stated here. A total summary of the life cycle inventory analysis outputs for the non-
deposit-refund system is given in Annex No. 1 and for the deposit-refund system in Annex No. 2.
Table 11 Life cycle inventory analysis outputs – the consumption of energy raw materials of the non-deposit-refund system
(Baseline)
Mass, kg Baseline Total Aluminum PET Steel
Crude oil (resource) 22,104,181 3,396,228 18,687,597 20,356
Hard coal (resource) 5,838,754 4,318,182 1,209,722 310,850
Lignite (resource) 234,550 674,200 -456,571 16,922
Natural gas (resource) 22,181,382 5,742,149 16,409,089 30,144
Uranium (resource) 304.1 130.4 173.3 0.4
The negative value of lignite consumption in the column for PET bottles is caused by coal savings
resulting from the incineration of PET as a fuel in cement plants.
Table 12 Life cycle inventory analysis outputs – consumption of energy raw materials of the deposit-refund system (DRS)
Mass, kg DRS Total Aluminum DRS PET DRS Steel DRS
Crude oil (resource) 12,422,087 1,483,519 10,913,630 24,939
Hard coal (resource) 2,154,819 87,181 1,890,541 177,096
Lignite (resource) 16,453,129 423,208 15,982,021 47,901
Natural gas (resource) 12,860,215 4,115,522 8,701,839 42,853
Uranium (resource) 183.4 -27.5 210.0 0.9
315 Life cycle impact evaluation
The principle for evaluating environmental impacts when assessing a life cycle lies in converting life
cycle inventory analysis outputs (quantities of consumed raw materials and emitted substances) into
indicators of environmental impact categories. This conversion is done by means of published
characterization factors that meet the selected methodology. The ReCiPe methodology (see Section
3.3 Applied impact categories) has been chosen for this project.
5.1 Life cycle impact evaluation results
The following tables show the resulting values of the impact category indicators of the non-deposit-
refund system (Baseline) and deposit-refund system (DRS). Aggregated results (Total) and the
contributions of particular bottle types (PET, aluminum, sheet steel) are stated for each system in the
table, corresponding to their LCA models. In practice, operating a system separately for particular
bottle types would have no meaning so the contribution values of respective bottle types must be
regarded as approximate.
Table 13 Indicator results of the endpoint and midpoint impact categories of the non-deposit-refund (Baseline) system –
ReCiPe 1.08
Baseline
Aluminum PET Steel
Impact category Total
ReCiPe 1.08 Endpoint (E) - Climate
2.26 0.878 1.36 0.0165
change Ecosystems, default, excl
biogenic carbon [species.yr]
ReCiPe 1.08 Endpoint (E) - Climate
2.27 0.878 1.37 0.0165
change Ecosystems, incl biogenic
carbon [species.yr]
ReCiPe 1.08 Endpoint (E) - Climate
423 165 256 3.0900
change Human Health, default, excl
biogenic carbon [DALY]
ReCiPe 1.08 Endpoint (E) - Climate
426 165 258 3.0900
change Human Health, incl
biogenic carbon [DALY]
ReCiPe 1.08 Endpoint (E) - Fossil 8,260,000 2,070,000 6,150,000 41,900
depletion [$]
ReCiPe 1.08 Endpoint (E) - 0.021 0.0209 0.00004 0.0001
Freshwater ecotoxicity [species.yr]
ReCiPe 1.08 Endpoint (E) -
0.00010 0.00006 0.00004 0.00000
Freshwater eutrophication
[species.yr]
ReCiPe 1.08 Endpoint (E) - Human 185 80 63 41
toxicity [DALY]
ReCiPe 1.08 Endpoint (E) - Ionizing 0.159 0.081 0.078 0.000
radiation [DALY]
ReCiPe 1.08 Endpoint (E) - Metal 515,000 451,000 25,000 38,700
depletion [$]
32Baseline
Aluminum PET Steel
Impact category Total
ReCiPe 1.08 Endpoint (E) - Ozone -0.0001 0.0005 -0.0006 0.0000
depletion [DALY]
ReCiPe 1.08 Endpoint (E) -
28.20 21.10 6.82 0.23
Particulate matter formation
[DALY]
ReCiPe 1.08 Endpoint (E) -
0.0087 0.0046 0.0040 0.0001
Photochemical oxidant formation
[DALY]
ReCiPe 1.08 Endpoint (E) - 0.0047 0.0033 0.0014 0.0000
Terrestrial acidification [species.yr]
ReCiPe 1.08 Endpoint (E) - 0.0270 0.0033 0.0112 0.0126
Terrestrial ecotoxicity [species.yr]
ReCiPe 1.08 Midpoint (E) - Climate
1.21E+08 4.69E+07 7.28E+07 8.81E+05
change, default, excl biogenic
carbon [kg CO2 eq.]
ReCiPe 1.08 Midpoint (E) - Climate
1.21E+08 4.69E+07 7.35E+07 8.82E+05
change, incl biogenic carbon [kg
CO2 eq.]
ReCiPe 1.08 Midpoint (E) - Fossil 5.00E+07 1.25E+07 3.73E+07 2.54E+05
depletion [kg oil eq.]
ReCiPe 1.08 Midpoint (E) -
2.52E+07 2.51E+07 4.97E+04 7.33E+04
Freshwater ecotoxicity [kg 1,4 DB
eq.]
ReCiPe 1.08 Midpoint (E) -
2,290 1,370 914 1
Freshwater eutrophication [kg P
eq.]
ReCiPe 1.08 Midpoint (E) - Human 2.66E+08 1.15E+08 9.05E+07 6.00E+07
toxicity [kg 1,4-DB eq.]
ReCiPe 1.08 Midpoint (E) - Ionizing 9,720,000 4,960,000 4,750,000 10,700
radiation [U235 eq.]
ReCiPe 1.08 Midpoint (E) - Marine 11,000 4,740 6,150 80
eutrophication [kg N eq.]
ReCiPe 1.08 Midpoint (E) - Metal 7,200,000 6,310,000 350,000 541,000
depletion [kg Fe eq.]
ReCiPe 1.08 Midpoint (E) - Ozone 0.608 0.949 -0.339 -0.002
depletion [kg CFC-11 eq.]
ReCiPe 1.08 Midpoint (E) -
108,000 81,300 26,200 891
Particulate matter formation [kg
PM10 eq.]
ReCiPe 1.08 Midpoint (E) -
223,000 117,000 104,000 2,210
Photochemical oxidant formation
[kg NMVOC eq.]
ReCiPe 1.08 Midpoint (E) -
329,000 230,000 96,100 2,850
Terrestrial acidification [kg SO2
eq.]
ReCiPe 1.08 Midpoint (E) -
178,000 22,100 72,700 83,400
Terrestrial ecotoxicity [kg 1,4-DB
eq.]
33Baseline
Aluminum PET Steel
Impact category Total
ReCiPe 1.08 Midpoint (E) - Water 747,000,000 695,000,000 51,700,000 272,000
depletion [m3]
Table 14 Indicator results of the endpoint and midpoint impact categories of the deposit-refund system (DRS) – ReCiPe 1.08
Impact category DRS Total Aluminum DRS PET DRS Steel DRS
ReCiPe 1.08 Endpoint (E) - Climate
change Ecosystems, default, excl 1.530 0.444 1.080 0.010
biogenic carbon [species.yr]
ReCiPe 1.08 Endpoint (E) - Climate
change Ecosystems, incl biogenic 1.540 0.444 1.080 0.010
carbon [species.yr]
ReCiPe 1.08 Endpoint (E) - Climate
change Human Health, default, excl 287 83 202 2
biogenic carbon [DALY]
ReCiPe 1.08 Endpoint (E) - Climate
change Human Health, incl 289 83 203 2
biogenic carbon [DALY]
ReCiPe 1.08 Endpoint (E) - Fossil
5,380,000 1,100,000 4,250,000 33,100
depletion [$]
ReCiPe 1.08 Endpoint (E) -
0.064 0.064 0.000 0.000
Freshwater ecotoxicity [species.yr]
ReCiPe 1.08 Endpoint (E) -
Freshwater eutrophication 0.00029 0.00019 0.00009 0.00000
[species.yr]
ReCiPe 1.08 Endpoint (E) - Human
202 120 74 9
toxicity [DALY]
ReCiPe 1.08 Endpoint (E) - Ionizing
0.0302 -0.0365 0.0663 0.0004
radiation [DALY]
ReCiPe 1.08 Endpoint (E) - Metal
340,000 275,000 41,700 23,300
depletion [$]
ReCiPe 1.08 Endpoint (E) - Ozone
0.001410 0.001430 -0.000022 0.000004
depletion [DALY]
ReCiPe 1.08 Endpoint (E) -
Particulate matter formation 22.500 14.200 8.180 0.160
[DALY]
ReCiPe 1.08 Endpoint (E) -
Photochemical oxidant formation 0.0066 0.0028 0.0037 0.0001
[DALY]
ReCiPe 1.08 Endpoint (E) -
0.0037 0.0021 0.0016 0.0000
Terrestrial acidification [species.yr]
ReCiPe 1.08 Endpoint (E) -
0.0167 0.0073 0.0069 0.0025
Terrestrial ecotoxicity [species.yr]
ReCiPe 1.08 Midpoint (E) - Climate
change, default, excl biogenic 8.18E+07 2.37E+07 5.75E+07 5.55E+05
carbon [kg CO2 eq.]
34Impact category DRS Total Aluminum DRS PET DRS Steel DRS
ReCiPe 1.08 Midpoint (E) - Climate
change, incl biogenic carbon [kg 8.22E+07 2.37E+07 5.79E+07 5.54E+05
CO2 eq.]
ReCiPe 1.08 Midpoint (E) - Fossil
3.26E+07 6.64E+06 2.58E+07 2.01E+05
depletion [kg oil eq.]
ReCiPe 1.08 Midpoint (E) -
Freshwater ecotoxicity [kg 1,4 DB 7.73E+07 7.71E+07 1.60E+05 1.59E+04
eq.]
ReCiPe 1.08 Midpoint (E) -
Freshwater eutrophication [kg P 6,430 4,370 2,050 14
eq.]
ReCiPe 1.08 Midpoint (E) - Human
2.91E+08 1.72E+08 1.06E+08 1.27E+07
toxicity [kg 1,4-DB eq.]
ReCiPe 1.08 Midpoint (E) - Ionizing
1.84E+06 -2.23E+06 4.04E+06 2.23E+04
radiation [U235 eq.]
ReCiPe 1.08 Midpoint (E) - Marine
11,200 3,550 7,610 82
eutrophication [kg N eq.]
ReCiPe 1.08 Midpoint (E) - Metal
4,760,000 3,850,000 584,000 326,000
depletion [kg Fe eq.]
ReCiPe 1.08 Midpoint (E) - Ozone
2.890 2.920 -0.033 0.001
depletion [kg CFC-11 eq.]
ReCiPe 1.08 Midpoint (E) -
Particulate matter formation [kg 8.66E+04 5.45E+04 3.15E+04 6.14E+02
PM10 eq.]
ReCiPe 1.08 Midpoint (E) -
Photochemical oxidant formation 169,000 71,600 95,900 1,730
[kg NMVOC eq.]
ReCiPe 1.08 Midpoint (E) -
Terrestrial acidification [kg SO2 260,000 148,000 110,000 2,130
eq.]
ReCiPe 1.08 Midpoint (E) -
Terrestrial ecotoxicity [kg 1,4-DB 110,000 48,500 45,000 16,800
eq.]
ReCiPe 1.08 Midpoint (E) - Water
419,000,000 377,000,000 41,500,000 414,000
depletion [m3]
When comparing the results of the non-deposit-refund and the deposit-refund systems, it may be
said that the deposit-refund system shows lower environmental impacts in most impact categories,
whereas in some categories it is the non-deposit-refund system that has better results.
The deposit-refund system (DRS) shows lower environmental impacts in the following impact
categories at both the endpoint and midpoint levels:
Climate changes – at the ecosystem level [species.yr] and the human health level [DALY], and
also at the midpoint impact level, such as increasing the greenhouse effect (GWP) [CO 2 eq.]
Fossil fuel depletion
35 Ionizing radiation
Metal depletion
Particulate matter formation
Photochemical oxidant formation
Terrestrial acidification
Terrestrial ecotoxicity
Water depletion
The non-deposit-refund system shows lower environmental impacts in comparison to the deposit-
refund system in the following impact categories:
Human toxicity
Freshwater ecotoxicity
Freshwater eutrophication
Loss of stratospheric ozone
To assist interpretation, the values given in the tables are illustrated in following graphs and the
systems are compared. Since different impact categories have different units and numbers of
different orders, it is not possible to show them all in the same graph (this will be done later in the
text for standardized and weighted results). The following graphs show the results of particular life
cycle scenarios in the respective impact categories. Since the trends among the results of particular
scenarios at midpoint and endpoint levels are similar, only graphs for the endpoint evaluation level
and selected graphs for the midpoint level (GWP, loss of fossil fuel raw materials, water depletion)
are given here. The total values of the non-deposit-refund and deposit-refund systems are marked in
red in the graphs, while the contributions of the respective bottle types (aluminum, PET, steel) are in
blue. Owing to their respective numbers placed on the market, PET and aluminum bottles have a
dominant influence on the total results, whereas steel bottles contribute only marginally to the total
results.
36You can also read