Life Sciences Venture Equity Market Review: The Evolving Role of Crossover Investors - Torreya
←
→
Page content transcription
If your browser does not render page correctly, please read the page content below
Life Sciences Venture Equity Market Review:
The Evolving Role of Crossover Investors
June 2021

Securities offered in the United States are offered through Torreya Capital LLC, Member FINRA/SIPC.
In Europe such services are offered through Torreya Partners (Europe) LLP, which is authorized and regulated by the UK Financial Conduct Authority.
The Market for Equity Privates in Life Sciences

TORREYA | PRIVATE LIFE SCIENCES VENTURE FINANCING MARKET REVIEW – JUNE 2021   2
Total Private Venture Financing Volume: 2000-2021 H1
Given volumes in the first half of this year, there is little doubt that 2021 will shape up to be the most active
year in history for private financing activity in the life sciences sector.

                                                                                  Total Volume of Private Biopharma, Diagnostics and Tools
                                                         50000                         Financing Rounds by Year Jan 2000 - June 2021                                                                           600
                                                                                              (deals over $25mm, excluding medical devices, worldwide)
                                                         45000                                                                                                                                     523
   Aggregate Dollar Volume of Private Financings ($mm)

                                                                                                                                                                                                               500
                                                         40000

                                                         35000
                                                                                                                                                                                       373                     400
                                                                                                                                                                                             356

                                                                                                                                                                                                                     Transaction Count
                                                         30000                                                                                                                                           334

                                                         25000                                                                                                                                                 300

                                                         20000                                                                                                       224         226

                                                                                                                                                                           184                                 200
                                                         15000
                                                                                                                  145                                          138
                                                                                                                                             121    122
                                                                                                                                 109   111
                                                         10000                                                              97                            96
                                                                                              81            88                                                                                                 100
                                                                                                     72
                                                                                       55
                                                         5000             40    35
                                                                   23

                                                             0                                                                                                                                                 0
                                                                 2000 2001 2002 2003 2004 2005 2006 2007 2008 2009 2010 2011 2012 2013 2014 2015 2016 2017 2018 2019 2020 2021
                                                                                                                                                                           H1

                                                                                                                   Transaction Count               Dollar Volume ($mm)

                                                           Source: Torreya analysis and records, CapitalIQ and Crunchbase

TORREYA | PRIVATE LIFE SCIENCES VENTURE FINANCING MARKET REVIEW – JUNE 2021                                                                                                                                                              3
Fresh Venture Capital Flowing into Life Science Sector
We are on track to see record amount raised in life science venture capital in 2021.
Life Sciences Venture Capital Funds – Raised, $Billions
$35
$30 $28.9
New Capital Flowing into Venture Funds ($bn)
$25
$20
$15.4
$15 $14.1
$10.3
$10 $9.1
$7.4 $7.5 $7.5 $7.2
$6.6 $6.8
$5.7 $6.1
$5.5
$5 $3.8 $3.6 $3.9
$2.8 $2.7 $2.6 $2.8
$1.8
$0
2000 2001 2002 2003 2004 2005 2006 2007 2008 2009 2010 2011 2012 2013 2014 2015 2016 2017 2018 2019 2020 2021
H1
Source: Venture fund press releases, Torreya analysis and records, CapitalIQ
TORREYA | PRIVATE LIFE SCIENCES VENTURE FINANCING MARKET REVIEW – JUNE 2021 4Fresh Venture Capital Flowing into Life Science Sector
Over $10 billion flowed into life science venture capital funds in Q2 2021 – an all-time high
Life Science Venture Capital Funds, Amounts Raised by Quarter ($millions)
$12,000
$10,086
$10,000
$8,000 $7,796
$6,875
$6,467
$6,200
$6,000
$5,164
$4,000 $3,608
$2,412
$2,017 $2,180
$2,000 $1,582 $1,633 $1,564
$0
Q2 2018 Q3 2018 Q4 2018 Q1 2019 Q2 2019 Q3 2019 Q4 2019 Q1 2020 Q2 2020 Q3 2020 Q4 2020 Q1 2021 Q2 2021
Source: Venture fund press releases, Torreya analysis and records, CapitalIQ
TORREYA | PRIVATE LIFE SCIENCES VENTURE FINANCING MARKET REVIEW – JUNE 2021 5The Role of Crossover Investors TORREYA | PRIVATE LIFE SCIENCES VENTURE FINANCING MARKET REVIEW – JUNE 2021 6
The Role of Crossover Investors

•    We define crossover investors as late-stage investors that typically participate in the public equity markets but
     “cross over” to the private markets to gain exposure to attractive equity stories prior to an IPO.

•    In practice, the presence of crossover investors can be a major plus in structuring and executing a successful
     IPO. Often, they can reposition or even institutionalize the shareholder profile of a company.

•    “Cross-over” institutions offer implicit support for an IPO and often explicitly in the form of either insider
     commitments or anchor orders at the time of the IPO.

•    Hedge funds are the key drivers of the crossover market. Many of these funds have become large and are
     looking for new ways to deploy capital while earning a return, hence their increasing participation in privates.

•    Most hedge funds are allowed to put 5 - 10% of their capital into private investments. These investments are
     typically held in “side pockets” that are infrequently marked to market. There is substantial discretion on how and
     when such investments get marked to market.

•    Several hedge funds and mutual funds have created dedicated teams or subfunds just for crossover
     investments. For example, Perceptive, RA and RTW have created dedicated venture groups.

•    The crossover market is susceptible to closure in periods of financial uncertainty. Nevertheless, the crossover
     market reestablished itself in 2018. Since 2020 the market has taken off dramatically and activity thus far in 2021
     is unabated.

•    Hedge fund managers in the life science sector are generally very strong scientifically and can often rival the in-
     depth knowledge of their counterparts in long-only funds. Some of the top life science hedge funds have
     substantially more highly qualified staff on hand than perhaps do the largest public funds. By way of example,
     Wellington Management (US) is the largest investor in biotechnology stocks with over $40 billion deployed. They
     have a handful of analysts (one with a Ph.D.). In contrast, Deerfield and Perceptive with less than $8 billion each,
     have far more analysts. RA Capital has an order of magnitude more analysts.

TORREYA | PRIVATE LIFE SCIENCES VENTURE FINANCING MARKET REVIEW – JUNE 2021                                                 7
Investor Types Most Often Seen in Crossover Rounds
Crossover Funds Venture Capital Private Equity China Investors Family Offices
Selected ▪ Adage Capital ▪ Abingworth ▪ General Atlantic ▪ 6 Dimensions ▪ Emerson Collective
Examples ▪ Perceptive ▪ ARCH Venture ▪ GTCR ▪ Decheng Capital (Laurene Powell Jobs)
▪ RA Capital ▪ Forbion ▪ KKR ▪ Legend Capital ▪ Founders Fund (Peter
▪ T. Rowe Price ▪ Orbimed ▪ MVM ▪ Qiming Thiel)
▪ Sofinnova ▪ Invus (Eric Wittouck)
Pros ▪ Highly scientifically ▪ Willing to do mid-stage ▪ A commercial launch ▪ Attracted to very good ▪ Attracted to very good
knowledgeable ▪ Sophisticated and story can work well for stories stories
▪ Less valuation sensitive medically savvy private equity investors ▪ Tend to be less ▪ Interested in financing
▪ Can dictate terms ▪ Can perform due that are at the borderline governance focused and projects that have
▪ Help get an IPO done diligence that others can of venture (pre- are typically constructive medical impact and
▪ Light hand on leverage near closing commercial) and on boards benefit humanity
governance ▪ Many like to lead commercial. ▪ Chinese government ▪ A subset of super high
▪ Supportive and helpful ▪ Collaborative and value ▪ Tend to write larger committed to building net worth investors and
add checks than venture out life sciences associated family offices
▪ Less valuation sensitive understanding can invest $50m or more
than venture into life sciences
companies
Cons ▪ Need to be fairly IPO ▪ Valuation sensitive ▪ Can be distracted and ▪ All China investors are ▪ Not always scientifically
ready (18 months out or ▪ Can be conflicted very busy government-linked to sophisticated and able to
less) ▪ Can have agendas driven ▪ Will often be deep in a some degree. Impacts evaluate opportunities
▪ Distracted. Hard to get by fund life subsector but not as their behavior ▪ Often have idiosyncratic
focused on a story ▪ Slow process scientifically strong as ▪ Negotiating with some taste for investment
▪ Not necessarily ▪ Like control and demand crossovers funds not easy opportunities
committed to future board representation ▪ Don’t like small check ▪ Communication can be ▪ Relationships with
rounds. Less patient. sizes. less direct investor partners
▪ Want to build. important
Key Points ▪ Least valuation sensitive ▪ Gives strong syndicate, ▪ Less valuation sensitive ▪ Very interested in life ▪ Super high net worth
investor type time to prep for IPO than venture but more science space investors play an
▪ Not governance focused ▪ Term sheets from VCs committed to the long ▪ Can be valuation friendly increasingly important
▪ Distracted and not are the easiest to run than crossovers. ▪ Very “brand sensitive” role in financing life
necessarily in for the long generate and can help a ▪ Can be highly committed sciences companies
run. financing process to build-out / add-on ▪ Can be valuation
▪ Does not always need a ▪ Can be tough on terms stories insensitive
lead investor and governance ▪ Relationship focused
TORREYA | PRIVATE LIFE SCIENCES VENTURE FINANCING MARKET REVIEW – JUNE 2021 8Review of Top Life Sciences Crossover Rounds YTD 2021
PreMoney
Value Deal Size Lead
Date Issuer Field Headquarters Series ($mm) ($mm) Investor(s) Investors
Oncology
May-21 Irving, TX -- $7,000 $830.0
Diagnostics
Cell and Gene Tx Boston
Mar-21 C -- $525.0
Companies Area, MA
Low-cost cancer Boston
Jan-21 B $1,070 $500.0
drugs Area, MA
Bay
Mar-21 AI drug discovery C $2,100 $400.0
Area, CA
COVID-19 Boston
Apr-21 C $1,400 $336.0
antibody Area, MA
Sequencing
May-21 Oxford, UK -- $2,500 $270.5
Tools
10 biotechs in Boston
Feb-21 A $519 $250.0
one Area, MA
Chengdu,
Feb-21 Vaccines C $700 $230.0
China
Boston
Jan-21 MAPS Vaccines C $860 $226.0
Area, MA
Apr-21 AI drug discovery Oxford, UK D $861 $225.0
In vivo cancer
Jun-21 Seattle, WA B $450 $210.0
immunotherapy
Bay
Apr-21 Research Tools E $4,000 $200.0
Area, CA
May-21 Research Tools Singapore A $600 $200.0
Difficult targets
May-21 Delaware C $250 $200.0
in cancer
Multicompany New
May-21 -- $7,100 $200.0
Platform York, NY
Jan-21 Cardiometabolic Netherlands A -- $196.0
TORREYA | PRIVATE LIFE SCIENCES VENTURE FINANCING MARKET REVIEW – JUNE 2021 Source: Torreya analysis and records, CapitalIQ, Pitchbook and Crunchbase 9Crossover Venture Financing Volume in Life Sciences
There were 123 crossover financings in biopharma, tools and diagnostics in the first half of 2021.
If current trends persist to year-end, we are on track for $32 billion in crossover privates this year.
Volume of Biopharma, Diagnostics and Tools Crossover Financing Rounds
by Year Jan 2000 - June 2021
(deals over $25mm, excluding medical devices, worldwide)
18000 180
168
Aggregate Dollar Volume of Private Financings ($mm)
16000 160
14000 140
123
12000 120
Transaction Count
10000 100
87
78
8000 72 80
6000 60
46
39
4000 32 40
18
2000 11 12 11 20
7 8 10 8 10 8 8
4 5 4
0 0
2000 2001 2002 2003 2004 2005 2006 2007 2008 2009 2010 2011 2012 2013 2014 2015 2016 2017 2018 2019 2020 2021
H1
Transaction Count Dollar Volume ($mm)
Source: Torreya analysis and records, CapitalIQ and Crunchbase
TORREYA | PRIVATE LIFE SCIENCES VENTURE FINANCING MARKET REVIEW – JUNE 2021 10Crossover Activity Strongly Linked to Market Performance
Crossover investors typically participate in pre-IPO private rounds when the market is doing well.
Number of Biopharma, Diagnostics and Tools Crossover Financing Rounds
by Year Jan 2000 - June 2021
(deals over $25mm, excluding medical devices, worldwide)
180
168
Nasdaq Biotech Index
160
Number of Private Crossover Financings ($mm)
140
123
120
100
87
78
80 72
60
46
39
40 32
18
20 12
10 11 10 11
7 8 8 8 8
4 5 4
0
2000 2001 2002 2003 2004 2005 2006 2007 2008 2009 2010 2011 2012 2013 2014 2015 2016 2017 2018 2019 2020 2021
H1
Transaction Count
Source: Torreya analysis and records, CapitalIQ and Crunchbase
Nasdaq Biotech Index
TORREYA | PRIVATE LIFE SCIENCES VENTURE FINANCING MARKET REVIEW – JUNE 2021 11Crossover Financings Increasingly Important
Over Half of all Life Sciences Venture Capital Today is Being Raised in the Crossover Format
Crossover Financing Rounds as a Percent of All Life Science Venture
Financings by Year, January 2012 - June 2021
(deals over $25mm, excluding medical devices, worldwide)
60%
51%
Percent of Rounds with a Crossover Investor
50%
40% 37% 38%
34% 34%
30%
30%
24% 25%
22%
20% 18%
16%
14% 14%
13% 13%
10% 10%
9% 8% 9%
10% 8%
5%
0%
2000 2001 2002 2003 2004 2005 2006 2007 2008 2009 2010 2011 2012 2013 2014 2015 2016 2017 2018 2019 2020 2021
H1
Source: Torreya analysis and records, CapitalIQ and Crunchbase
The crossover market historically was largely open in very strong bull markets including 2000 and 2004. Starting in 2014 the
market matured, and more public funds built up their capabilities to invest in private, less liquid financings. With the most
recent bull market in the life sciences the activity of public funds in venture capital has been exceptional.
TORREYA | PRIVATE LIFE SCIENCES VENTURE FINANCING MARKET REVIEW – JUNE 2021 12Crossover Financings Activity Slowed Down in Q2 2021
Volume peaked in March 2021 and has been down slightly in recent months. Despite this, the
percent of venture dollars raised via crossovers remains at an all-time high.
Number of Life Sciences Crossover Deals by Dollar Volume of Life Sciences Crossover
Quarter, Jan 2020 to June 2021 Deals by Quarter, Jan 2020 to June 2021
80 73 $12,000
70
Dollar Volume ($mm)
$10,000
55 52
Number of Deals
60
44 $8,000
50
40 33 36 $6,000
30 $4,000
20
$2,000
10
0 $0
Q1 2020 Q2 2020 Q3 2020 Q4 2020 Q1 2021 Q2 2021 Q1 2020 Q2 2020 Q3 2020 Q4 2020 Q1 2021 Q2 2021
Percent of Life Sciences Venture Dollars Percent of Life Sciences Deals Raised via the
Raised in the Crossover Format by Crossover Format by Quarter, Jan 2020 to
Quarter, Jan 2020 to June 2021 June 2021
60% 53.7% 45%
50.7% 38.2%
40%
50% 33.3% 33.5%
42.0% 40.2% 35% 32.0% 31.9% 31.0%
40% 34.1% 36.4% 30%
Percent
Percent
25%
30%
20%
20% 15%
10% 10%
5%
0% 0%
Q1 2020 Q2 2020 Q3 2020 Q4 2020 Q1 2021 Q2 2021 Q1 2020 Q2 2020 Q3 2020 Q4 2020 Q1 2021 Q2 2021
Source: Torreya analysis and records, CapitalIQ and Crunchbase. Deals shown worldwide, exclusive of medical device companies. Transactions under $25mm excluded.
TORREYA | PRIVATE LIFE SCIENCES VENTURE FINANCING MARKET REVIEW – JUNE 2021 1320 Most Active Investors in the Crossover Market in 2021
Count of transactions, January 1, 2021 to June 20, 2021
Deals in 2021 Deals in 2021
Investor Locale (through June 20) Investor Locale (through June 20)
Boston 39 San Francisco 18
Boston 36 San Diego 17
Denver 29 San Francisco 17
New York 26 Zurich 17
New York 25 New York 17
San Francisco 25 New York 17
San Francisco 19 New York 16
New York 19 Baltimore 16
Boston 18 Baltimore 16
New York 18 San Francisco 14
Source: Torreya analysis and records, CapitalIQ and Crunchbase. Deals shown worldwide, exclusive of medical device companies. Transactions under $25mm excluded.
TORREYA | PRIVATE LIFE SCIENCES VENTURE FINANCING MARKET REVIEW – JUNE 2021 14Other Active Investors in the Crossover Market in 2021
January 1, 2021 to June 20, 2021
7 to 13 Transactions 5 to 6 Transactions 3 to 5 Transactions
EcoR1 Capital Avoro Capital NEA Quan Capital Fairmount Funds
Farallon Capital Bain Capital Northpond Ventures Sands Capital Management Flagship Pioneering
GV Catalio Capital Osage University Partners SR One Capital Forbion Capital Partners
Vivo Capital Eventide Pontifax Temasek F-Prime Capital
Wellington Management LifeSci Venture Suvretta 5AM Ventures Gilde Healthcare
Arch Venture Partners Nextech Invest Tekla Capital Abingworth GT Healthcare
Eli Lilly PFM Health Sciences Versant Ventures Acorn Bioventures Intermediate Capital
Octagon Capital Advisors SoftBank ArrowMark Partners Agent Capital Lundbeckfonden Ventures
Deerfield Management TCG Crossover Leaps by Bayer Aisling Capital Lux Capital Management
Foresite Capital Vida Ventures Bristol-Myers Squibb Ally Bridge Group LYFE Capital
Omega Fund Management Woodline Partners CHI Advisors LLC Alta Partners LP M Ventures
Polaris Partners Access Biotechnology Cowen Healthcare Altium Capital Marshall Wace LLP
Ridgeback Capital aMoon Fund Emerson Collective LLC Apeiron Investment Group Novartis Venture Funds
Viking Global Investors CaaS Capital Gilead Asymmetry Capital Parian Global Management
Acuta Capital Partners Franklin Templeton Khosla Ventures Atlas Venture Pavilion Capital
Adage Capital JJDC MPM Capital Atlas Venture L.P. PBM Capital
Novo Holdings Longitude Capital Oxford Innovation CAM Capital Peter Thiel
Soleus Capital Menlo Ventures Presight Capital Commodore Capital Pfizer Ventures
Venrock Partners Mirae Asset Capital Pura Vida Investments Driehaus Capital Pivotal BioVenture
Avidity Partners Monashee Qiming Venture Partners EDBI Point72 Ventures
TORREYA | PRIVATE LIFE SCIENCES VENTURE FINANCING MARKET REVIEW – JUNE 2021 15Does Crossover Participation in a Private Round Help a
Company to Get Public?
Likelihood of Going Public of Cohort of Life Sciences Companies that Did a Private Round between
June 2020 and March 2021 (includes going public via IPO, SPAC or Reverse Merger)
Percent of
Percent of Non-
Percent of All Crossover Crossover
Companies Number of Companies Companies
Size of Last Private Round that Later Crossover that Later Other Types of that Later
(4 to 18 months ago) Total Rounds Went Public Rounds Went Public Rounds Went Public
> $500mm 8 50.0% 5 80.0% 3 0%
$150mm to 500mm 35 51.4% 23 56.5% 12 42%
$75mm to 150mm 151 31.1% 88 39.8% 63 19%
$50mm to 75mm 115 13.9% 37 37.8% 78 3%
$25mm to 50mm 175 6.9% 20 15.0% 155 6%
Grand Total 484 20.0% 173 39.9% 311 9%
Average Private Round Size $82 million $112 million $66.6 million
Source: Torreya analysis and records, CapitalIQ and Crunchbase. Life sciences universe globally included. Transactions under $25mm excluded.
Key Observations:
1. Not surprisingly, companies that carried out a crossover round were four times more likely to go
public than those that did not.
2. Companies that carried out a crossover financing had rounds that averaged $112 million in size
versus $66.6 million for non-crossover rounds.
3. Companies that carried out rounds that were under $75 million in size were much less likely to go
public than companies with larger rounds.
TORREYA | PRIVATE LIFE SCIENCES VENTURE FINANCING MARKET REVIEW – JUNE 2021 16June 2021 Biopharma IPOs Listed in the US
Pre-Money Time from
of Last Size of Last Last IPO
Last Round a Private Private Round Deal Valuation Step
IPO Pricing Crossover Financing Round to IPO Size up from Last
Date Target/Issuer Stage – Therapeutic Area Financing? ($mm) ($mm) (days) ($mm) Private Round
06/25/2021 Phase 1 - rare disease Yes $104 $151 106 $238 2.70x
06/24/2021 Phase 2 - oncology Yes $71 $65 226 $100 1.95x
06/24/2021 Phase 2 - neuroscience Yes $374 $125 84 $160 1.30x
06/23/2021 Preclinical - oncology Yes $126 $95 103 $222 1.81x
06/17/2021 Phase 1 - oncology Yes $174 $200 220 $126 1.48x
06/17/2021 Preclinical - cardiology Yes $267 $94 155 $224 1.68x
06/17/2021 Phase 1 - oncology Yes $193 $80 132 $133 1.44x
06/17/2021 Preclinical - oncology Yes $535 $160 112 $243 1.23x
06/17/2021 Phase 2 - neuroscience No $726 $157 106 $225 1.55x
06/16/2021 Preclinical - cardiology No $2,010 $493 458 $425 1.48x
06/11/2021 Preclinical - oncology Yes $221 $125 57 $223 1.40x
Source: Company press releases, SEC Form S-1 and F-1 filings, Torreya calculations. Deals where less than $50 million was raised were excluded.
TORREYA | PRIVATE LIFE SCIENCES VENTURE FINANCING MARKET REVIEW – JUNE 2021 17April and May 2021 Biopharma IPOs Listed in the US
Pre-Money Time from
of Last Size of Last Last IPO
Last Round a Private Private Round Deal Valuation Step
IPO Pricing Crossover Financing Round to IPO Size up from Last
Date Target/Issuer Stage – Therapeutic Area Financing? ($mm) ($mm) (days) ($mm) Private Round
05/27/2021 Phase 3 - renal Yes $519 $245 118 $330 1.82x
05/26/2021 Phase 2 - oncology Yes $162 $130 114 $160 2.76x
05/06/2021 Phase 3 - renal Yes $204 $115 226 $150 1.73x
04/29/2021 Preclinical - oncology Yes $88 $72 128 $120 2.01x
04/29/2021 Preclinical - vaccines Yes $261 $125 43 $111 1.21x
04/22/2021 Phase 1 - oncology Yes $48 $64 231 $125 2.64x
04/22/2021 NDA - neuroscience No $96 $68 868 $80 1.29x
04/15/2021 Phase 1 - rare disease Yes $679 $246 226 $502 4.03x
04/15/2021 Preclinical - oncology Yes $101 $56 113 $153 2.14x
04/08/2021 Phase 3 - GI Yes $91 $55 175 $147 2.95x
04/08/2021 Phase 1 - rare disease Yes $68 $95 122 $94 1.66x
Source: Company press releases, SEC Form S-1 and F-1 filings, Torreya calculations. Deals where less than $50 million was raised were excluded.
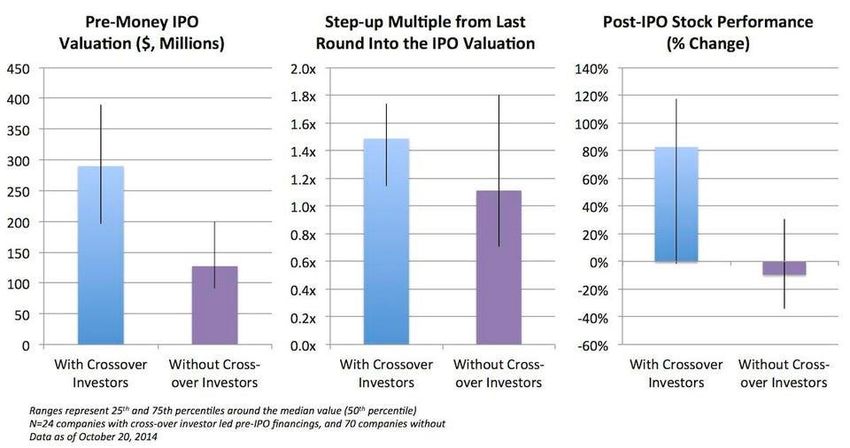
TORREYA | PRIVATE LIFE SCIENCES VENTURE FINANCING MARKET REVIEW – JUNE 2021 18Observations on IPOs and Crossover Investors
The presence of crossover investors is consistently associated with better valuation step-ups
and better after-market performance
2014 Q2 2021
Step-up Multiple from Last Round into
IPO Valuation – Q2 2021
2.5
2
1.5
2.0x
1 1.3x
0.5
0
With Crossover
Without Crossover
Investors
Investors
In 2021, the second and third observations hold as they did in 2014.
Bruce Booth wrote an article on crossover investors Valuation step-ups were higher with crossover investor
in the life sciences and noted that in 2014 the involvement in Q2 2021. While not shown (and data are limited),
presence of these investors was associated with: post-IPO performance was also significantly better. We should
note, however, that of the 22 biotech IPOs in the U.S. in Q2 2021
1. Higher pre-money valuations only 3 did not use crossover investors in their rounds. Two of these
2. Higher step-up multiples from last round to IPO employed family office investors and one went with traditional VC’s
and from its prior round. The shares of the latter company are down
3. Better post-IPO performance more than 60% since deal pricing. Because the two deals with
family office investors came out with high IPO valuations (ATAI and
Lyell) we are not able to say that the crossover format is associated
Source: www.forbes.com/sites/brucebooth/2014/11/07/the-biotech-cross-over-phenom- with higher valuations.
biomarker-of-quality/
Source: Torreya analysis of S-1/F-1 filing data.
TORREYA | PRIVATE LIFE SCIENCES VENTURE FINANCING MARKET REVIEW – JUNE 2021 19Benefits to Public Investors of Participating in a Crossover Round
We have spoken to many crossover investors about the pros and cons of participating in these rounds.
The reasons given in favor of participating are as follows:
Knowledge. Investors thrive on understanding of complex subject matter in the life sciences. Numerous
investors cited the ability to learn about a company and its area with a CDA in place as the top reason for
participating in crossovers. Investors have noted that traditional IPO marketing processes, particularly
during the pandemic, leave precious little time to really under the merits of an investment.
Speed and Certainty. Traditionally crossover investments have involved making illiquid
investments that can be outstanding for years at a time. But the median time from last round to
IPO pricing in 2021 has been 125 days. Because most IPOs take eight months from start to
finish, these rounds are taking place inside the IPO window and thereby are relatively low risk.
Access and Return. While crossover rounds involve higher illiquidity than public investments they
offer public investors relatively low risk step-ups from IPOs – hence excellent returns, on average.
Importantly, it is often difficult to accumulate positions in high quality companies even after an IPO.
Thus, the pre-IPO round facilitates building a position.
TORREYA | PRIVATE LIFE SCIENCES VENTURE FINANCING MARKET REVIEW – JUNE 2021 20Comparison of Approaches to Going Public
Traditional IPO SPAC Merger Reverse Merger
Going public through merger and S-3 filing.
Going public through merger and S-3 filing /
Description Go public through an S-1 filing and marketed sale Target is a special purpose acquiror with no
proxy statement. Target is an operating company
operating history
• Public biotech valuations are at peak levels • Consideration and structure determined at • Can capture cash at a target firm
• Ability to conduct advance investor marketing deal signing • Avoids some costs of IPO
• Optionality in filing publicly and launching • SPAC incentivized to complete a transaction – • Can be synergies with existing programs /
roadshow provides target shareholders leverage in management teams
• Investor base comprised of Top Tier negotiation • Can be “hidden assets” in target firm
institutional investors • Higher potential for shareholder liquidity
• Coverage by market-leading equity research • Substantially faster timetable to closing
Pros compared to IPO
analysts
• Aftermarket trading and liquidity support from • SPAC sponsor may bring ancillary benefits to
UW syndicate target company (experience, credibility,
• IPO process may also catalyze pre-emptive connections, etc.)
strategic interest
• Path to long-term liquidity for existing
shareholders
• Generally executed in stable market • Potential future dilution to SPAC / Sponsor • Limited track record for successful life
environments (VIX < 25) from warrants sciences transactions
• Typically, 20-week process (however, Piper • Deal subject to SPAC shareholder vote • Not easy to get a “good deal” versus an IPO
experience plus sponsor commitment may • Risk SPAC shareholders approve deal but • Lack of sponsorship from either an investor or
accelerate this timetable) redeem their cash preventing purchase price an investment bank
• Market-based pricing mechanism from being funded; sponsor may backstop • Integration cost could be significant
• Punitive failed deal consequences – proxy • Historically, reverses associated with poor
Cons statement and financials are public, yet target post merger returns
remains private • Torreya study shows median 1-year market-
• May have longer-term Lock-up provisions adjusted return following a reverse merger of -
• Typically, a non-fundamental investor base 33% and -59% by year 2
• Limited equity research coverage or
institutional investor awareness
• Limited aftermarket trading & liquidity support
Time to Completion 7 to 9 months 3 months 4 to 6 months
Years of Audited 3 years 2 years 2 years
Financials Needed
TORREYA | PRIVATE LIFE SCIENCES VENTURE FINANCING MARKET REVIEW – JUNE 2021 21About Torreya TORREYA | PRIVATE LIFE SCIENCES VENTURE FINANCING MARKET REVIEW – JUNE 2021 22
Torreya is a Global Healthcare Investment Banking Firm
We have over 50 employees working from offices in New York, London and Mumbai

 We are known for:                            Representative Transaction Work
                                               Mergers &
 •   Deep Relationships                        Acquisitions
     We have strong personal                                          Advisor in its merger       Acquisition of                                                                       Sale of 100%
                                                                                                                                  Sale to                 Acquisition of
     relationships across the                                                 with             generics business of                                                                   equity stake to

     pharmaceutical and
     healthcare sectors.                                                 $1.5 billion             $1.05 billion                                          $225 million            $106 million + milestones
                                                                         October 2020               June 2017                    Pending                September 2020                 March 2021

 •   Operating Perspective                                                    Biotech            Generic Pharma              Specialty Pharma           Specialty Pharma            Specialty Pharma
     Many of our senior
                                               Licensing,
     colleagues come from                      Asset Sales
     industry and bring decades                & JVs                 Sale of FXR program to
                                                                                                      Sale of              License of NOV03 in             License of                 JV Partnership
                                                                                              Intrathecal business to       North America to            Navicixizumab to               in China with
     of experience.

 •   Deal Excellence
                                                                      Up to $470 million           $203 million                                       Up to $306 million               $50 Million
     Torreya is known as a firm                                           January 2015              March 2017                December 2019               January 2020               December 2018

     that gets tough deals done.                                      Asset Sale / Biotech
                                                                                                   Divestiture /
                                                                                                                            Licensing / Biotech        Licensing / Biotech        JV / Specialty Pharma
                                                                                                 Specialty Pharma
     Our team is skilled in highly
                                              Growth
     structured transactions.
                                              Equity,                                                                      Debt recapitalization &
                                                                     Equity investment from
 •   Healthcare Focus                         Structured                                      Sale of majority stake to   acquisition of NextWave
                                                                                                                           Pharmaceuticals from

     Our healthcare focus spans               Financings &                                                                                           Series E equity financing    Equity financing round

                                              PE Recaps
     pharma, biotech,                                                    $200 million              $125 million               $125 million               $104 million                 €44.5 million
     bioproduction, pharma                                               February 2021               April 2019              September 2018                 May 2021                  October 2020

     services, physician services                                       Growth Equity /             PE Recap /                    Debt /                 Growth Equity /                 Equity /
                                                                        Pharma Services              Generics                Specialty Pharma             Diagnostics                    Biotech
     and HCIT.

TORREYA | PRIVATE LIFE SCIENCES VENTURE FINANCING MARKET REVIEW – JUNE 2021                                                                                                                          23
Torreya: Global Presence With 50+ Professionals Focused
on the Life Sciences Sector
• Life Sciences advisory in
Moscow
North America, Europe
London
New York
and Asia
Beijing
Seoul • Focused on strategic
Shanghai Tokyo
transaction and financing
Mexico City Riyadh
transactions
Hong Kong
Mumbai • M+A: Corporate &
asset-level
• Royalty monetizations
Rio de Janeiro
• Licensing
TORREYA
• Acquisition financing
AFFILIATE RELATIONSHIP*
• Recapitalizations
• Structured Debt
• Equity Financings
• 34 people based in New York • We cover Latin America, South Africa and
• 11 people based in London parts of Asia through affiliate relationships
• 5 people based in Mumbai • 3 people cover Japan and China in partnership
with local advisory firms
• 1 person in Tokyo
* Key affiliate partners are Kybora in Africa and MidEast; Novus Capital in Russia; Natixis in China and Korea; Panarea in Latin America; and GCA in Japan.
TORREYA | PRIVATE LIFE SCIENCES VENTURE FINANCING MARKET REVIEW – JUNE 2021 24Strong Capabilities in Arranging Private Equity Capital Raises
Successful Execution of Private Equity Markets Transactions Venture Raises in Principal Investments
Equity investment from
Investor Advisor in Series A Series B
Crossover Pre-IPO Equity financing round Series C Private Equity Raise Crossover Equity Raise
Financing Round Private Equity
Placement
$104 million $200 million €44.5 million $30 million $6 million $100 million
May 2021 February 2021 October 2020 October 2020 March 2021 September 2020
Sale of Equity stake to Series A
Registered direct Disposal of stake in Investment by
Convertible Preferred Equity Capital Raise
common equity offering
Equity Placement
$15 million $68 million $125 million $15 million $14 million
August 2020 May 2020 February 2020 April 2019 January 2019 Pending
Torreya’s team takes on selective equity capital raises for venture stage and growth stage companies and has strong capabilities to place
shares among crossover investors, family offices, private equity groups and venture funds. Our team maintains relationships with several
hundred investors worldwide. In addition, Torreya has an active principal investments area which does not act as placement agent in raises on
its own but has supported a number of recent financings in companies started by Torreya.
TORREYA | PRIVATE LIFE SCIENCES VENTURE FINANCING MARKET REVIEW – JUNE 2021 25Disclaimer
This presentation may not be used or relied upon for any purpose other than as specifically to be construed as a solicitation or an offer to buy or sell any securities or related financial instrument.
contemplated by a written agreement with Torreya. This publication has been prepared for general You should not construe the contents of this presentation as legal, tax, accounting or investment
guidance on matters of interest only and does not constitute professional advice. You should not act advice or a recommendation. Torreya does not provide any tax advice. Any tax statement herein
upon the Information contained in this publication without obtaining specific professional advice. The regarding any U.S. federal or other tax is not intended or written to be used, and cannot be used, by
information used in preparing these materials was obtained from or through public sources. Torreya any taxpayer for the purpose of avoiding any penalties. Any such statement herein was written to
assumes no responsibility for independent verification of such information and has relied on such support the marketing or promotion of the transaction(s) or matter(s) to which the statement related.
information being complete and accurate in all material respects. No representation, warranty or Each taxpayer should seek advice based on the taxpayer's particular circumstances from an
undertaking, express or implied, is made and no responsibility is accepted by Torreya as to or in independent tax advisor. This presentation does not purport to be all-inclusive or to contain all of the
relation to the accuracy or completeness or otherwise of these materials or as to the reasonableness information that the Company may require. No investment, divestment or other financial decisions or
of any other information made available in connection with these materials (whether in writing or actions should be based solely on the information in this presentation.
orally) to any interested party (or its advisors). Torreya will not be liable for any direct, indirect, or
The distribution of these materials in certain jurisdictions may be restricted by law and, accordingly,
consequential loss or damage suffered by any person as a result of relying on any statement
recipients represent that they are able to receive this memorandum without contravention of any
contained in these materials or any such other information. None of these materials, the information
unfulfilled registration requirements or other legal restrictions in the jurisdiction in which they reside or
contained in them, or any other information supplied in connection with these materials, will form the
conduct business. By accepting these materials, the recipient agrees to be bound by the foregoing
basis of any contract. To the extent such information includes estimates and forecasts of future
limitations. Insofar as these materials originate in the United Kingdom or are capable of having an
financial performance (including estimates of potential cost savings and synergies) prepared by or
effect in the United Kingdom (within the meaning of section 21 of the Financial Services and Markets
reviewed and discussed with the managements of the Company and/or other potential transaction
Act 2000) they are directed only at classes of recipient at whom they may lawfully be directed without
participants or obtained from public sources, we have assumed that such estimates and forecasts
contravening that section or any applicable provisions of the Conduct of Business Sourcebook of the
have been reasonably prepared on bases reflecting the best currently available estimates and
Financial Conduct Authority, including persons of a kind described in Article 19 (Investment
judgments of such managements (or, with respect to estimates and forecast obtained from public
professionals) or Article 49 (High net worth companies, unincorporated associations etc.) of the
sources, represent reasonable estimates). There is no guarantee that any of these estimates and
Financial Services and Markets Act 2000 (Financial Promotion) Order 2005 (as amended) and are not
projections will be achieved. Actual results will vary from the projections and such variations may be
intended to be distributed or passed on, directly or indirectly, to or relied or acted on, by any other
material. Nothing contained herein is, or shall be relied upon as, a promise or representation as to the
class of persons. Torreya (Europe) LLP, which is authorised and regulated in the United Kingdom by
past or future. Torreya expressly disclaims any and all liability relating or resulting from the use of this
the Financial Conduct Authority, is not acting for you in connection with any potential transaction(s)
presentation. Torreya assumes no obligation to update or otherwise review these materials. These
described in these materials and thus will not be responsible for providing you the protections
materials have been prepared by Torreya and its affiliates and accordingly information reflected or
afforded to clients of Torreya (Europe) LLP or for advising you in connection with any potential
incorporated into these materials may be shared with employees of Torreya and its affiliates and
transaction(s) as described in these materials except and unless subject to a subsequent specific
agents regardless of location. This presentation speaks only as of the date it is given, and the views
written agreement relating to such potential transaction(s) between you and Torreya (Europe) LLP.
expressed are subject to change based upon a number of factors, including market conditions.
Torreya (Europe) LLP is authorised and regulated by the Financial Conduct
Distribution of this presentation to any person other than the recipient is unauthorized. This material Authority. Securities offered in the United States are offered through Torreya
must not be copied, reproduced, distributed or passed to others at any time without the prior written
Capital LLC, Member FINRA/SIPC.
consent of Torreya. This presentation has been prepared solely for informational purposes and is not
TORREYA | PRIVATE LIFE SCIENCES VENTURE FINANCING MARKET REVIEW – JUNE 2021 26You can also read