Light Economic Development Plan Economic Analysis Report - Light Regional Council
←
→
Page content transcription
If your browser does not render page correctly, please read the page content below
Light Economic Development Plan
Economic Analysis Report

Prepared for

Light Regional Council

April 2020

lucid
                                                                                                          /’lu:sid/
                                                                                                         adjective
                                               1. expressed clearly; easy to understand
                                                                                  2. bright or luminous

Document Control
Job Name:                   Light Economic Development Plan

Client:                     Light Regional Council

Client Contact:             Kieren Chappell

Version Control
 Version                     Date                      Authorisation
 Draft v1                    5/07/2019                 MC
 Draft v2                    30/04/2020                MC

 Disclaimer:
 While every effort has been made to ensure the accuracy of this document, Lucid Economics Pty Ltd is unable to make
 any warranties in relation to the information contained herein. Lucid Economics Pty Ltd, its employees and agents
 accept no liability for any loss or damage that may be suffered as a result of reliance on this information, whether or
 not there has been any error, omission or negligence on the part of Lucid Economics Pty Ltd, its employees or agents.
 Any forecasts or projections used in the analysis and relied upon for any findings can be affected by a number of
 unforeseen or unknown variables, and as such no warranty is given that a particular set of results will in fact be
 achieved or realised.

                                                                                                                           i
LIGHT Economic Analysis – Background Report

Executive Summary
Introduction
Lucid Economics has been engaged by Light Regional Council to deliver the Light Economic
Development Plan.
This report represents the economic analysis portion of the project and provides an in-depth analysis
of the local economy and foundation for future economic development activities.

Population
Population growth is important as it drives economic growth across approximately one-third of the
economy. Population growth for the Light region has slowed significantly since the early-2000s, to
be just 0.1% in 2019. While this trend is in line with regional and state trends, lower population
growth rates mean that the economy must be supported in other areas for growth.
Historical analysis has shown that when the economy increases, new jobs are created, which
provide a catalyst for population growth.
Figure E.1. Historical Population
                                     Light (lha)                  Light (rha)
                                     RDA BGLAP (rha)              South Australia (rha)
                     18,000                                                                      6%

                     15,000                                                                      5%

                     12,000                                                                      4%

                                                                                                      Population growth
  Population (no.)

                      9,000                                                                      3%

                      6,000                                                                      2%

                      3,000                                                                      1%

                         0                                                                       0%
                              2003       2007          2011           2015                2019
Source: ABS (2020a).

                                                                                                                          ii
LIGHT Economic Analysis – Background Report
Economic development is about raising the standard of living for all residents
Household income levels are the best available indicator for standard of living and/or community
wellbeing for residents. Economic development should seek to increase the median household
income level over time. In addition to being above the South Australian average, the Light region’s
median household income has increased at a level above inflation, indicating increasing standards
of living.
Table E.1. Median Income
2006 2011 2016
Personal income ($/week)
Light $465 $571 $669
South Australia $433 $534 $600
Household income ($/week)
Light $1,075 $1,276 $1,462
South Australia $885 $1,042 $1,204
Source: ABS (2017).
Economy
The Light regional economy has undergone significant periods of volatility that have been followed
by periods of stagnation. The main driver of this volatility has been the region’s agriculture and
construction industries, due to changes in local weather patterns, and slowing population growth.
Figure E.2. Gross Regional Product, Light
$1,000 10%
$800 8%
Gross Regional Product ($m)
$600 6%
Annual Growth (%)
$400 4%
$200 2%
$0 0%
-$200 -2%
-$400 -4%
-$600 -6%
-$800 -8%
Light Region ($m) Light Region (%)
RDA BGLAP (%) South Australia (%)
Source: Economy.id (2020).
iiiLIGHT Economic Analysis – Background Report
Figure E.3. Industry Value-Add, 2018-19
Manufacturing
Agriculture, Forestry and Fishing
Education and Training
Construction
Wholesale Trade
Health Care and Social Assistance
Retail Trade
Transport, Postal and Warehousing
Professional, Scientific and Technical Services
Accommodation and Food Services
Mining
Public Administration and Safety
Other Services
Administrative and Support Services
Information Media and Telecommunications
Electricity, Gas, Water and Waste Services Light
Rental, Hiring and Real Estate Services RDA BGLAP
Financial and Insurance Services South Australia
Arts and Recreation Services
0% 5% 10% 15% 20% 25% 30% 35%
% of Total
Source: Economy.id (2020).
Figure E.4. Industry Value-Add, Top Six Industries, Light
$250
$200
$150
$m
$100
$50
$0
Manufacturing Agriculture, Forestry and Fishing
Education and Training Construction
Wholesale Trade Health Care and Social Assistance
Source: Economy.id (2020).
ivLIGHT Economic Analysis – Background Report
Labour Force
The Light region has a considerably lower unemployment rate than the South Australian average,
however with the region’s labour force growing at a slower rate than population growth recently, in
addition to the ageing nature of the region’s population, it is likely that the participation rate in the
region is in decline. In particular, the slowing rate of population growth will have implications for
more population-dependent industries, such as construction and education, which are key
employment industries in the region.
Figure E.5. Labour Force and Unemployment Rates
Light employment (No.) Light labour force (No.)
Light (%) RDA BGLAP (%)
South Australia (%)
9,000 9%
8,000 8%
Employment / Labour force (no.)
7,000 7%
Unemployment rate (%)
6,000 6%
5,000 5%
4,000 4%
3,000 3%
2,000 2%
1,000 1%
0 0%
Dec-10 Dec-11 Dec-12 Dec-13 Dec-14 Dec-15 Dec-16 Dec-17 Dec-18 Dec-19
Source: DESSFB (2019).
Figure E.6. Employment by Industry, Light
Other Services 2008-09
Arts and Recreation Services 2013-14
Health Care and Social Assistance 2018-19
Education and Training
Public Administration and Safety
Administrative and Support Services
Professional, Scientific and Technical Services
Rental, Hiring and Real Estate Services
Financial and Insurance Services
Information Media and Telecommunications
Transport, Postal and Warehousing
Accommodation and Food Services
Retail Trade
Wholesale Trade
Construction
Electricity, Gas, Water and Waste Services
Manufacturing
Mining
Agriculture, Forestry and Fishing
0% 5% 10% 15% 20% 25% 30%
Employment by industry (% of total)
Source: Economy.id (2020).
vLIGHT Economic Analysis – Background Report
Future Growth Opportunities
This analysis has considered a number of economic and industry factors as well as workforce and
other related economic indicators in evaluating the local economy. It has identified a range of
competitive advantages as well as a range of economic development opportunities. The analysis has
indicated that there are a number of future economic development growth opportunities for the
Light region in the following industries:
• Healthcare
• Agriculture
• Beverage and tobacco product manufacturing
• Professional, scientific and technical services
• Tourism
It will be important for Light Regional Council to consider how it can influence these sectors to grow
into the future.
Next Steps
Light Regional Council will need to consider this analysis in terms of how it approaches economic
development into the future. It is clear that the Council has a number of challenges as well as a
number of distinct opportunities.
This analysis will be discussed with a range of stakeholders as part of the formulation of the
Economic Development Plan for the Light region and provides a strong evidence base for the
development of the plan.
viLIGHT Economic Analysis – Background Report
Table of Contents
Executive Summary...................................................................................................................... ii
Table of Contents ....................................................................................................................... vii
1. Introduction ............................................................................................................................ 1
2. Population and Demographics ................................................................................................. 2
2.1 Population ............................................................................................................................... 2
2.2 Age ........................................................................................................................................... 3
2.3 Income ..................................................................................................................................... 4
2.4 SEIFA ........................................................................................................................................ 4
3. Economy ................................................................................................................................. 6
3.1 Size and Structure of the Economy ......................................................................................... 6
4. Employment and Skills .......................................................................................................... 12
4.1 Labour Force and Unemployment......................................................................................... 12
4.2 Employment .......................................................................................................................... 13
4.2.1 Part-time and Full-time Work ................................................................................................... 15
4.2.2 Underemployment .................................................................................................................... 16
4.3 Journey to Work .................................................................................................................... 16
4.4 Skills ....................................................................................................................................... 18
4.5 Value of Employment ............................................................................................................ 21
5. Tourism ................................................................................................................................ 22
6. Property ............................................................................................................................... 23
7. Competitive Advantages and Opportunities ........................................................................... 24
8. Summary .............................................................................................................................. 30
References................................................................................................................................. 31
viiLIGHT Economic Analysis - Background Report
1. Introduction
Lucid Economics Pty Ltd (Lucid Economics) has been engaged to deliver the Light Economic
Development Plan on behalf of Light Regional Council.
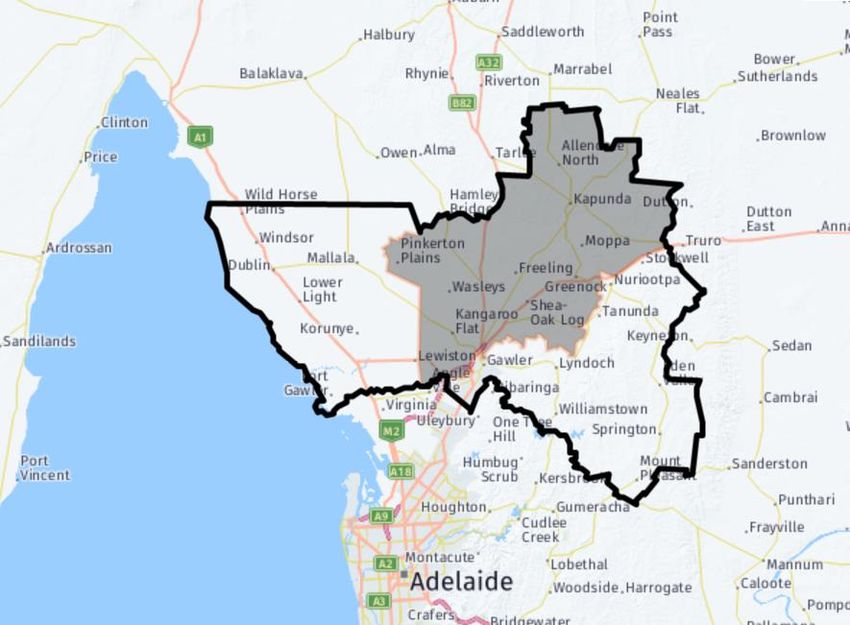
Light Regional Council is located approximately 75km north of the Adelaide CBD. The Council
encompasses 1,278 square kilometres and includes the western ridge of the Barossa Valley. It is
primarily known for its mining heritage and premier farming land. Key townships within the Council
region include Kapunda, Freeling, Greenock, Roseworthy and Wasleys.
Figure 1.1. Light Regional Council and RDA BGLAP Region
Source: Economy.id (2020).
This report provides an in-depth analysis of the local economy and a strong basis for the consultation
and strategy development phase of the project.
1LIGHT Economic Analysis - Background Report
2. Population and Demographics
2.1 Population
The Light region had an estimated resident population of 15,359 in 2019, up 0.1% from 2018. The
Light region’s population has slowed considerably since the early 2000s, averaging growth of 1.0%
per annum over the past five years, having grown at an average annual rate of 2.1% the decade
prior. While population growth has also trended lower since the early 2000s in the RDA BGLAP
region and South Australia, Light region’s population growth has fallen below the RDA BGLAP rate
and the South Australian average in 2019, having been higher than both regions for the majority of
the previous 15 years.
Figure 2.1. Historical Population
Light (lha) Light (rha)
RDA BGLAP (rha) South Australia (rha)
18,000 6%
15,000 5%
12,000 4%
Population growth
Population (no.)
9,000 3%
6,000 2%
3,000 1%
0 0%
2003 2007 2011 2015 2019
Source: ABS (2020a).
South Australia’s Department of Planning, Transport and Infrastructure (DPTI) projects the Light
region’s population growth to continue to slow out to the year 2036 (Figure 2.2). The Light region’s
population growth is forecast to remain below the RDA BGLAP average, but above the South
Australian average out to the year 2036, remaining between 1.2% and 1.3% per year.
2LIGHT Economic Analysis - Background Report
Figure 2.2. Projected Population
Light (lha) Light (rha)
RDA BGLAP (rha) South Australia (rha)
20,000 1.8%
1.6%
Average annual population growth
16,000
1.4%
1.2%
Population (no.)
12,000
1.0%
0.8%
8,000
0.6%
0.4%
4,000
0.2%
0 0.0%
2019 2021 2026 2031 2036
Source: ABS (2020a), DPTI (2019).
2.2 Age
The Light region exhibits similar median age characteristics to the South Australian average (Table
A). However, the rate of ageing in the Council area is marginally faster than that of the broader state
over the decade to 2016.
Table A. Median Age
2006 2011 2016
Light Region 36 38 39
South Australia 39 39 40
Source: ABS (2017).
Consistent with the rising median age in the Light region over the past 10 years, the area is projected
to see a rapid increase in the proportion of residents aged 65 years out to the year 2036, moving
from 13.8% of the total population in 2016 to 22.4% by 2036 (Figure 2.3).
On a total numbers basis, residents aged 65 years and over are expected to increase by 2,250
residents between 2016 and 2036, more than doubling of this population cohort over 2016 levels.
3LIGHT Economic Analysis - Background Report
Figure 2.3. Projected Age Structure, Light Region
25%
2016 2021 2026 2031 2036
20%
% of Population
15%
10%
5%
0%
0-14 15-24 25-34 35-44 45-54 55-64 65+
Source: DPTI (2019).
2.3 Income
The Light region’s median weekly personal and household income levels were both higher than the
state medians in 2016.
Median household income is an important measure for standard of living. The measure has
increased at a faster rate than inflation (ABS, 2019c) over the past decade in the Light region,
providing real income gains for residents.
Table B. Median Income
2006 2011 2016
Personal income ($/week)
Light Region $465 $571 $669
South Australia $433 $534 $600
Household income ($/week)
Light Region $1,075 $1,276 $1,462
South Australia $885 $1,042 $1,204
Source: ABS (2017).
2.4 SEIFA
The image below (Figure 2.4) shows a mix of areas within in terms of their standing in the ABS’s
Index of Relative Socio-Economic Advantage and Disadvantage (SEIFA).
While there are a number of regions in the 4th quintile, there are also a number of regions in the
bottom two quintiles of the Index.
4LIGHT Economic Analysis - Background Report
Figure 2.4. Index of Relative Socio-Economic Advantage & Disadvantage (by SA1), Light Regional Council
(2016)
Source: ABS (2018).
5LIGHT Economic Analysis - Background Report
3. Economy
3.1 Size and Structure of the Economy
The Light region’s Gross Regional Product (GRP) was $828 million in 2018-19, down 6% from the
previous year.
The region’s economic growth has been volatile since the early 2000s, however the area has
recorded stronger average annual growth (2.9%) than the RDA BGLAP (1.8%) and South Australian
(1.3%) averages over the past five years.
This volatility in large part is due to the region’s reliance on the local agriculture, forestry and fishing
industry (the region’s second largest industry), which is susceptible to changes in local weather
patterns.
The construction industry has also contributed to volatility in the local economy, likely driven by
slowing population growth in the region.
Figure 3.1. Gross Regional Product, Light Region
$1,000 10%
$800 8%
Gross Regional Product ($m)
$600 6%
Annual Growth (%)
$400 4%
$200 2%
$0 0%
-$200 -2%
-$400 -4%
-$600 -6%
-$800 -8%
Light Region ($m) Light Region (%)
RDA BGLAP (%) South Australia (%)
Note: Year-ending June data.
Source: Economy.id (2020).
The largest industries by Industry Value-Add (IVA) in the Light region in 2018-19 were:
• Manufacturing;
• Agriculture, forestry and fishing;
• Education and training;
• Construction; and
• Transport, postal and warehousing.
Manufacturing was the largest industry in the Light region in 2018-19, with non-metallic mineral
product manufacturing and beverage and tobacco product manufacturing being the region’s key
manufacturing sub-industries.
The manufacturing industry has grown strongly in recent years (particularly the non-metallic mineral
product manufacturing sub-industry), supported by a lower Australian dollar since the mining boom.
6LIGHT Economic Analysis - Background Report
Agriculture is another key sub-industry in the region, with livestock slaughterings, cereal crops and
grapes being the leading agricultural commodities produced by value in 2015-16.
Construction is the fourth largest sector in the Light region, however the industry has been in decline
in recent years, consistent with slowing population growth.
Figure 3.2. Industry Value-Add, 2018-19
Manufacturing
Agriculture, Forestry and Fishing
Education and Training
Construction
Wholesale Trade
Health Care and Social Assistance
Retail Trade
Transport, Postal and Warehousing
Professional, Scientific and Technical Services
Accommodation and Food Services
Mining
Public Administration and Safety
Other Services
Administrative and Support Services
Information Media and Telecommunications
Electricity, Gas, Water and Waste Services Light
Rental, Hiring and Real Estate Services RDA BGLAP
Financial and Insurance Services South Australia
Arts and Recreation Services
0% 5% 10% 15% 20% 25% 30% 35%
% of Total
Source: Economy.id (2020).
Figure 3.3. Industry Value-Add, Top Six Industries, Light Region
$250
$200
$150
$m
$100
$50
$0
Manufacturing Agriculture, Forestry and Fishing
Education and Training Construction
Wholesale Trade Health Care and Social Assistance
Source: Economy.id (2020).
7LIGHT Economic Analysis - Background Report
Figure 3.4. Industry Value-Add by Manufacturing Sub-Sector, 2018-19
Non-Metallic Mineral Product
Fabricated Metal Product
Food Product
Beverage & Tobacco Product
Basic Chemical & Chemical Product
Machinery and Equipment
Wood Product
Furniture & Other
Petroleum & Coal Product
Primary Metal & Metal Product
Textile, Leather, Clothing & Footwear
Polymer Product & Rubber Product
Pulp, Paper & Paper Product Light
Printing (incl. Recorded Media) RDA BGLAP
Transport Equipment South Australia
0% 2% 4% 6% 8% 10% 12% 14%
Industry value-add (% of Total)
Source: Economy.id (2020).
Figure 3.5. Industry Value-Add by Sub-Industry, Light Region
$180
$160
$140
$120
$100
$m
$80
$60
$40
$20
$0
2008-09 2009-10 2010-11 2011-12 2012-13 2013-14 2014-15 2015-16 2016-17 2017-18 2018-19
Agriculture Non-Metallic Mineral Product Manufacturing
Preschool and School Education Fabricated Metal Product Manufacturing
Food Product Manufacturing Construction Services
Beverage and Tobacco Product Manufacturing
Source: Economy.id (2020).
8LIGHT Economic Analysis - Background Report
Figure 3.6. Value of Agricultural Production, 2015-16, Light Region
Livestock slaughterings
Eggs
Milk
Wool
Nuts
Other fruit
Grapes (wine and table)
Citrus fruit
Vegetables
Crops for Hay
Nurseries & cut flowers
Other broadacre crops
Cereal crops
$0 $20 $40 $60 $80
Value ($M)
Source: Economy.id (2020).
The Light region’s economy is dominated by small businesses (98% of all businesses have 19
employees or fewer) (Figure 3.7). This structure is similar to most local economies in Australia.
The top three industries by number of businesses (agriculture, forestry and fishing, construction and
rental, hiring and real estate services) are typical industries where there is a great number of
individual traders and small businesses.
Business Counts from the ABS
It is important to keep in mind that this data reflects the registered business address of companies
(only), so larger businesses such as Coles, Woolworths and other major retail businesses may not
be captured in the data. Furthermore, the ABS excludes sole traders and focuses on businesses
with active ABNs that are registered for GST. This methodology usually underestimates the total
number of businesses in a local economy, specifically many of the sole traders and/or home-
based businesses.
9LIGHT Economic Analysis - Background Report
Figure 3.7. Business Counts, Light Region, 2019
0%
2%
Non employing
34%
1-19 Employees
20-199 Employees
64%
200+ Employees
Note: Location based on registered address of businesses.
Source: ABS (2020b)
Figure 3.8. Business Counts, by Industry, Light Region, 2019
Agriculture, Forestry and Fishing
Mining
Manufacturing
Electricity, Gas, Water and Waste Services
Construction
Wholesale Trade
Retail Trade
Accommodation and Food Services
Transport, Postal and Warehousing
Information Media and Telecommunications
Financial and Insurance Services
Rental, Hiring and Real Estate Services
Professional, Scientific and Technical Services
Administrative and Support Services
Public Administration and Safety
Education and Training
Health Care and Social Assistance
Arts and Recreation Services
Other Services
Currently Unknown
0 50 100 150 200 250 300 350 400 450
Non employing 1-19 Employees 20-199 Employees 200+ Employees
Source: ABS (2020b).
10LIGHT Economic Analysis - Background Report
Figure 3.9. Business Counts, by Industry, 2018
Agriculture, Forestry and Fishing
Construction
Rental, Hiring and Real Estate Services
Manufacturing
Professional, Scientific and Technical Services
Transport, Postal and Warehousing
Other Services
Financial and Insurance Services
Retail Trade
Accommodation and Food Services
Wholesale Trade
Health Care and Social Assistance
Administrative and Support Services
Arts and Recreation Services
Public Administration and Safety
Education and Training
South Australia
Mining
RDA BGLAP
Information Media and Telecommunications Light
Electricity, Gas, Water and Waste Services
0% 10% 20% 30%
% of total businesses
Source: Economy.id (2020).
11LIGHT Economic Analysis - Background Report
4. Employment and Skills
4.1 Labour Force and Unemployment
The Light region’s labour market conditions have consistently been stronger than the South
Australian average. Further, while the region’s unemployment rate has increased marginally over
the last few quarters, employment has been growing. In December quarter 2019, the Light region’s
unemployment rate was 3.6%, below the RDA BGLAP region (4.2%) and South Australian (6.3%)
(Figure 4.1).
In the year to December, the region added 266 jobs (an increase of 3.3%). Since 2010, employment
has increased an average of 107, demonstrating the strong growth of local employment over the last
year.
Labour Force and Unemployment Data
These data sets are from the Department of Employment, Skills, Small and Family Business
(DESSFB) and track the number of people in the labour force (total), employed and unemployed.
This data is based on place of residence, which differs from the analysis above regarding Gross
Regional Product/Industry Value Add as well as the analysis below regarding employment, which
focuses on data based on place of work. For the labour force survey, the definition of ‘employed’
includes all persons aged 15 years and over who worked for one hour or more during the
reference week.
Figure 4.1. Labour Market Conditions
Light employment (No.) Light labour force (No.)
Light (%) RDA BGLAP (%)
South Australia (%)
9,000 9%
8,000 8%
Employment / Labour force (no.)
7,000 7%
Unemployment rate (%)
6,000 6%
5,000 5%
4,000 4%
3,000 3%
2,000 2%
1,000 1%
0 0%
Dec-10 Dec-11 Dec-12 Dec-13 Dec-14 Dec-15 Dec-16 Dec-17 Dec-18 Dec-19
Source: DESE (2020).
12LIGHT Economic Analysis - Background Report
4.2 Employment
Manufacturing has remained the leading employing industry in the Light region over the past
decade, providing almost 25% of the region’s jobs in 2018-19.
In terms of total numbers, the majority of growth has come from the manufacturing (465) and retail
(229) and education (141) industries over the five years to 2018-19, accounting for 75% of total job
growth over the period.
The proportion of jobs within the agriculture, forestry and fishing industry has fallen sharply over the
past decade, but still remains the second leading employing industry in the region in 2018-19.
Figure 4.2. Employment by Industry, Light Region
Other Services 2008-09
Arts and Recreation Services 2013-14
Health Care and Social Assistance 2018-19
Education and Training
Public Administration and Safety
Administrative and Support Services
Professional, Scientific and Technical Services
Rental, Hiring and Real Estate Services
Financial and Insurance Services
Information Media and Telecommunications
Transport, Postal and Warehousing
Accommodation and Food Services
Retail Trade
Wholesale Trade
Construction
Electricity, Gas, Water and Waste Services
Manufacturing
Mining
Agriculture, Forestry and Fishing
0% 5% 10% 15% 20% 25% 30%
Employment by industry (% of total)
Source: Economy.id (2020).
13LIGHT Economic Analysis - Background Report
Figure 4.3. Employment growth (no.), Light Region
Other Services 2013-14
Arts and Recreation Services
2018-19
Health Care and Social Assistance
Education and Training
Public Administration and Safety
Administrative and Support Services
Professional, Scientific and Technical Services
Rental, Hiring and Real Estate Services
Financial and Insurance Services
Information Media and Telecommunications
Transport, Postal and Warehousing
Accommodation and Food Services
Retail Trade
Wholesale Trade
Construction
Electricity, Gas, Water and Waste Services
Manufacturing
Mining
Agriculture, Forestry and Fishing
-200 0 200 400 600
5 Year Employment Growth (no.)
Source: Economy.id (2020).
Figure 4.4. Employment growth (%), Light Region
Other Services 2013-14
Arts and Recreation Services 2018-19
Health Care and Social Assistance
Education and Training
Public Administration and Safety
Administrative and Support Services
Professional, Scientific and Technical Services
Rental, Hiring and Real Estate Services
Financial and Insurance Services
Information Media and Telecommunications
Transport, Postal and Warehousing
Accommodation and Food Services
Retail Trade
Wholesale Trade
Construction
Electricity, Gas, Water and Waste Services
Manufacturing
Mining
Agriculture, Forestry and Fishing
-50% 0% 50% 100% 150% 200%
5 Year Employment Growth (%)
Source: Economy.id (2020).
14LIGHT Economic Analysis - Background Report
4.2.1 Part-time and Full-time Work
Between 2011 and 2016, there was a 1.5 percentage points (ppt) shift between part-time work and
full-time work in the Light region. The ABS defines part-time work as working less than 35 hours in
one week and full-time work as working 35 hours or more.
The casualisation of the workforce is a trend that is taking place at the state and national level at a
much higher rate than in the Light region. Manufacturing is the key employing industry in the region,
and also the industry with the highest proportion of full-time employees.
Figure 4.5. Employment Status, Light Region
Full-time Part-time Away from work
100%
90%
80%
70%
% of employed
60%
50%
40%
30%
20%
10%
0%
2011 2016
Note: Place of work.
Source: ABS (2017).
Figure 4.6. Employment Status by Industry, Light Region, 2016
Full-time Part-time Away from work
Manufacturing
Public Administration and Safety
Wholesale Trade
Mining
Electricity, Gas, Water and Waste Services
Construction
Transport, Postal and Warehousing
Agriculture, Forestry and Fishing
Education and Training
Professional, Scientific and Technical Services
Information Media and Telecommunications
Other Services
Rental, Hiring and Real Estate Services
Retail Trade
Financial and Insurance Services
Accommodation and Food Services
Arts and Recreation Services
Administrative and Support Services
Health Care and Social Assistance
0% 20% 40% 60% 80% 100%
% of employed
Note: Place of work.
Source: ABS (2017).
15LIGHT Economic Analysis - Background Report
4.2.2 Underemployment
Underemployment refers to persons who have a job but want, and are available to work, more
hours than they currently are. Underemployment data is only available at the state level, however
trends in underemployment in the region are unlikely to differ significantly from trends at the state
level.
The South Australian underemployment rate was 8.6% (trend) in May 2019, broadly in line with the
national average (8.5%) and 2.8 percentage points higher than the South Australian unemployment
rate (5.8%).
While the South Australian underemployment rate has trended lower in recent years, the rate
remains elevated by historical standards. Further, the gap between the South Australian
unemployment and underemployment rates has widened over the past two decades. This indicates
that, while the unemployment rate in the Light region is particularly low, there are likely to be
numerous workers looking to work more hours in the region.
Figure 4.7. Unemployment and Underemployment Rates
South Australia underemployment rate South Australia unemployment rate
Australia underemployment rate Australia unemployment rate
12%
Unemployment / Underemployment rates
11%
10%
9%
8%
7%
6%
5%
4%
3%
2%
May-99 May-03 May-07 May-11 May-15 May-19
Note: trend data.
Source: ABS (2019d).
4.3 Journey to Work
Analysis of journey to work data from the 2016 Census shows that 65% of local residents (4,689)
leave the Council area every day to go to work. This demonstrates the attractiveness of the area for
residents, as many have decided to incur a longer commute in order to live in the Light region.
At the same time, the analysis also shows that for the jobs available inside the Light region, 44% of
them (2,137) are filled by local residents.
While some resident workers travel to Adelaide for employment, there is a significantly greater
proportion of resident workers employed in surrounding local government areas, particularly the
neighbouring Barossa LGA. Additionally, most of the local jobs in the Light region that are not filled
by resident workers are occupied by residents from adjoining local government areas (Table D).
16LIGHT Economic Analysis - Background Report
In terms of industry, manufacturing, healthcare and retail trade all have relatively high proportions
of local resident workers who work outside of the Light region.
Table C. Journey to Work, Light Region, 2016
Location Number %
Employed residents in the area
Live and work in the area 2,137 30%
Live in the area, but work outside 4,689 65%
No fixed place of work 390 5%
Total employed residents in the area 7,226 100%
Workers in the area
Live and work in the area 2,137 44%
Work in the area, but live outside 2,657 56%
Total workers in the area 4,812 100%
Source: ABS (2017).
Table D. Journey to Work, by LGA, Light Region, 2016
Top 10 employment locations of resident Top 10 residential location of local workers
workers by Council by Council
Council No. % Council No. %
Light (RegC) 2,137 29.6% Light (RegC) 2,137 44.4%
Barossa (DC) 1,148 15.9% Barossa (DC) 807 16.8%
Gawler (T) 753 10.4% Gawler (T) 509 10.6%
Playford (C) 645 8.9% Playford (C) 298 6.2%
Salisbury (C) 642 8.9% Salisbury (C) 158 3.3%
Port Adelaide Enfield (C) 397 5.5% Tea Tree Gully (C) 102 2.1%
No Fixed Address (SA) 390 5.4% Adelaide Plains (DC) 101 2.1%
Adelaide (C) 260 3.6% Clare & Gilbert Valleys (DC) 84 1.7%
Tea Tree Gully (C) 117 1.6% Port Adelaide Enfield (C) 83 1.7%
Charles Sturt (C) 116 1.6% Goyder (DC) 65 1.4%
Source: ABS (2017).
17LIGHT Economic Analysis - Background Report
Table E. Journey to Work by Industry of Employment, 2016
Top 10 employment industries of resident workers Top 10 employment industries of outside residents
who work outside Light Region who work in Light Region
Industry No. % Industry No. %
Manufacturing 720 14.6% Manufacturing 685 26.9%
Health Care and Social Assistance 673 13.6% Education and Training 394 15.5%
Retail Trade 552 11.2% Agriculture, Forestry and Fishing 291 11.4%
Public Administration and Safety 434 8.8% Construction 217 8.5%
Accommodation and Food
Construction 408 8.3% 172 6.8%
Services
Education and Training 393 8.0% Health Care and Social Assistance 126 4.9%
Accommodation and Food Transport, Postal and
291 5.9% 103 4.0%
Services Warehousing
Transport, Postal and
274 5.5% Retail Trade 88 3.5%
Warehousing
Administrative and Support Administrative and Support
210 4.3% 84 3.3%
Services Services
Professional, Scientific and
165 3.3% Wholesale Trade 82 3.2%
Technical Services
Source: ABS (2017).
4.4 Skills
Workforce and Skills
The skills in an economy can be considered in terms of its local resident workforce (i.e. the people
who reside in the area and their respective skills), as well as in terms of the local workers (i.e. the
people who work locally). Because 44% of local jobs are filled by local people, these two
perspectives will align to a certain degree. A shortage or surplus in any area will help us
understand any existing skills gaps in the local resident workforce.
The Light region had a significantly lower proportion of professionals and sales workers (by place of
work) than the South Australian average in 2016.
However, the Light region also has a higher representation of labourers, machinery operators and
drivers, and technicians and trades workers than the South Australian average, which is
representative of the large local agriculture, construction and manufacturing industries.
18LIGHT Economic Analysis - Background Report
Figure 4.8. Employment by Occupation (place of usual residence), 2016
South Australia RDA BGLAP Light
Labourers
Machinery Operators and Drivers
Sales Workers
Clerical and Administrative Workers
Community and Personal Service Workers
Technicians and Trades Workers
Professionals
Managers
0% 5% 10% 15% 20% 25%
Employment by Occupation (%)
Source: ABS (2017).
Figure 4.9. Employment by Occupation (place of work), 2016
South Australia RDA BGLAP Light
Labourers
Machinery Operators and Drivers
Sales Workers
Clerical and Administrative Workers
Community and Personal Service Workers
Technicians and Trades Workers
Professionals
Managers
0% 5% 10% 15% 20% 25%
Employment by Occupation (%)
Source: ABS (2017).
Consistent with the higher proportion of labourers, machinery operators and drivers, and
technicians and trades workers in the area, the region has a higher proportion of residents listing
‘secondary education’ and ‘certificate level’ as their highest education attainment in 2016 compared
with the South Australian average.
Accordingly, the region has a lower proportion of residents with ‘bachelor degree level’ and ‘post
graduate degree level’ listed as their highest level of education attained.
19LIGHT Economic Analysis - Background Report
Figure 4.10. Highest Education Attainment (place of usual residence), 2016
South Australia RDA BGLAP Light
Secondary Education - Years 9 and below
Certificate I & II Level
Secondary Education - Years 10 and above
Certificate III & IV Level
Advanced Diploma and Diploma Level
Bachelor Degree Level
Graduate Diploma and Graduate Certificate Level
Postgraduate Degree Level
0% 5% 10% 15% 20% 25% 30% 35% 40% 45%
Highest Education Attainment (%)
Source: ABS (2017).
Figure 4.11. Highest Education Attainment (place of work), 2016
South Australia RDA BGLAP Light
Secondary Education - Years 9 and below
Certificate I & II Level
Secondary Education - Years 10 and above
Certificate III & IV Level
Advanced Diploma and Diploma Level
Bachelor Degree Level
Graduate Diploma and Graduate Certificate Level
Postgraduate Degree Level
0% 5% 10% 15% 20% 25% 30% 35% 40% 45%
Highest Education Attainment (%)
Source: ABS (2017).
20LIGHT Economic Analysis - Background Report
4.5 Value of Employment
Different industries contribute varying degrees of value to the local economy based on a variety of
factors including supply chains, price of goods sold and overall position in the economy.
As highlighted below, financial services, information media and telecommunications, rental, hiring
and real estate services and utility services are amongst the highest value-adding industries in the
local economy.
Arts and recreation services, accommodation and food services and retail trade are amongst the
lowest value-adding sectors in the local economy.
High Value-Adding Jobs
In terms of economic development, growing high value-adding jobs will have greater benefits to
the overall economy than increases in low value-adding jobs. The core difference is related to the
relevant supply chains of these industries as well as the wages that are often paid across those
industries. High value-adding jobs will provide a greater ability to spend more in the local
economy, which will create a greater flow-on benefit locally. Additionally, businesses that have
more local supply chains (or the opportunity for them) will have the ability to support additional
businesses, creating more value in the local economy.
Because one job may offer greater value than another, this does not mean that lower value-
adding jobs are not important. These jobs often provide employment for youth and offer an entry
point into the workforce for many residents. Rather, understanding the value of employment
should guide the balance of effort and resources in terms of various industry development and
investment attraction activities.
Figure 4.12. Industry Value-Add per Employee, Light Region
Financial and Insurance Services
Information Media and Telecommunications
Rental, Hiring and Real Estate Services
Electricity, Gas, Water and Waste Services
Mining
Agriculture, Forestry and Fishing
Manufacturing
Wholesale Trade
Construction
Transport, Postal and Warehousing
Professional, Scientific and Technical Services
Education and Training
Public Administration and Safety
Health Care and Social Assistance
Other Services
Administrative and Support Services
Retail Trade
Accommodation and Food Services
Arts and Recreation Services
$0 $50 $100 $150 $200 $250 $300 $350
Industry value-add per employee ($'000)
Note: Based on 2016 Census employment by industry by place of work and 2015-16 industry value-add data.
Sources: Economy.id (2019), ABS (2017).
21LIGHT Economic Analysis - Background Report
5. Tourism
Tourism is not one of the Light region’s key industries, accounting for just 1.8% of industry value-add
in 2016-17. However, tourism visitation to the Light region has risen by more than 50% since 2010,
primarily driven by strong growth in day-trip visitors.
Day-trip visitors are by far the largest visitor type to the region, comprising over 80% of total visitors
to the region in 2018. It should be noted however, that day-trip visitors have the lowest average trip
spend of the three visitor types, and therefore the lowest economic impact. In contrast,
international visitors accounted for less than 1% of total visitors to the region in 2018.
Table F. Industry Value-Add by Sub-Industry, 2017-18, Light Region
Industry Value Added Employment
Sector
$M % of Total No. % of Total
Tourism $11.0 1.8% 144 2.6%
Accommodation $5.1 0.8% 113 2.0%
Food & beverage services $7.2 1.2% 186 3.2%
Note: Tourism data is for 2016-17.
Source: Economy.id (2019).
Figure 5.1. Visitors by Type, Light Region
Day-trip Domestic overnight International
180
160
140
Visitors (thousands)
120
100
80
60
40
20
0
2010 2011 2012 2013 2014 2015 2016 2017 2018
Note: 5-year averages used due to low sample sizes.
Source: TRA (2019).
22LIGHT Economic Analysis - Background Report
6. Property
The Light region offers affordability with housing prices up to 60% less than other areas (Table G).
Building approvals have declined (both in number and value) in the Light region in recent years,
consistent with slowing population growth in the region.
Table G. Median House Price (2019)
Median House Price ($) Annual Growth (%) Savings in Light (%)
South Australia $435,000 1.8% 18.0%
Metro Adelaide $485,000 1.7% 26.5%
Central Metro $560,000 0.5% 37.1%
Inner Metro $840,000 -2.4% 59.3%
Light Region $350,550 -8.8% NA
Source: REISA (2020), Pricefinder (2020).
Figure 6.1. Building Approvals, Light Region
Residential Approvals (lha) Residential Value (rha) Non-Residential Value (rha)
120 $45
$40
100
$35
Building Approval Value ($m)
Residential Approvals (No.)
80 $30
$25
60
$20
40 $15
$10
20
$5
0 $0
2013-14 2014-15 2015-16 2016-17 2017-18 2018-19 FYTD
Source: ABS (2019b).
23LIGHT Economic Analysis - Background Report
7. Competitive Advantages and Opportunities
Identifying Competitive Advantages
Identifying and leveraging competitive advantages is important for successful economic
development efforts at the local level. Competitive advantages can exist in many forms including
location, natural resources, industry specialisation and/or infrastructure. This section seeks to
identify the unique competitive advantages of the Light region using various analytical techniques,
including:
• Location quotient analysis
• Cluster mapping
This analysis will identify various industry opportunities for the Light region to be tested and
verified through consultation.
The following graph shows the Light region’s competitive advantages by industry due to local
employment specialisation. Essentially, the location quotients show the proportion of workers in
individual industries with the ‘1’ line representing parity with South Australia. Industries showing a
specialisation above the ‘1’ line indicate areas of natural competitive advantage.
The analysis shows the natural competitive advantages for the Light region in agriculture, forestry
and fishing, education and construction.
Figure 7.1. Employment Location Quotients, Light (benchmarked to South Australia), 2017-18
Agriculture, Forestry and Fishing
Mining
Manufacturing
Electricity, Gas, Water and Waste Services
Construction
Wholesale Trade
Retail Trade
Accommodation and Food Services
Transport, Postal and Warehousing
Information Media and Telecommunications
Financial and Insurance Services
Rental, Hiring and Real Estate Services
Professional, Scientific and Technical Services
Administrative and Support Services
Public Administration and Safety
Education and Training
Health Care and Social Assistance
Arts and Recreation Services
Other Services
0 1 2 3 4 5
Location Quotient
Source: Economy.id (2019).
24LIGHT Economic Analysis - Background Report
It is important to understand that the education and construction industries rely on population and
other factors for growth and vitality. As such, as population (and business) grows, so too will
construction and education, so while there is a relative competitive advantage in these sectors, it is
not something that the Light region can trade on given the region’s slowing population growth and
ageing population profile.
The following cluster maps help us to understand the relative competitive advantage against a
backdrop of future expected employment growth, as well as existing local employment strengths.
Cluster Mapping
Cluster mapping is an analytical tool to consider future economic growth opportunities and to
show the importance and growth opportunities for various clusters or industries within the
economy. The cluster maps for the Light region show the significance and importance of the
existing agricultural and manufacturing clusters. The mapping also shows the growth potential of
various other clusters such as the health care and social assistance industry.
Interpreting the Cluster Map
Cluster mapping is an analytical tool that can simultaneously present the size and scale of a
location’s competitive advantages with future anticipated growth trends by industry. In cluster
mapping, a location’s competitive advantage is viewed through labour specialisation (i.e. the
relative scale of employment in specific industries). There are three main components to the
cluster map:
• Location quotient: the community’s location quotients are presented along the vertical
axis and these points represent the proportional employment in the community versus a
comparison, in this instance South Australia (i.e. compared with SA, how many people are
employed in the sector; 1 = the same, 1.2 = 20% more than the state, etc.).
• Employment Growth: future employment growth expectations per industry, from 2018 to
2023, form the horizontal axis and tell us the percentage growth expected for a sector,
based on projections from the Department of Employment, Skills, Small and Family
Business.
• The Cluster: or the ‘bubble’ represents the size of local employment in that given sector,
which shows the significance of the sector locally.
Overall, cluster mapping helps to identify industry areas of focus for further development in the
future.
25LIGHT Economic Analysis - Background Report
Figure 7.2. Cluster Map (1-digit), Light Region
5.0
High Competitive Advantage / Weak Growth High Competitive Advantage / Strong Growth
4.5
= 300 Employees
Agriculture, Forestry and
4.0 Fishing
3.5
Location Quotients (2017-18)
3.0
Manufacturing
2.5
2.0 See Next Page
1.5
Education and Training
Wholesale Trade Information Media andand Real Estate
Rental, Hiring
1.0 Telecommunications Accommodation and Food Professional, Scientific and
Services
Mining Transport, Postal and
Construction
Electricity, Gas, Water and Services Technical Services
Other Services Warehousing Health Care and Social
0.5 PublicWaste
Administration
Services and
Retail Trade Administrative and Support Assistance
Safety Arts and Recreation Services
Services Weak Competitive Advantage / Strong Growth
Weak Competitive Advantage / Weak Growth
0.0
Financial and Insurance
-5% 0% 5% 10% 15% 20%
Services
Employment Growth 2018-2023
Note: Location quotient calculated by proportion of Light employment divided by proportion of South Australia employment. Location quotient of greater than 1 indicates industry makes up
larger proportion of Light employment than it does across South Australia.
Sources: Economy.id (2019), DESSFB (2018b).
26LIGHT Economic Analysis - Background Report
Figure 7.3. Cluster Map (1-digit) Inset, Light Region
1.75
High Competitive Advantage / Weak Growth High Competitive Advantage / Strong Growth
1.50
= 300 Employees Education and Training
1.25
Location Quotients (2017-18)
Construction
Mining Transport, Postal and
Warehousing
1.00 Information Media and Administrative and Support
Wholesale Trade Services
Telecommunications
Accommodation and Food
Services
0.75 Other Services
Rental, Hiring and Real Professional, Scientific and
Electricity, Gas, Water and
Estate Services Technical Services
Waste Services
0.50
Retail Trade Arts and Recreation Services
Public Administration and Health Care and Social
0.25 Safety Assistance
Financial and Insurance
Weak Competitive Advantage / Weak GrowthServices Weak Competitive Advantage / Strong Growth
0.00
-5% 0% 5% 10% 15%
Employment Growth 2018-2023
Note: Location quotient calculated by proportion of Light employment divided by proportion of South Australia employment. Location quotient of greater than 1 indicates industry makes up
larger proportion of Light employment than it does across South Australia.
Note: Place of work data.
Sources: Economy.id (2019), DESSFB (2018b).
27LIGHT Economic Analysis - Background Report
Figure 7.4. Manufacturing Sub-Industries (2-dig) Cluster Map, Light Region
25
High Competitive Advantage / Weak Growth High Competitive Advantage / Strong Growth
= 100 Employees
20
Location Quotients (2017-18)
Non-Metallic Mineral Product
15
Textile, Leather, Clothing and
Footwear
10
Machinery and Equipment Beverage and Tobacco
Product
Pulp, Paper and Converted Wood Product
Paper Product Basic Chemical and Chemical
Petroleum and Coal Product Product
5
Polymer Product and Rubber Primary Metal and Metal
Fabricated Metal Product
Product Product
Food Product Furniture and Other
Weak Competitive Advantage / Strong Growth
0 Weak Competitive Advantage / Weak Growth
-10% -5% 0% 5% 10% 15%
Employment Growth 2018-2023
Note: Location quotient calculated by proportion of Light employment divided by proportion of South Australia employment. Location quotient of greater than 1 indicates industry makes up
larger proportion of Light employment than it does across South Australia.
Sources: Economy.id (2019), DESSFB (2018b).
28LIGHT Economic Analysis - Background Report
The analysis above indicates that there are future economic development growth opportunities in
the following industries:
• Healthcare
• Agriculture
• Beverage and tobacco product manufacturing
• Professional, scientific and technical services
• Tourism
It will be important for Light Regional Council to consider how the Council can influence these
sectors to grow into the future.
29LIGHT Economic Analysis - Background Report
8. Summary
This analysis has revealed numerous elements of the local economy as well as various areas for
future growth.
The Light economy is unique in many ways. The region’s median household income is higher than
the South Australian average and the region’s labour market exhibits a low rate of unemployment.
However, participation is likely declining given the region’s labour force is growing at an even slower
rate than its population. Further, with the region’s population growth slowing and ageing (with this
trend forecast to continue over the next decade), this is likely to have implications for the more
population-dependent industries such as education and construction. At present, these are two of
the larger industries in the region by employment.
The region’s economy is particularly reliant on the manufacturing and agriculture industries, which
are susceptible to changing weather patterns and global and national economic conditions. For this
reason, economic growth in the Light region has been particularly volatile in recent years.
The Light Regional Council must consider the best avenues to encourage broad-based, valuable
economic development. Based on this analysis, these efforts must consider existing businesses,
small businesses, trade opportunities, and the opportunity to attract investment from outside
investors and businesses. Additionally, entrepreneurial initiatives as well as other workforce
development initiatives should be considered.
This evidence base provides the foundation for future strategic considerations as well as for the
consultation phase of the project.
30LIGHT Economic Analysis - Background Report
References
ABS (2020a). Regional Population Growth, Australia. Cat no: 3218.0. Australian Bureau of Statistics,
Canberra.
ABS (2020b). Counts of Australian Businesses. Cat no: 8165.0. Australian Bureau of Statistics,
Canberra.
ABS (2019b). Building Approvals, Australia. Cat no: 8731.0. Australian Bureau of Statistics, Canberra.
ABS (2019c). Consumer Price Index, Australia, March quarter 2019. Cat no: 6401.0. Australian Bureau
of Statistics, Canberra.
ABS (2019d). Labour Force, Australia, May 2019. Cat no: 6202.0. Australian Bureau of Statistics,
Canberra.
ABS (2018). Census of Population and Housing: Socio-Economic Indexes for Areas (SEIFA), Australia,
2016. Cat no: 2033.0.55.001. Australian Bureau of Statistics, Canberra.
ABS (2017). Census of Population and Housing, 2016. Cat no: 2003.0. Australian Bureau of Statistics,
Canberra.
DPTI (2019). Population projections for South Australian SA2s and LGAs 2016-2036. Department of
Planning, Transport and Infrastructure, Adelaide.
DESE (2020). LGA Data Tables — Small Area Labour Markets — December quarter 2019. Department
of Education, Skills, and Employment, Canberra.
DESSFB (2018). 2018 Employment Projections. Department of Employment, Skills, Small and Family
Business, Canberra.
Economy.id (2020). Light Regional Council. ID, Melbourne.
Economy.id (2019). Light Regional Council. ID, Melbourne.
Pricefinder (2020). House prices, Light LGA. Unpublished.
REISA (2020). Median House Prices – December quarter 2019. Real Estate Institute of South
Australia, Adelaide.
TRA (2019). National and International Visitor Surveys. Tourism Research Australia, Canberra.
31LIGHT Economic Analysis - Background Report
Lucid Economics Pty Ltd
www.lucideconomics.com.au
info@lucideconomics.com.au
ABN 67 600 265 567
32You can also read