Links of climate variability in Arctic sea ice, Eurasian teleconnection pattern and summer surface ozone pollution in North China - Atmos. Chem. Phys
←
→
Page content transcription
If your browser does not render page correctly, please read the page content below
Atmos. Chem. Phys., 19, 3857–3871, 2019
https://doi.org/10.5194/acp-19-3857-2019
© Author(s) 2019. This work is distributed under
the Creative Commons Attribution 4.0 License.

Links of climate variability in Arctic sea ice, Eurasian teleconnection
pattern and summer surface ozone pollution in North China
Zhicong Yin1,2 , Huijun Wang1,2 , Yuyan Li1 , Xiaohui Ma3 , and Xinyu Zhang1
1 Key  Laboratory of Meteorological Disaster, Ministry of Education – Joint International Research Laboratory of Climate and
Environment Change (ILCEC) – Collaborative Innovation Center on Forecast and Evaluation of Meteorological Disasters
(CIC-FEMD), Nanjing University of Information Science and Technology, Nanjing 210044, China
2 Nansen–Zhu International Research Center, Institute of Atmospheric Physics, Chinese Academy of Sciences, Beijing, China
3 Institute of Urban Meteorology, CMA Environmental Meteorology Forecast Center of Beijing-Tianjin-Hebei, China

Correspondence: Zhicong Yin (yinzhc@163.com)

Received: 25 October 2018 – Discussion started: 19 November 2018
Revised: 25 February 2019 – Accepted: 28 February 2019 – Published: 25 March 2019

Abstract. Summer surface O3 pollution has rapidly inten-          1   Introduction
sified in China in the recent decade, damaging human and
ecosystem health. In 2017, the summer mean maximum                Over the past several decades, due to fast economic devel-
daily average 8 h concentration of ozone was greater than         opment, air pollution has been increasing in China (Chen,
150 µg m−3 in North China. Based on the close relationships       2013; Watts et al., 2018). The major air pollution types in
between the O3 concentration and the meteorological con-          China are haze pollution (i.e., high-level fine particulate mat-
ditions, a daily surface O3 weather index was constructed,        ter) in winter (Yin et al., 2015; Wang, 2018) and surface
which extends the study period to the historical period be-       ozone (O3 ) pollution in summer (Ma et al., 2016; Tang et
fore 2007 and the projected future. Here, we show that in ad-     al., 2018). Due to drastic air pollution control in China since
dition to anthropogenic emissions, the Eurasian teleconnec-       2013, haze pollution has been controlled in recent years (the
tion pattern (EU), a major globally atmospheric teleconnec-       environmental statistics unit of a statistics center in Peking
tion pattern, influences surface O3 pollution in North China      University, 2018), appearing as a sharp decrease in fine par-
on a timescale of climate. The local meteorological condi-        ticulate matter. However, surface O3 pollution, which always
tions associated with the EU positive phase supported intense     occurs on clear and sunny days (Wang et al., 2017), has not
and efficient photochemical reactions to produce more sur-        improved (Li et al., 2018). The negative effects of surface
face O3 . The associated southerlies over North China trans-      O3 pollution, such as corroding human lungs and destroy-
ported surrounding O3 precursors to superpose local emis-         ing agricultural crops and forest vegetation, were not weaker
sions. Increased solar radiation and high temperatures during     than those of haze (Liu et al., 2018), but the impacts of cli-
the positive EU phase dramatically enhanced O3 production.        mate variability on surface O3 pollution in China (Yang et al.,
Furthermore, due to the close connection between the pre-         2014) have not been sufficiently studied. In the major urban
ceding May Arctic sea ice (SI) and summer EU pattern, ap-         agglomerations in China, such as Beijing-Tianjin-Hebei, the
proximately 60 % of the interannual variability in O3 -related    Yangtze River Delta and the Pearl River Delta, the surface
weather conditions was attributed to Arctic sea ice to the        O3 concentrations exceeded the ambient air quality standard
north of Eurasia. This finding will aid in understanding the      of China (100 µg m−3 ) by 100 %–200 % (Wang et al., 2017).
interannual variation in O3 pollution, specifically the related   In the Yangtze River Delta, the interannual variations in NO
meteorological conditions.                                        and O3 levels generally presented decreasing and increasing
                                                                  trends, respectively, from 2012 to 2015, at both urban and
                                                                  suburban sites (Tong et al., 2017). Furthermore, the concen-
                                                                  tration of O3 and its precursors, e.g., nitrogen oxides (NOx )
                                                                  and volatile organic compounds (VOCs), in Beijing-Tianjin-

Published by Copernicus Publications on behalf of the European Geosciences Union.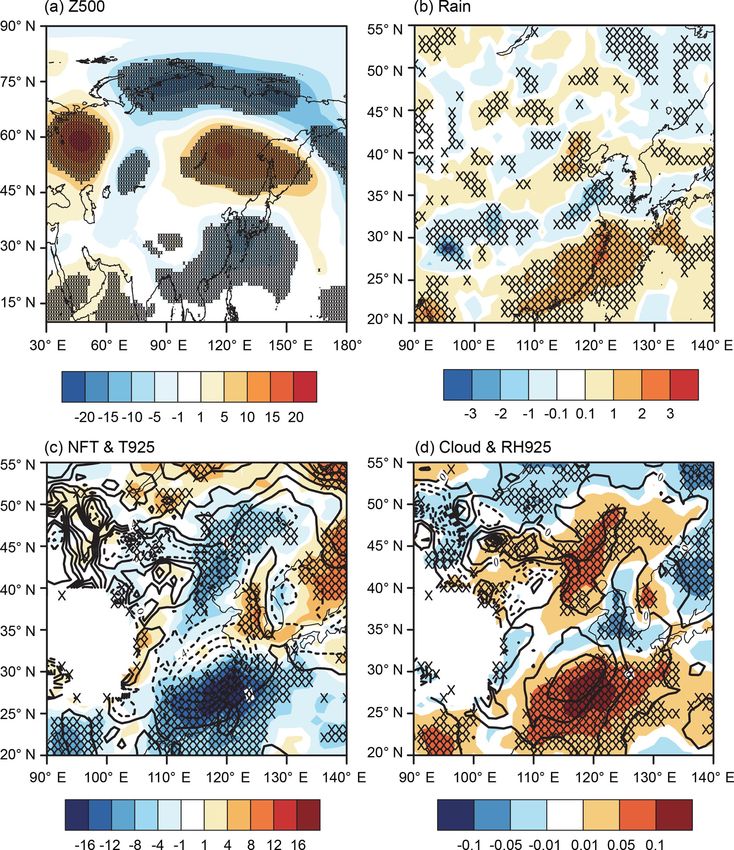
3858                                                             Z. Yin et al.: Links of climate variability in Arctic sea ice

Hebei was significantly larger than that in other regions of     climate diagnostics, because of the lack of long-term surface
China (Wang et al., 2006; Shi et al., 2015). Revealed by the     O3 observations. The goal of this study is to examine the
datasets from Shangdianzi Station, the long-term trend of O3     large-scale atmospheric circulations associated with the in-
concentrations in North China indicated that the O3 pollution    terannual variation in summer surface O3 pollution in North
underwent a significant increase in the period 2005–2015,        China based on long-term meteorological observations. The
with an average rate of 1.13±0.01 ppb yr−1 (Ma et al., 2016).    role of May Arctic sea ice (ASI), as a preceding and effec-
   Surface O3 is a secondary pollutant. The precursors of        tive driver, is also analyzed. The outcomes of our research,
O3 photochemically react with sunlight to generate O3 un-        in terms of climate variability, may provide a basis for un-
der suitable weather conditions, i.e., hot-day and sunny en-     derstanding the interannual variation in O3 pollution, specif-
vironments (An et al., 2009). Surface deposition, dynamic        ically the related meteorological conditions.
transport and dispersion of O3 are also closely related to at-
mospheric circulations. For example, the prevailing positive
phase of the North Atlantic Oscillation contributed to the in-   2   Data and method
creasing ozone concentration in western and northern Europe
through the anomalous atmospheric circulations that influ-       The hourly O3 concentration data from 2014 to 2017 in
ence regional photochemical processes (Christoudias et al.,      China were provided by the Ministry of Environmental Pro-
2012; Pausata et al., 2012). The summer surface O3 vari-         tection of China. As one of the three regional background
ability in North America is significantly modulated by the       air-monitoring stations in China, the hourly O3 concentra-
position of the jet stream (Lin et al., 2014). Barnes and        tion data at the Shangdianzi station (SDZ; located at 40.7◦ N,
Fiore (2013) pointed out jet position may dynamically mod-       117.1◦ E; and 293.3 m a.m.s.l.) were continuously observed
ulate surface ozone variability in eastern North America and     from 2006 to 2017 and were controlled by the National Me-
other northern midlatitude regions. A strong positive correla-   teorological Information Center, China Meteorological Ad-
tion between the East Asian summer monsoon and summer            ministration. According to the Technical Regulation on Am-
mean ozone were found by model simulations (Yang et al.,         bient Air Quality Index of China (the Ministry of Environ-
2014), illustrating that the changes in meteorological param-    mental Protection of China, 2012), the maximum daily av-
eters, associated with East Asian summer monsoon, lead to        erage 8 h concentration of ozone (MDA8) was used to rep-
2 %–5 % interannual variations in surface O3 concentrations      resent the daily O3 conditions. The MDA8 was calculated
over central eastern China. Focusing on the dataset in 2014, a   as the maximum of the running 8 h mean O3 concentrations
significantly strong western Pacific subtropical high resulted   during 24 h in the day. However, the systematic observation
in higher relative humidity, more clouds, more rainfall, less    duration of the surface O3 concentration was much shorter
ultraviolet radiation and lower air temperatures, which were     than the meteorological measurements and could not support
unfavorable for the formation of O3 (Zhao and Wang, 2017).       the climate analysis.
The photochemical reaction was the main local source of O3          The monthly sea ice (SI) concentrations (1◦ × 1◦ ) were
(Sun et al., 2019). The hot and dry environments and the in-     downloaded from the Met Office Hadley Centre (Rayner et
tense solar radiation could accelerate the chemical conver-      al., 2003), which are widely used in sea ice-related analysis.
sion from the precursor to O3 (An et al., 2009; Tong et al.,     The sea ice fields are made more homogeneous by compen-
2017). In 2013, a severe heatwave with a highest tempera-        sating satellite microwave-based sea ice concentrations for
ture of 41.1 ◦ C, contributed to the high O3 concentration in    the impact of surface melt effects on retrievals in the Arctic
the Yangtze River Delta (Pu et al., 2017). The frequency of      and by making the historical in situ concentrations consistent
large-scale, extreme heat events is closely related to atmo-     with the satellite data. The gridded sea ice data were avail-
spheric patterns, such as the Eurasian teleconnection pattern    able from 1870 to date, and those from 1979 to 2018 were
(EU; Pu et al., 2017; Li and Sun, 2018) and aerosol effec-       extracted here.
tive radiative forcing (Liu and Liao, 2017). The winds from a       The 1◦ × 1◦ ERA-Interim data used here included the
polluted area also transport O3 and its precursors downwind      geopotential height (Z), zonal and meridional wind, rela-
(Doherty et al., 2013). Due to the close relationship between    tive humidity, vertical velocity, air temperature from 1000 to
surface O3 and meteorological conditions, the impacts of cli-    100 hPa, boundary layer height (BLH), surface air tempera-
mate change on O3 have been projected by various numer-          ture (SAT) and wind, downward UV radiation, downward so-
ical models (Doherty et al., 2013; Melkonyan and Wagner,         lar radiation, low and medium cloud cover, and precipitation
2013; Zhu and Liao, 2016; Gaudel et al., 2018). Over eastern     (Dee et al., 2011). The daily mean and monthly mean ERA-
China, the surface ozone concentration and possibility of se-    Interim data from 1979 to present were directly downloaded
vere ozone pollution may both increase in the future (Wang       from the ERA-Interim website in this study. Furthermore,
et al., 2013).                                                   the daily mean and monthly reanalysis datasets supported by
   However, previous studies of O3 pollution in China mainly     the National Oceanic and Atmospheric Administration were
focused on observational analyses of several synoptic pro-       also employed and denoted as NCEP/NCAR (National Cen-
cesses (e.g., Zhao and Wang, 2017), rather than long-term        ters for Environmental Prediction and the National Center

Atmos. Chem. Phys., 19, 3857–3871, 2019                                           www.atmos-chem-phys.net/19/3857/2019/
Z. Yin et al.: Links of climate variability in Arctic sea ice                                                                  3859

for Atmospheric Research) data. The 2.5◦ × 2.5◦ geopoten-             Since 2015, O3 concentrations have been measured in most
tial height (Z), zonal and meridional wind, relative humid-           areas in eastern China. O3 concentrations in the high latitudes
ity, vertical velocity, air temperature from 1000 to 100 hPa,         to midlatitudes were higher than those in the lower latitudes,
SAT and wind, downward UV radiation, downward solar ra-               which appeared to be separated by the Yangtze River. The
diation, and low and medium cloud cover were downloaded,              O3 concentrations in North China were already high in 2014;
which were available from 1948 to present (Kalnay et al.,             the summer mean MDA8 in North China was higher than
1996). The BLH dataset was only available from 1979 to                120 µg m−3 . Observations with a maximum MDA8 higher
2014 in the website of the NARR Monthly Averages (Giese               than 265 µg m−3 (i.e., the threshold of the severe surface O3
et al., 2016). The daily precipitation data were from the CPC         pollution in China) existed in the south of Hebei province and
global analysis of the daily precipitation dataset (Chen et al.,      in the north of Shandong province (Fig. 1a). Since that time,
2008).                                                                the O3 -polluted region has expanded. In 2017, the areas with
   The EU pattern is a major teleconnection pattern in the            summer mean MDA8 > 120 µg m−3 were visibly enlarged.
Northern Hemisphere and appears in all seasons. Wang and              In North China, the summer mean MDA8 observations were
Zhang (2015) used the method defined by Wallace and Gut-              larger than 150 µg m−3 , and the maximum MDA8 was nearly
zler (1981) to calculate the EU pattern index in winter and           265 µg m−3 . South of the Yangtze River, the O3 concentra-
pointed out that the positive EU phase is associated with a           tions were distinctly lower and decreased progressively to-
cold and dry climate in East China, and vice versa. Mean-             wards the Pearl River Delta.
while, Wang and He (2015) regarded the summer EU pat-                    The time span of O3 observations (i.e., 2015–2017 for
tern as the main reason for the severe summer drought in              most of the sites) limited the possibility of determining the
North China in 2014. Considering the seasonal change of               role of climate variability in the interannual O3 variations
the EU pattern’s location, the calculation procedure for the          in North China. Thus, we examined the representativeness
summertime EU index was consistent with that in Wang and              of the O3 measurements at SDZ (one of the three regional
He (2015), i.e., Eq. (1):                                             background air-monitoring stations in China, with observa-
                                                                     tions from 2006–2017). The correlation coefficients between
EU index = −1 × H500(70−80◦ N, 60−90◦ E) + 2                (1)       the SDZ MDA8 and the observed MDA8 at the other sites

    × H500(45−55◦ N,90−110◦ E) − 1 × H500(35−45◦ N, 120−140◦ E) /4,   were calculated and are shown in Fig. 1b, d, f and h. The dis-
                                                                      tribution of correlation coefficients is similar to the MDA8
where H500 represents the geopotential height at 500 hPa,
                                                                      in Fig. 1a, c, e and g. The SDZ MDA8 significantly covaried
and overbars denote the area average.
                                                                      with the MDA8 in North China in summer. Along with the
   The generalized additive model (GAM), a data-driven
                                                                      increasing of the surface O3 pollution, the covariation of SDZ
method, is particularly effective at handling the complex
                                                                      MDA8 and MDA8 in North China strengthens the represen-
nonlinear and non-monotonous relationships between the de-
                                                                      tativeness of SDZ for North China. However, the correlation
pendent variable and the independent variables (Hastie and
                                                                      coefficients between SDZ MDA8 and MDA8 in the south
Tibshirani, 1990). This approach used a smoothing func-
                                                                      of China were negative, indicating opposite variation (Zhao
tion, determined by the independent variables themselves,
                                                                      and Wang, 2017). The variation in summer SDZ MDA8 is
to transform the expressions and addressed the dependent
                                                                      presented in Fig. S1 in the Supplement. According to the
variable with different probability distributions by the link
                                                                      Technical Regulation on Ambient Air Quality Index in China
function. To verify the connection between the Arctic sea
                                                                      (The Ministry of Environmental Protection of China, 2012),
ice and the O3 pollution, the Community Atmosphere Model
                                                                      we defined the non-O3 -polluted (NOP) level at the surface
version 5.3 (CAM5; Meehl et al., 2013) was employed to de-
                                                                      as the O3 concentration < 100 µg m−3 and the moderate-O3 -
sign numerical experiments. The spatial resolution employed
                                                                      polluted (MOP) level with O3 concentration > 215 µg m−3 ,
was 0.9◦ ×1.25◦ , with 30 vertical hybrid sigma-pressure lev-
                                                                      respectively. The upper and lower quartile of SDZ MDA8
els. CAM5.3 uses vertical hybrid delta-pressure coordinates,
                                                                      was 188 and 114 µg m−3 , indicating that more than 75 % of
including 26 layers with the top located at about 3.5 hPa.
                                                                      summer days exceeded the NOP threshold even at the re-
The climatological mean sea surface temperature and sea ice
                                                                      gional background air-monitoring station. During the years
taken from the Hadley Centre were used to force the control
                                                                      2007–2017, there were 126 NOP days and 155 MOP days in
run.
                                                                      summer at the SDZ station. The maximum number of MOP
                                                                      days was 26 days in 2015, and the mean number of MOP
3     Summer ozone pollution and associated weather                   days was 14 days (Table S1 in the Supplement). Both the in-
      conditions                                                      terannual variation in MOP and that in NOP days was signif-
                                                                      icant at the 95 % confidence level, without an obvious trend.
Due to increased surface O3 pollution in China, the number               Due to the significant covariation between the SDZ MDA8
of O3 measurement stations has dramatically increased since           to the MDA8 in North China, the meteorological condi-
2014 (Fig. 1a, c, e, g). During 2006–2014, O3 concentrations          tions were composited for the MOP and NOP days in SDZ
were only observed in the most developed regions in China.            (Fig. 2), and the results were also appropriate for those in

www.atmos-chem-phys.net/19/3857/2019/                                                  Atmos. Chem. Phys., 19, 3857–3871, 2019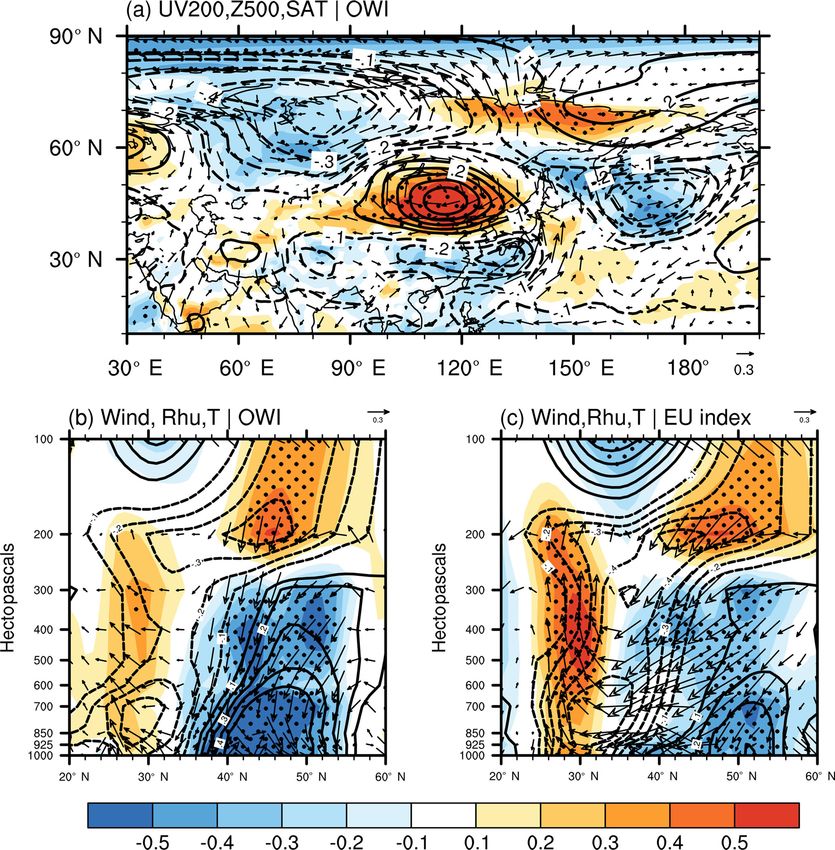
3860                                                                     Z. Yin et al.: Links of climate variability in Arctic sea ice

Figure 1. The distribution of the JJA mean MDA8 (a, c, e, g) and the correlation coefficients (b, d, f, h) between the daily MDA8 and
SDZ MDA8 from 2014 to 2017. The black crosses in (a, c, e, g) indicate that the maximum daily MDA8 was larger than 265 µg m−3 . The
black crosses (b, d, f, h) indicate that the correlation coefficient (CC) was above the 95 % confidence level. The green triangle in (b, d, f,
h) illustrates the location of the Shangdianzi site. The black box in (h) is the location of North China.

Atmos. Chem. Phys., 19, 3857–3871, 2019                                                     www.atmos-chem-phys.net/19/3857/2019/
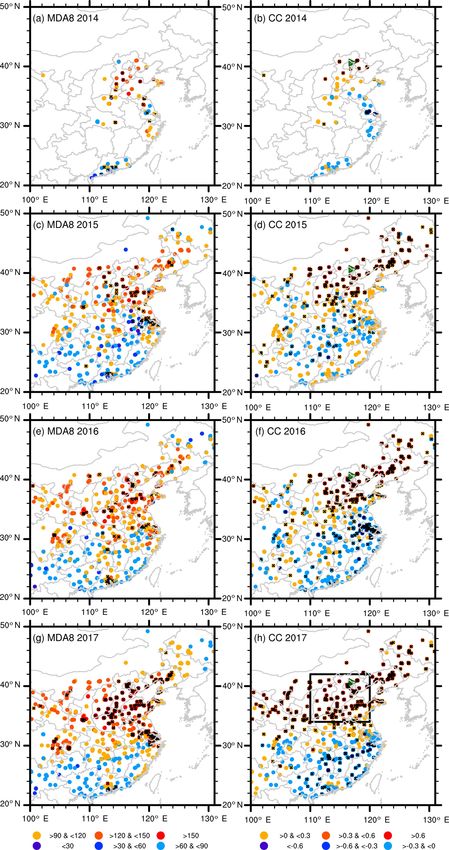
Z. Yin et al.: Links of climate variability in Arctic sea ice                                                                            3861

Figure 2. Composite of the meteorological conditions associated with different O3 events during 2007–2017. Results for MOP (a, c, e, g)
and NOP (b, d, f, h) events included (a, b) surface wind (m s−1 ; arrow) and v wind (m s−1 ; shading), (c–d) BLH (m), (e, f) precipitation
(mm), (g–h) SAT (◦ C, shading) and temperature at 200 hPa (◦ C; contour). The black dots denote the composite results that passed the 95 %
confidence level. The boxes represent the area used to calculate OWI. These composites were calculated using the ERA-Interim dataset. The
green triangle in (a, b) illustrates the location of the Shangdianzi site. The composite results were calculated as the differences between MOP
or NOP events and the rest of the events (i.e., all events, excluding MOP and NOP events).

www.atmos-chem-phys.net/19/3857/2019/                                                       Atmos. Chem. Phys., 19, 3857–3871, 2019
3862                                                                 Z. Yin et al.: Links of climate variability in Arctic sea ice

Figure 3. The variation in the daily observational SDZ MDA8 (black), fitting SDZ MDA8 (red), and OWI (blue) from June to August during
2007–2017. The numbers are the correlation coefficients between the observational SDZ MDA8 and fitting SDZ MDA8 (red) and OWI
(blue).

                                                                     ature at 200 hPa above North China was significantly neg-
                                                                     ative (Fig. 2g), dynamically associated with the upper-level
                                                                     anticyclone. Furthermore, due to the strengthening of solar
                                                                     radiation, the near-surface turbulence was enhanced, and the
                                                                     boundary layer was lifted (Fig. 2c). The entrainment of at-
                                                                     mospheric ozone from the upper air into the boundary layer
                                                                     enhanced the surface O3 concentration (An et al., 2009). To
                                                                     confirm the robustness of the link between meteorological
                                                                     conditions and the MOP and NOP days over North China, the
                                                                     above composite analysis was repeated with NCEP/NCAR
                                                                     reanalysis data, and identical results were obtained (Figs. S3
                                                                     and S4 in the Supplement).
                                                                        To assess the interannual variation in surface O3 pollu-
Figure 4. The OWI for MOP (red) and NOP (blue) events during         tion and its relationship with climate variability (Cai et al.,
2007–2017.                                                           2017), we fitted an O3 weather index (OWI) based on long-
                                                                     term meteorological observations. Firstly, the regional aver-
                                                                     age meteorological elements were calculated as meteorolog-
North China. The local and surrounding weather conditions
                                                                     ical indices (Is), and here the selected regions were deter-
were significantly different (t test). The anomalous souther-
                                                                     mined the most significantly different areas in the compos-
lies (Fig. 2a), higher BLH (Fig. 2c), less rainfall (Fig. 2e),
                                                                     ites of MOP and NOP events in Fig. 2. Then, we defined the
warmer surface air temperature and cooler temperature in
                                                                     OWI as Eq. (2):
the high troposphere (Fig. 2g) favored surface O3 pollution.
Near the surface, for the polluted conditions, the winds are         OWI = normalized V10mI + normalized BI − normalized PI
northward in North China due to cyclonic anomalies to the                  + normalized DTI,                                      (2)
west and anticyclonic flow to the east (Fig. S2a in the Supple-
ment). Anomalous southerlies from the Yangtze River trans-           where the V10mI is the area-averaged meridional wind at
ported O3 precursors (that were emitted in the economically          10 m (35–50◦ N, 110–122.5◦ E; black box in Fig. 2a), and
developed Yangtze River Delta) and superposed them with              its correlation coefficient with the SDZ O3 concentration
the local high emissions in North China (Fig. 2a). When              was 0.39. BI is an area-averaged BLH (37.5–47.5◦ N, 112.5–
the anomalous winds reversed, i.e., northerlies, the O3 pre-         120◦ E; black box in Fig. 2c), and the correlation coeffi-
cursors in North China were dispersed, and the surface O3            cient with the SDZ O3 was 0.40. The PI is defined as area-
concentration in North China was reduced (Fig. 2b). On the           averaged precipitation (37.5–42.5◦ N, 112–127.5◦ E; black
upper level, significant anticyclonic anomalies (Fig. S2c in         box in Fig. 2e), whose correlation coefficient with the SDZ
the Supplement) resulted in sunny days in summer. A day              O3 concentration was −0.35 (above the 99 % confidence
without rain represents efficient solar radiation, in favor of       level). DTI represents the area-averaged difference in the
the occurrence of surface O3 pollution (Fig. 2e). In contrast,       temperature at the surface and 200 hPa (SAT minus temper-
the cloudy skies and precipitation weakened the photochem-           ature at 200 hPa; 37.5–47.5◦ N, 110–122.5◦ E; black box in
istry by influencing exposure to ultraviolet rays. In addition,      Fig. 2g), and the correlation coefficient with SDZ O3 con-
precipitation was also an important indicator of the wet re-         centration was 0.49.
moval efficiency (Fig. 2f). High SAT enhanced the photo-                For comparison, the multiple regression equation was built
chemical reactions and resulted in higher surface O3 con-            between the MDA8 and associated weather indices (Fig. 3).
centrations (Fig. 2g). Differently from the SAT, the temper-         Our analysis indicated that the observed MDA8 was fit well

Atmos. Chem. Phys., 19, 3857–3871, 2019                                                www.atmos-chem-phys.net/19/3857/2019/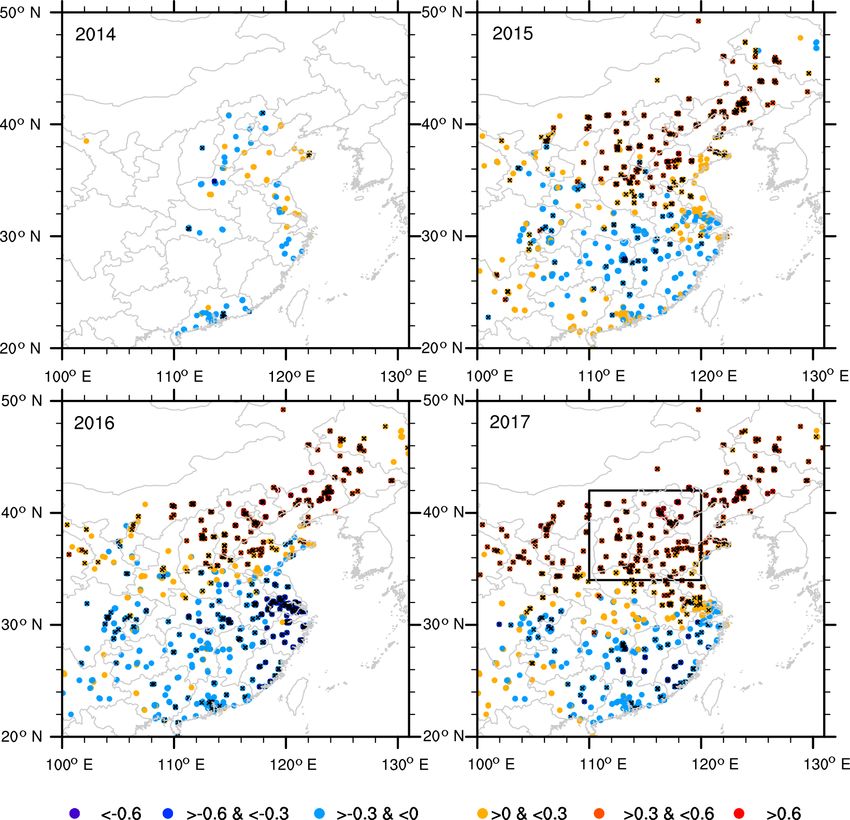
Z. Yin et al.: Links of climate variability in Arctic sea ice                                                                3863

Figure 5. The correlation coefficients between the daily MDA8 and OWI from 2014 to 2017. The black crosses indicate that the CC was
above the 95 % confidence level.

                                                                    events were in the range of OWI > 0, and correspondingly,
                                                                    90.5 % of the NOP events were linked with OWI < 0 (Fig. 4).
                                                                    The correlation coefficients between the OWI and observed
                                                                    MDA8 at the other sites were calculated (Fig. 5). The signif-
                                                                    icantly positive correlations were distributed in North China
                                                                    (Fig. 5b–d). Thus, it is reasonable to analyze the variation in
                                                                    surface O3 -related atmospheric circulations in North China
                                                                    using the OWI, which also extends the study period to the
                                                                    historical period before 2007 and the projected future.
Figure 6. The variation in the JJA mean observed SDZ MDA8
(green) from 2006 to 2017, OWI calculated from ERA-interim
datasets during 1979–2017 (blue) and OWI calculated from NOAA
                                                                    4   Impacts of EU pattern on the interannual variation
datasets during 1979–2014 (red).
                                                                        in surface ozone

                                                                    After the assimilation of satellite data, possible in 1979, the
by the multiple regression equation (Fig. 3). The correla-          quality of reanalysis data improved. Here, the daily OWI
tion coefficient was 0.61 between the fit and daily mea-            was calculated with both ERA-Interim and NCEP/NCAR
sured MDA8 during 2007–2017 (i.e., 92 days × 11 years).             reanalysis data from 1979. According to the above analy-
The correlation coefficient between the observed MDA8 and           sis, the daily OWI could largely represent the variation in
daily OWI was also 0.61 for the 11-year period. Thus, the           MDA8 in North China. The monthly OWI was computed as
OWI was easily constructed by accumulating the normal-              the monthly mean of the daily OWI. During 2007–2017, the
ized weather index and was selected to represent the varia-         constructed JJA (June–July–August) mean OWI varied sim-
tion in surface O3 pollution. A total of 90.3 % of the MOP          ilarly with the observed MDA8 and captured the extremes

www.atmos-chem-phys.net/19/3857/2019/                                                Atmos. Chem. Phys., 19, 3857–3871, 2019
3864                                                                   Z. Yin et al.: Links of climate variability in Arctic sea ice

Figure 7. The associated atmospheric circulation. (a) The correlation coefficients between the JJA mean OWI and surface air temperature
(shading), wind at 200 hPa (arrow) and geopotential height at 500 hPa (contour) from 1979 to 2017. The black dots indicate that the CC
with surface air temperature was above the 95 % confidence level. The cross-section (110–125◦ E mean) correlation coefficients between JJA
mean OWI (b), EU pattern index (c) and relative humidity (shading), temperature (contour), and wind (arrow, vertical speed multiplied by
100) from 1979 to 2017. The black dots indicate that the CC with relative humidity exceeded the 95 % confidence level (t test). The data
used here are from ERA-Interim datasets.

                                                                       ify the performance of the OWI. The JJA mean OWI in 2006
                                                                       successfully reflected the variation in observed MDA8, con-
                                                                       firming the robustness of the OWI. Derived from two differ-
                                                                       ent reanalysis datasets, the OWI ERA and OWI NCEP varied
                                                                       consistently. The above independent verifications proved that
                                                                       the performance of the summer OWI did not depend on the
                                                                       specific reanalysis data. In the following study, the monthly
                                                                       OWI from ERA-interim data and associated physical mecha-
                                                                       nisms were analyzed. From the mid-1980s to the mid-1990s,
Figure 8. The variation in the JJA mean observational SDZ MDA8         the OWI was below zero, with a slightly decreasing trend and
(µg m−3 ; blue) and EU index (geopotential metre – gpm; red) from      insignificant interannual variation. Since then, the OWI has
2007 to 2017.
                                                                       increased; furthermore, the intensity of interannual variation
                                                                       has strengthened. The emissions of O3 precursors increased
                                                                       persistently and linearly due to the steady economic develop-
(Fig. 6). Although the range of the SDZ MDA8 was from                  ment after 1978 in China (Wang, 2017). The strong interan-
2006 to 2017, only the data from 2007 to 2017 were used in             nual variation in the OWI after mid-1990s, representing the
the above OWI construction processes. Thus, the datasets in            impacts of meteorological conditions on O3 concentrations,
2006 were independent samples (i.e., test set) and could ver-

Atmos. Chem. Phys., 19, 3857–3871, 2019                                                  www.atmos-chem-phys.net/19/3857/2019/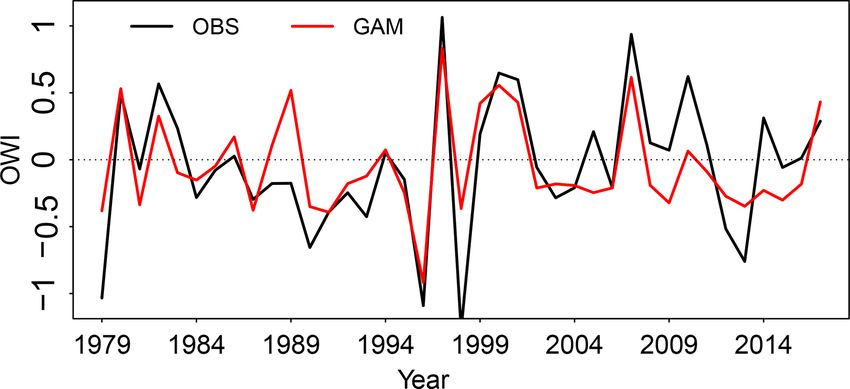
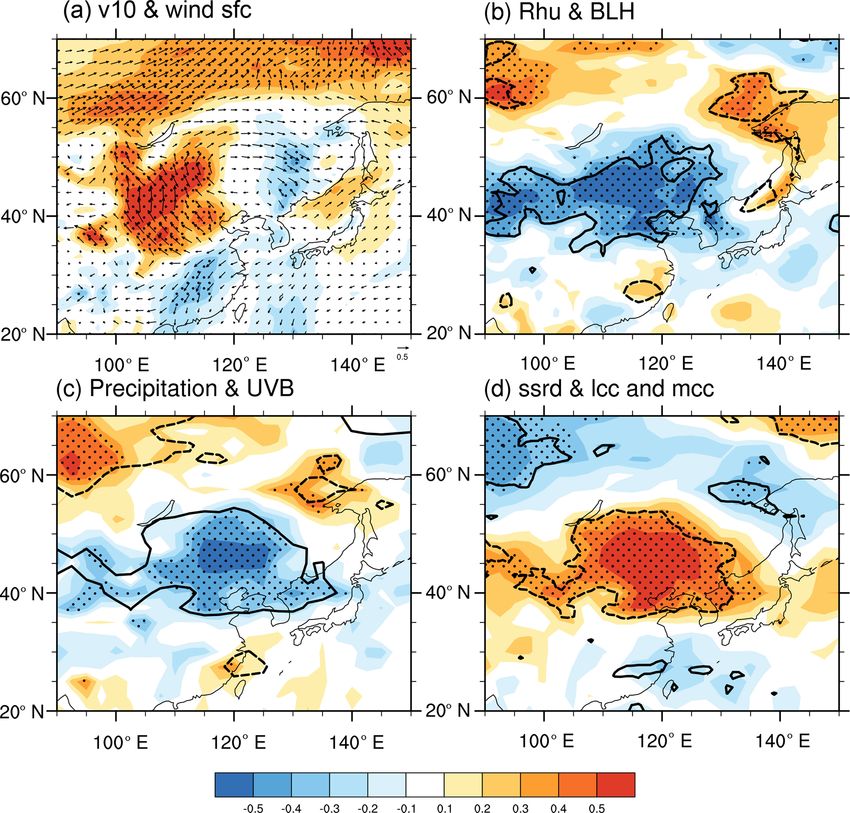
Z. Yin et al.: Links of climate variability in Arctic sea ice                                                                           3865

Figure 9. The associated meteorological conditions. (a) The correlation coefficients between the JJA mean OWI and v wind at 10 m (shading),
surface wind (arrow), (b) relative humidity near the surface (shading), boundary layer height (contour), (c) precipitation (shading), downward
UV radiation at the surface (contour), (d) downward solar radiation at the surface (shading), and sum of low and medium cloud cover
(contour) from 1979 to 2017. The black dots indicate that the CC with temperature was above the 95 % confidence level. The contours
plotted in (b–d) exceeded the 95 % confidence level. The data used here are from ERA-Interim datasets.

contributed to the interannual fluctuations of the surface O3            EU pattern could modulate the local meteorological condi-
pollution. Thus, the impacts of the large-scale atmospheric              tions to enhance the photochemical reactions. The EU pat-
circulations on the summer O3 pollution, especially the re-              tern is considered to be the main reason for the variability
lated OWI, were analyzed.                                                in the severe drought in North China, i.e., resulting in hot
   The atmospheric circulations associated with summer                   and dry climate extremes (Wang and He, 2015). To a cer-
mean OWI, indicated by the correlation coefficients, are dis-            tain extent, the severe drought environment promoted the for-
played in Fig. 7. In the mid-troposphere to upper tropo-                 mation of surface ozone. After 2007, the EU index and the
sphere, cyclonic and anticyclonic anomalies were alternately             observational SDZ MDA8 showed good agreement (Fig. 8).
distributed over the northern Central Siberian Plateau (−),              More than 80 % of the SDZ MDA8 anomalies showed the
North China and Mongolia (+), and the Yellow Sea and                     same mathematical sign as the anomalous EU pattern in-
Sea of Japan (−) (Fig. 7a). These three atmospheric cen-                 dex. Furthermore, the large EU pattern anomalies (i.e., the
ters, propagated from the polar region to the midlatitudes,              |EU pattern index| > 0.8× its standard deviation) always in-
appeared to be the positive phase of EU pattern (Wang and                duced in-phase surface ozone pollution.
He, 2015). This Rossby wave-like train, i.e., the EU pat-                   Under barotropic anticyclonic circulation over North
tern, could also be recognized in the surface air temperature.           China, i.e., one of the active centers of the positive EU pat-
The correlation coefficient between the EU pattern index and             tern, the significant descending air flows indicated efficient
OWI was 0.44 (after detrending and above the 99 % con-                   adiabatic heating (resulting in high temperatures near the
fidence level), indicating that the strengthening of the EU              surface) and dry air (i.e., less cloud cover) below 300 hPa
positive phase contributed to the severe surface O3 pollu-               (Fig. 7c). Furthermore, over North China, the air tempera-
tion in North China. More precisely, the positive phase of               ture anomalies were negative at 200 hPa but positive below

www.atmos-chem-phys.net/19/3857/2019/                                                       Atmos. Chem. Phys., 19, 3857–3871, 2019
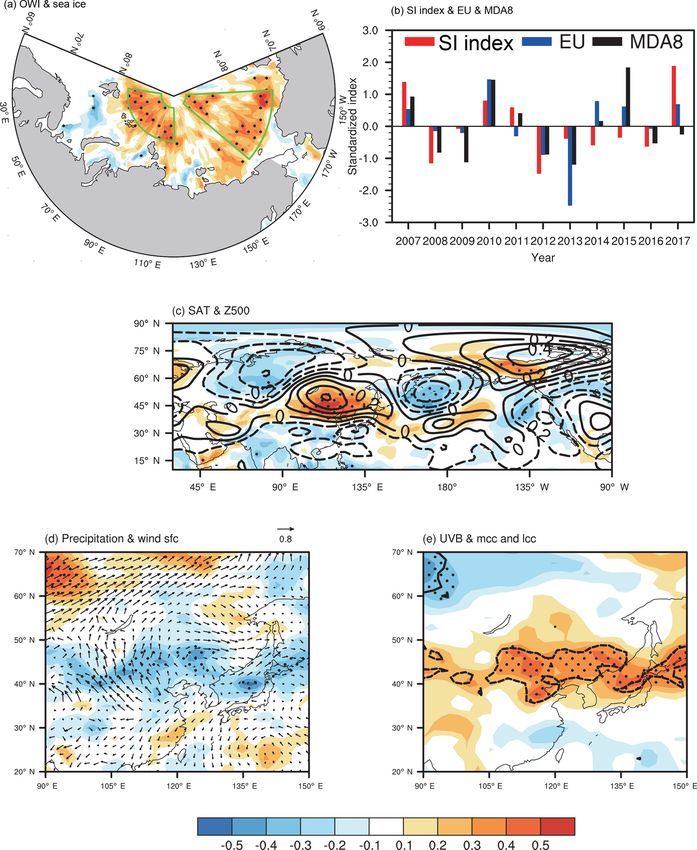
3866                                                                   Z. Yin et al.: Links of climate variability in Arctic sea ice

Figure 10. The role of the Arctic sea ice. (a) The correlation coefficients between the JJA mean OWI and May sea ice. (b) The variation in
the May SI index (red bar, area-averaged sea ice of the green boxes in a), JJA mean EU pattern index (blue bar) and JJA mean observational
SDZ MDA8 (black bar) from 2007 to 2017. (c) The correlation coefficients between the May SI index and surface air temperature (shading),
and geopotential height at 500 hPa (contour) from 1979 to 2017. The black dots indicate that the CC with surface air temperature was above
the 95 % confidence level. (d) The correlation coefficients between the May SI index and precipitation (shading), surface wind (arrow),
(e) downward UV radiation at the surface (shading), and sum of low and medium cloud cover (contour) from 1979 to 2017. The black dots
indicate that the shading CC with precipitation (d) and downward UV radiation (e) was above the 95 % confidence level. The data used here
are from ERA-Interim datasets.

300 hPa, and the relative humidity anomalies were positive at          downward solar radiation and UV radiation (Fig. 9c, d), less
200 hPa but negative below 300 hPa (Fig. 7c). The barotropic           low and medium cloud cover (Fig. 9d), and dry conditions
anticyclonic circulation associated with surface ozone pollu-          (Fig. 9b, c). Without the cover of low and medium clouds,
tion (Fig. 7b) was similar to the positive EU pattern (Fig. 7c)        the shortwave solar radiation, especially the UV radiation,
and led to sunny days, i.e., hot temperatures (Fig. 7a), strong        penetrated straight to the land surface. The photochemical

Atmos. Chem. Phys., 19, 3857–3871, 2019                                                  www.atmos-chem-phys.net/19/3857/2019/
Z. Yin et al.: Links of climate variability in Arctic sea ice                                                               3867

                                                                    fort Sea (Fig. 10a). The averaged (green boxes in Fig. 10a)
                                                                    SI area in May was calculated as the SI index, whose lin-
                                                                    ear correlation coefficient with JJA OWI was 0.67 (after de-
                                                                    trending) from 1979 to 2017. During 2007–2017, 73 % of the
                                                                    May SI anomalies are followed by observational SDZ MDA8
                                                                    anomalies with the same mathematical sign (Fig. 10b). Fur-
                                                                    thermore, the linear and nonlinear relationships were both in-
                                                                    troduced using the generalized additive model (Fig. 11), and
                                                                    the contribution of May sea ice to the interannual variability
Figure 11. The variation in the observational OWI (black) and the
                                                                    in OWI was approximately 60 %.
fitted OWI by the generalized additive model (GAM; red) from
1979 to 2017.
                                                                       These positive sea ice anomalies could induce EU pat-
                                                                    tern responses in the subsequent summer (Fig. 10c). The
                                                                    excited atmospheric and thermal centers were located over
reaction of the O3 precursor was enhanced, generating more          the central Siberian Plateau, North China and Mongolia,
O3 near the surface. The dry atmosphere near the surface, i.e.,     and the Yellow Sea. Similarly, the local meteorological re-
less precipitation and lower relative humidity, accelerated the     sponses, such as anomalous southerlies and less precipitation
photochemical reaction but restricted the wet clearing of the       (Fig. 10d), less cloud, and strong solar radiation (Fig. 10e)
stocked O3 in the atmosphere. A higher BLH (Fig. 9b), re-           were also closely connected with the positive sea ice anoma-
sulting from the strengthening of solar radiation, likely facil-    lies in May. Thus, the preceding May sea ice positively mod-
itated the downward transportation of O3 aloft. Near the sur-       ulated the EU pattern, and then, this Rossby wave train trans-
face, the western part of these anticyclonic anomalies mani-        ported the impacts from the polar region and strengthened
fested as significant southerlies (Fig. 9a), which transported      the anticyclonic anomalies over North China. Finally, suit-
the O3 precursors from the economically developed Yangtze           able meteorological conditions, including hot and dry air,
River Delta. The extraneous O3 precursor, superposed with           anomalous southerlies, and intense sunshine, were induced
local emissions, supported efficient photochemical produc-          to intensify the photochemical production of surface ozone
tion of O3 . To confirm the robustness of the atmospheric           pollution. To confirm the roles of Arctic sea ice and associ-
circulations and associated physical mechanisms, the above          ated physical mechanisms, the above analysis was repeated
analysis was repeated with the NCEP/NCAR data, and iden-            with the NCEP/NCAR data, and identical results were ob-
tical results were obtained (Figs. S5–S6 in the Supplement).        tained (Fig. S7 in the Supplement).
The correspondence between large-scale EU teleconnection               The causality, i.e., the preceding May sea ice anomalies
and anticyclonic circulations were clear. Local meteorologi-        contributing to the subsequent JJA OWI in North China, was
cal conditions, such as hot land surface (Fig. S5 in the Sup-       also confirmed by CAM5. During the control experiment
plement), violet solar radiation (Fig. S6c, d in the Supple-        (CTRL), the CAM5 model was first integrated for 20 years
ment), a clear sky (Fig. S6d in the Supplement), less precipi-      with climate mean initial and boundary conditions. Next, the
tation (Fig. S6c) and lower relative humidity (Fig. S6b in the      data from 1 September of the last 5 years (i.e., 16–20 years)
Supplement) were also clearly recognized. Thus, the impacts         were designated as five slightly different initial conditions.
of the atmospheric circulations were confirmed by both the          With each initial condition, the CAM5 model integrated for
ERA-Interim and NCEP/NCAR data, i.e., the analyses and              10 years. The JJA mean results of the last 6 years (i.e.,
conclusions were independent of datasets.                           6 years × 5 groups = 30 ensembles) were employed as the
                                                                    output of the CTRL. On the basis of CTRL, the May sea ice
                                                                    concentration in the two boxes of Fig. 10a was separately
5   Roles of the Arctic sea ice                                     reduced by 10 % (denoted as LowASI experiments), i.e., a
                                                                    total of 30 sensitivity runs. Similarly, the JJA mean results
The positive EU pattern enhanced the local anticyclonic cir-        of the 30 sensitive runs were employed as the output of the
culation over North China and facilitated the photochemi-           LowASI. The differences (LowASI minus CTRL) represent
cal processes leading to the formation of surface ozone. The        the responses of atmospheric circulations and meteorological
EU pattern originated from the Arctic region. The preced-           conditions to the declining May sea ice.
ing sea ice anomalies could stimulate atmospheric responses            It was evident that an EU Rossby wave train was in-
like the EU pattern in summer (Wang and He, 2015) Thus,             duced on the mid-troposphere (Fig. 12a), which propagated
the role of Arctic sea ice on the OWI was also explored in          from the Taymyr Peninsula (−), northeastern China (+), to
this study. The correlation between the sea ice and JJA OWI         the east of China and the Western Pacific (+). Under such
was evaluated each month (figure omitted), and we found that        large-scale atmospheric anomalies, the anomalies of relative
the interannual variation in OWI was significantly correlated       humidity were significantly positive and resulted in denser
with May sea ice conditions to the north of Eurasia, espe-          low cloud cover in North China (Fig. 12d). Furthermore,
cially near the Gakkel Ridge, the Canada Basin and the Beau-        the cover of cloud efficiently prevented the solar radiation

www.atmos-chem-phys.net/19/3857/2019/                                               Atmos. Chem. Phys., 19, 3857–3871, 2019
3868 Z. Yin et al.: Links of climate variability in Arctic sea ice
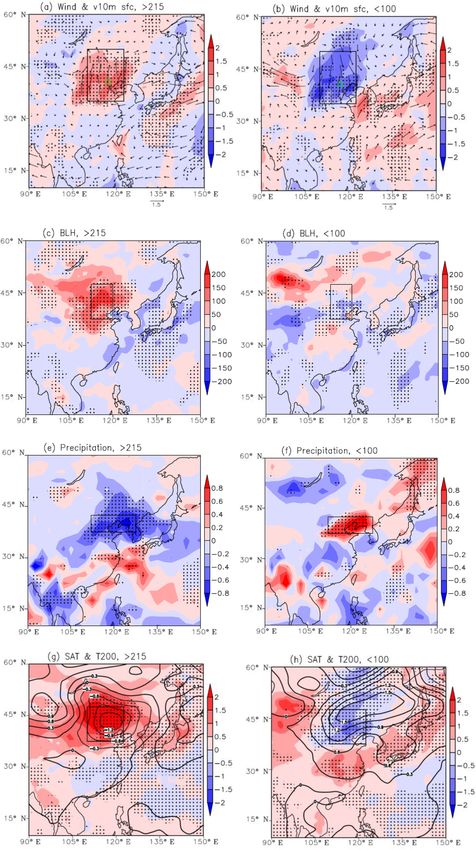
Figure 12. Composite results of the LowASI experiments (LowASI minus CTRL) by the CAM5 model: (a) geopotential height at 500 hPa,
(b) preciptation, (c) net radiative flux at the top of the atmosphere (shading) and temperature at 925 hPa (contour), and (d) sum of low and
medium cloud fraction (shading) and relative humidity at 925 hPa (contour). The black hatching denotes the differences with shading that
was above the 95 % confidence level (t test).
from reaching the land surface, meanwhile cooling the air in 6 Conclusions and discussions
the boundary layer (Fig. 12c). Without hot and dry air and
intense sunshine, the photochemical production was signif-
Recently, the summer surface O3 concentrations and the
icantly decelerated, and the generation of surface O3 was
number of O3 observation stations have steadily increased
rather weak. Additionally, sufficient moisture and clouds
in China. In general, the O3 concentrations in North China
caused more rainfall (Fig. 12c). The wet deposition effect
were substantially higher than those in southern China. To
might be enhanced. Thus, corresponding to less Arctic sea
reveal the climatic driver of summer surface O3 pollution in
ice in May, the photochemical process to generate O3 was
North China, a daily OWI (i.e., surface O3 weather index)
weakened, and the wet deposition effect to decrease O3 was
was constructed based on meteorological and ozone observa-
enhanced. That is, the positive relationship and associated
tions. The robustness of this index (i.e., OWI) was verified by
physical mechanisms (i.e., climate links in ASI, EU pattern
the ERA-Interim and NCEP/NCAR reanalysis datasets and
and summer surface ozone pollution in North China) were
surface O3 measurements. May Arctic sea ice was found to
causally verified.
be a preceding and efficient climatic driver, which may help
with seasonal forecasting. In the historical period, variation
in Arctic sea ice can explain approximately 60 % of the inter-
Atmos. Chem. Phys., 19, 3857–3871, 2019 www.atmos-chem-phys.net/19/3857/2019/Z. Yin et al.: Links of climate variability in Arctic sea ice 3869
annual variability in the summer OWI in North China, which http://www.ecmwf.int/en/research/climate-reanalysis/era-interim
was closely associated with the surface O3 pollution. Cur- (ERA-Interim, last access: 8 April 2018). The daily mean
rently, the Arctic region has been warming approximately and monthly reanalysis data archive supported by the
twice as much as the global average (Huang et al., 2017; National Oceanic and Atmospheric Administration are
Zhou, 2017), indicating accelerated change in the sea ice. available from http://www.esrl.noaa.gov/psd/data/gridded/
data.ncep.reanalysis.html (NCEP/NCAR, last access: 12
Thus, understanding the role of Arctic sea ice may contribute
April 2018). The BLH dataset can be obtained from
to the understanding of seasonal variability in O3 pollution. https://www.esrl.noaa.gov/psd/data/gridded/data.narr.html (NARR,
The EU pattern acted as an atmospheric bridge to link last access: 12 April 2018). Daily precipitation datasets are
May Arctic sea ice and the summer surface O3 pollution from https://www.esrl.noaa.gov/psd/cgibin/db_search/DBSearch.
in North China. The accumulated sea ice in May could in- pl?Variable=Precipitation&group=0&submit=Search (CPC, last
duce the positive EU phase. The anticyclonic circulation over access: 12 April 2018).
North China, i.e., one of the active centers of the EU pat-
tern, was connected with high surface temperature, strong
downward solar radiation, less low- and medium-altitude Supplement. The supplement related to this article is available
cloud cover, and drought over North China. Under such lo- online at: https://doi.org/10.5194/acp-19-3857-2019-supplement.
cal meteorological conditions, the photochemical reactions
to produce surface O3 were supported. Generally, these an-
ticyclonic anomalies over North China were barotropic and Author contributions. ZY and HW designed the research. ZY, YL
could persist for a long time; thus, the processes that produce and XM performed research. ZY and XZ analyzed data. ZY pre-
surface O3 were continuous to achieve a high concentration. pared the paper with contributions from all co-authors.
The connections revealed in this study were based on long-
term meteorological measurements and were causally veri-
Competing interests. The authors declare that they have no conflict
fied by well-designed numerical experiments.
of interest.
In order to extend the time range of this study, the OWI
was constructed in North China. Although the feasibility of
the construction approach was strictly examined, the OWI Acknowledgements. This research was supported by the National
was still a substitution focusing on the impacts of the weather Key Research and Development Plan (2016YFA0600703), the
conditions. When discussing the impacts of atmospheric cir- National Natural Science Foundation of China (91744311 and
culations, the linear trend was removed to weaken the signal 41705058), and the Jiangsu Innovation and Entrepreneurship team.
of anthropogenic emissions. Thus, the results in this study
concentrated on and emphasized the meteorological and cli-
mate factors. However, there is no doubt that the polluted Review statement. This paper was edited by Bryan N. Duncan and
emissions are the fundamental inducement of the surface O3 reviewed by two anonymous referees.
pollution. The joint effects of the climate anomalies and the
historical emissions should be studied using the numerical
models in the future. The EU pattern was a well-known con-
tinental Rossby wave train and could link the midlatitude– References
high-latitude climate with the change in the Arctic. Although
An, J. L., Wang, Y. S., and Sun, Y.: Assessment of ozone variations
the connection between the Arctic sea ice and the ozone pol-
and meteorological effects in Beijing, Ecol. Environ. Sci., 18,
lution was revealed, the separate roles of the sea ice near the 944–951, 2009.
Gakkel Ridge, the Canada Basin and Beaufort Sea should be Barnes, E. A. and Fiore, A. M.: Surface ozone variability and the jet
intensively studied in the future. position: Implications for projecting future air quality, Geophys.
Res. Lett., 40, 2839–2844, 2013.
Cai, W. J., Li, K., Liao, H., Wang, H. J., and Wu, L. X.:
Data availability. Hourly O3 concentration data can be Weather Conditions Conducive to Beijing Severe Haze More
downloaded from http://beijingair.sinaapp.com/ (Ministry of Frequent under Climate Change, Nat. Clim. Change, 7, 257–262,
Environmental Protection of China, last access: 20 March https://doi.org/10.1038/nclimate3249, 2017.
2018). Hourly O3 concentration data at the Shangdianzi Chen, M., Shi, W., Xie, P., Silva, V. B. S., Kousky, V. E., Higgins,
station are available from http://beijingair.sinaapp.com/ R. W., and Janowiak, J. E.: Assessing objective techniques for
(National Meteorological Information Center, China Me- gauge-based analyses of global daily precipitation, J. Geophys.
teorological Administration, last access: 20 March 2018). Res., 113, D04110, 2008.
Sea ice concentration data are from the following website: Chen, Y., Ebenstein, A., Greenstone, M., and Li, H.: Ev-
https://www.metoffice.gov.uk/hadobs/hadisst/data/download.html idence on the impact of sustained exposure to air pol-
(Met Office Hadley Centre, last access: 8 April 2018). lution on life expectancy from China’s Huai River
Daily mean and monthly mean ERA-Interim reanalysis policy, P. Natl. Acad. Sci. USA, 110, 12936–12941,
datasets can be downloaded from the ERA-Interim website: https://doi.org/10.1073/pnas.1300018110, 2013.
www.atmos-chem-phys.net/19/3857/2019/ Atmos. Chem. Phys., 19, 3857–3871, 20193870 Z. Yin et al.: Links of climate variability in Arctic sea ice Christoudias, T., Pozzer, A., and Lelieveld, J.: Influence of the Lin, M. Y., Horowitz, L. W., Oltmans, S. J., Fiore, A. M., and Fan, North Atlantic Oscillation on air pollution transport, Atmos. S. M.: Tropospheric ozone trends at Mauna Loa Observatory tied Chem. Phys., 12, 869–877, https://doi.org/10.5194/acp-12-869- to decadal climate variability, Nat. Geosci., 7, 136–143, 2014. 2012, 2012. Liu, H., Liu, S., Xue, B. R., Lv, Z. F., Meng, Z. H., Yang, X. F., Xue, Dee, D. P., Uppala, S. M., Simmons, A. J., Berrisford, P., Poli, T., Yu, Q., and He, K. B.: Ground-level ozone pollution and its P., Kobayashi, S., Andrae, U., Balmaseda, M. A., Balsamo, health impacts in China, Atmos. Environ., 173, 223–230, 2018. G., Bauer, P., Bechtold, P., and Beljaars, A. C. M.: The ERA- Liu, R. J. and Liao, H.: Assessment of aerosol effective radia- Interim reanalysis: configuration and performance of the data tive forcing and surface air temperature response over eastern assimilation system, Q. J. Roy. Meteorol. Soc., 137, 553–597, China in CMIP5 models, Atmos. Ocean. Sci. Lett., 10, 228–234, https://doi.org/10.1002/qj.828, 2011. https://doi.org/10.1080/16742834.2017.1301188, 2017. Doherty, R. M., Wild, O., and Shindell, D. T., Zeng, G., MacKenzie, Ma, Z., Xu, J., Quan, W., Zhang, Z., Lin, W., and Xu, I. A., Collins, W. J., Fiore, A. M., Stevenson, D. S., Dentener, F. X.: Significant increase of surface ozone at a rural site, J., Schultz, M. G., Hess, P., Derwent, R. G., and Keating, T. J.: north of eastern China, Atmos. Chem. Phys., 16, 3969–3977, Impacts of climate change on surface ozone and intercontinental https://doi.org/10.5194/acp-16-3969-2016, 2016. ozone pollution: A multi-model study, J. Geophys. Res.-Atmos., Meehl, G. A., Washington, W. M., Arblaster, J. M., Hu, A., Teng, 118, 3744–3763, 2013. H., Kay, J. E., Gettelman, A., Lawrence, D. M., Sanderson, B. Gaudel, A., Cooper, O. R., Ancellet, G., Barret, B., Boynard, A., M., and Strand, W. G.: Climate change projections in CESM1 Burrows, J. P., Clerbaux, C., Coheur, P.-F., Cuesta, J., Cuevas, E., (CAM5) compared to CCSM4, J. Climate, 26, 6287–6308, 2013. Doniki, S., Dufour, G., Ebojie, F., Foret, G., Garcia, O., Grana- Melkonyan, A. and Wagner, P.: Ozone and its projection in regard dos Muños, M. J., Hannigan, J. W., Hase, F., Huang, G., Hassler, to climate change, Atmos. Environ., 67, 287–295, 2013. B., Hurtmans, D., Jaffe, D., Jones, N., Kalabokas, P., Kerridge, Pausata, F. S. R., Pozzoli, L., Vignati, E., and Dentener, F. J.: North B., Kulawik, S. S., Latter, B., Leblanc, T., Le Flochmoën, E., Atlantic Oscillation and tropospheric ozone variability in Eu- Lin, W., Liu, J., Liu, X., Mahieu, E., McClure-Begley, A., Neu, rope: model analysis and measurements intercomparison, At- J. L., Osman, M., Palm, M., Petetin, H., Petropavlovskikh, I., mos. Chem. Phys., 12, 6357–6376, https://doi.org/10.5194/acp- Querel, R., Rahpoe, N., Rozanov, A., Schultz, M. G., Schwab, 12-6357-2012, 2012. J., Siddans, R., Smale, D., Steinbacher, M., Tanimoto, H., Tara- Pu, X., Wang, T. J., and Huang, X., Melas, D., Zanis, P., Papanas- sick, D. W., Thouret, V., Thompson, A. M., Trickl, T., Weather- tasiou, D. K., and Poupkou, A.: Enhanced surface ozone during head, E., Wespes, C., Worden, H. M., Vigouroux, C., Xu, X., and the heat wave of 2013 in Yangtze River Delta region, China, Sci. Zeng, G.: Tropospheric Ozone Assessment Report: Present-day Total Environ., 603–604, 807–816, 2017. distribution and trends of tropospheric ozone relevant to climate Rayner, N. A., Parker, D. E., Horton, E. B., Folland, C. K., Alexan- and global atmospheric chemistry model evaluation, Elem. Sci. der, L. V., Rowell, D. P., Kent, E. C., and Kaplan, A.: Global Anth., 6, 39 pp., 2018. analyses of sea surface temperature, sea ice, and night marine air Giese, B. S., Seidel, H. F., Compo, G. P., and Sardeshmukh, P. D.: temperature since the late nineteenth century, J. Geophys. Res., An ensemble of ocean reanalyses for 1815–2013 with sparse 108, 4407, https://doi.org/10.1029/2002JD002670, 2003. observational input, J. Geophys. Res.-Ocean., 121, 6891–6910, Shi, C., Wang, S., Liu, R., Zhou, R., Li, D., and Wang, W.: A study https://doi.org/10.1002/2016JC012079, 2016. of aerosol optical properties during ozone pollution episodes in Hastie, T. J. and Tibshirani, R. J.: Generalized Additive Models, 2013 over Shanghai, China, Atmos. Res., 153, 235–249, 2015. Chapman & Hall, London, UK, 1–10, 1990. Sun, L., Xue, L., Wang, Y., Li, L., Lin, J., Ni, R., Yan, Y., Chen, Huang, X. T., Diao, Y. N., and Luo, D. H.: Amplified win- L., Li, J., Zhang, Q., and Wang, W.: Impacts of meteorology and ter Arctic tropospheric warming and its link to atmospheric emissions on summertime surface ozone increases over central circulation changes, Atmos. Ocean. Sci. Lett., 10, 435–445, eastern China between 2003 and 2015, Atmos. Chem. Phys., 19, https://doi.org/10.1080/16742834.2017.1394159, 2017. 1455–1469, https://doi.org/10.5194/acp-19-1455-2019, 2019. Kalnay, E., Kanamitsu, M., Kistler, R., Collins, W., Deaven, D., Tang, B. Y., Xin, J. Y., Gao, W. K., Shao, P., Su, H. J., Gandin, L., Iredell, M., Saha, S., White, G., Woollen, J., Zhu, Y., Wen, T. X., Song, T., Fan, G. Z., Wang, S. G., and Wang, Leetmaa, A., Reynolds, R., Chelliah, M., Ebisuzaki, W., Higgins, Y. S.: Characteristics of complex air pollution in typical W., Janowiak, J., Mo, K. C., Ropelewski, C., Wang, J., Jenne, cities of North China, Atmos. Ocean. Sci. Lett., 11, 29–36, R., and Joseph, D.: The NCEP/NCAR 40-year reanalysis project, https://doi.org/10.1080/16742834.2018.1394158, 2018. B. Am. Meteor. Soc., 77, 437–471, https://doi.org/10.1175/1520- The environmental statistics unit of stat-center in Perking Univer- 0477(1996)0772.0.CO;2, 1996. sity, Air quality Assessment Report (5): the assessments of the Li, K., Jacob, D. J., Liao, H., Shen, L., Zhang, Q., and Bates, K. regional pollutions in “2+31” cities during 2013–2017, avail- H.: Anthropogenic drivers of 2013–2017 trends in summer sur- able at: http://songxichen.gsm.pku.edu.cn/index.php/Research/ face ozone in China, P. Natl. Acad. Sci. USA, 116, 422–427, #tab_34 (last access: 23 March 2018), 2018. https://doi.org/10.1073/pnas.1812168116, 2018. The Ministry of Environmental Protection of China: Technical Reg- Li, R. X. and Sun, J. Q.: Interdecadal variability of the large- ulation on Ambient Air Quality Index, 1 pp., http://www.gov. scale extreme hot event frequency over the middle and cn/zwgk/2012-03/02/content_2081374.htm (last access: 3 April lower reaches of the Yangtze River basin and its related 2018), 2012. atmospheric patterns, Atmos. Ocean. Sci. Lett., 11, 63–70, Tong, L., Zhang, H. L., Yu, J., He, M. M., Xu, N. B., Zhang, J. J., https://doi.org/10.1080/16742834.2017.1335580, 2018. Qian, F., Z., Feng, J. Y., and Xiao, H.: Characteristics of surface Atmos. Chem. Phys., 19, 3857–3871, 2019 www.atmos-chem-phys.net/19/3857/2019/
Z. Yin et al.: Links of climate variability in Arctic sea ice                                                                        3871

  ozone and nitrogen oxides at urban, suburban and rural sites in      Yang, Y., Liao, H., and Li, J.: Impacts of the East Asian sum-
  Ningbo, China, Atmos. Res., 187, 57–68, 2017.                          mer monsoon on interannual variations of summertime surface-
Wallace, J. M. and Gutzler, D. S.: Teleconnections in the geopo-         layer ozone concentrations over China, Atmos. Chem. Phys., 14,
  tential height field during the Northern Hemisphere winter, Mon.       6867–6879, https://doi.org/10.5194/acp-14-6867-2014, 2014.
  Weather Rev., 109, 784–812, 1981.                                    Yin, Z. C., Wang, H. J., and Guo, W. L.: Climatic change features of
Wang, H. J.: On assessing haze attribution and control mea-              fog and haze in winter over North China and Huang-Huai Area,
  sures in China, Atmos. Ocean. Sci. Lett., 11, 120–122,                 Sci. China Earth Sci., 58, 1370–1376, 2015.
  https://doi.org/10.1080/16742834.2018.1409067, 2018.                 Zhao, Z. J. and Wang, Y. X.: Influence of the West Pacific subtrop-
Wang, H. J. and He, S. P.: The North China/Northeastern Asia Se-         ical high on surface ozone daily variability in summertime over
  vere Summer Drought in 2014, J. Climate, 28, 6667–6681, 2015.          eastern China, Atmos. Environ., 180, 197–204, 2017.
Wang, N. and Zhang, Y.: Evolution of Eurasian teleconnection pat-      Zhou, W.: Impact of Arctic amplification on East Asian
  tern and its relationship to climate anomalies in China, Clim. Dy-     winter climate, Atmos. Ocean. Sci. Lett., 10, 385–388,
  nam., 44, 1017–1028, 2015.                                             https://doi.org/10.1080/16742834.2017.1350093, 2017.
Wang, T.: Ozone pollution in China: A review of concentrations,        Zhu, J. and Liao, H.: Future ozone air quality and radiative forcing
  meteorological influences, chemical precursors, and effects, Sci.      over China owing to future changes in emissions under the Rep-
  Total Environ., 575, 1582–1596, 2017.                                  resentative Concentration Pathways (RCPs), J. Geophys. Res.-
Wang, T., Ding, A., Gao, J., and Wu, W. S.: Strong ozone production      Atmos., 121, 1978–2001, 2016.
  in urban plumes from Beijing, China, Geophys. Res. Lett., 33,
  320–337, 2006.
Wang, Y. X., Shen, L. L., Wu, S. L., Mlckley, L., He, J. W., and
  Hao, J. M.: Sensitivity of surface ozone over China to 2000–2050
  global changes of climate and emissions, Atmos. Environ., 75,
  372–382, 2013.
Watts, N., Amann, M., Ayeb-Karlsson, S., Belesova, K., Bouley,
  T., Boykoff, M., Byass, P., Cai, W. J., Campbell-Lendrum, D.,
  Chambers, J., Cox, P. M., Daly, M., Dasandi, N., Davies, M.,
  Depledge, M., Depoux, A., Dominguez-Salas, P., Drummond, P.,
  Ekins, P., Flahault, A., Frumkin, H., Georgeson, L., Ghanei, M.,
  Grace, D., Graham, H., Grojsman, R., Haines, A., Hamilton, I.,
  Hartinger, S., Johnson, A., Kelman, I., Kiesewetter, G., Kniveton,
  D., Liang, L., Lott, M., Lowe, R., Mace, G., Sewe, M. O., Maslin,
  M., Mikhaylov, S., Milner, J., Latifi, A. M., Moradi-Lakeh, M.,
  Morrissey, K., Murray, K., Neville, T., Nilsson, M., Oreszczyn,
  T., Owfi, F., Pencheon, D., Pye, S., Rabbaniha, M., Robinson,
  E., Rocklov, J., Schutte, S., Shumake-Guillemot, J., Steinbach,
  R., Tabatabaei, M., Wheeler, N., Wilkinson, P., Gong, P., Mont-
  gomery, H., and Costello, A.: The Lancet Countdown on health
  and climate change: From 25 years of inaction to a global trans-
  formation for public health, Lancet, 391, 10–16, 2018.

www.atmos-chem-phys.net/19/3857/2019/                                                    Atmos. Chem. Phys., 19, 3857–3871, 2019
You can also read