Listeria Monocytogenes Biofilm Removal Using Different Commercial Cleaning Agents - MDPI
←
→
Page content transcription
If your browser does not render page correctly, please read the page content below
molecules
Article
Listeria Monocytogenes Biofilm Removal Using
Different Commercial Cleaning Agents
Annette Fagerlund, Even Heir, Trond Møretrø and Solveig Langsrud *
 Nofima, Norwegian Institute of Food, Fisheries and Aquaculture Research, 1433 Ås, Norway;
 annette.fagerlund@nofima.no (A.F.); even.heir@nofima.no (E.H.); trond.moretro@nofima.no (T.M.)
 * Correspondence: solveig.langsrud@nofima.no

 Received: 17 December 2019; Accepted: 10 February 2020; Published: 12 February 2020

 Abstract: Effective cleaning and disinfection (C&D) is pivotal for the control of Listeria monocytogenes
 in food processing environments. Bacteria in biofilms are protected from biocidal action, and effective
 strategies for the prevention and removal of biofilms are needed. In this study, different C&D
 biofilm control strategies on pre-formed L. monocytogenes biofilms on a conveyor belt material were
 evaluated and compared to the effect of a conventional chlorinated, alkaline cleaner (agent A).
 Bacterial reductions up to 1.8 log were obtained in biofilms exposed to daily C&D cycles with
 normal user concentrations of alkaline, acidic, or enzymatic cleaning agents, followed by disinfection
 using peracetic acid. No significant differences in bactericidal effects between the treatments were
 observed. Seven-day-old biofilms were more tolerant to C&D than four-day-old biofilms. Attempts to
 optimize biofilm eradication protocols for four alkaline, two acidic, and one enzymatic cleaning agent,
 in accordance with the manufacturers’ recommendations, were evaluated. Increased concentrations,
 the number of subsequent treatments, the exposure times, and the temperatures of the C&D agents
 provided between 4.0 and >5.5 log reductions in colony forming units (CFU) for seven-day-old
 L. monocytogenes biofilms. Enhanced protocols of conventional and enzymatic C&D protocols have the
 potential for improved biofilm control, although further optimizations and evaluations are needed.

 Keywords: cleaning; disinfection; biofilm; Listeria monocytogenes; food safety; enzymatic cleaning

1. Introduction
     Cleaning and disinfection (C&D) in food industry premises are important to ensure microbial
food quality and safety. The cleaning process removes food residues, soils, and organic matter that
accumulate on surfaces during the production. In some cases, a bactericidal effect is also achieved [1].
Most commonly, alkaline foam or gel cleaning agents are used for the open cleaning of processing
equipment, walls, and floors. The caustics act through the solubilization, swelling, and degradation of
food soils, which aids the removal of soils from the surfaces. The cleaning agents may also contain
additives such as surfactants, sequestrants, and hypochlorite, which improve wetting, degradation,
and the removal of soils [2–4]. Acidic foam cleaners are used occasionally by some companies to
remove mineral deposits. Fluid-processing equipment (e.g., pasteurizers) is cleaned with non-foaming
alkaline and/or acidic agents, which are often used at higher concentrations and temperatures than
employed during open cleaning. After cleaning, food contact surfaces (and often also floors and walls)
are usually disinfected to further reduce the number of microorganisms to obtain a level that ensures
the production of safe food that meets the expected shelf life [5].
     The pathogen Listeria monocytogenes is frequently found to persist in food processing plants despite
thorough and regular C&D [6–8]. It has been shown to persist in specific niches, and drains, slicers,
and conveyors are common harborage sites [9,10]. The exact reason for this persistence is not clear,
and it could be linked to both properties of the bacterium itself (e.g., growth at low temperatures,

Molecules 2020, 25, 792; doi:10.3390/molecules25040792                       www.mdpi.com/journal/molecules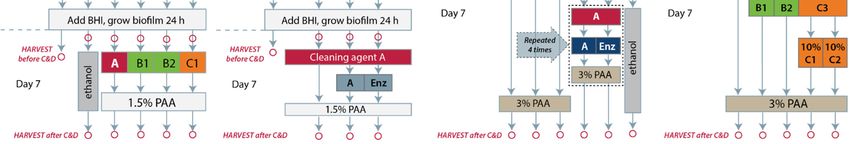
Molecules 2020, 25, 792                                                                             2 of 15

specific disinfectant resistance mechanisms, and biofilm production) and to the niches where it is most
commonly found (difficult to reach by C&D, humid, collecting nutrients) [6,8]. Nevertheless, sanitation
is used both as a preventive and corrective action [11–13] in Listeria control programs. It is recommended
to apply the recommended user concentrations, temperatures, and times set by manufacturers of C&D
agents, but this approach may not be sufficient to eradicate L. monocytogenes. Fagerlund et al. [14]
showed limited effects of cleaning with a regular alkaline cleaning agent followed by disinfection
(several common disinfectants were applied) on L. monocytogenes established in mono- and multispecies
biofilms on conveyor belts. The belt material was designed with a relatively smooth polyvinyl chloride
(PVC) top layer, while the underside was an impregnated woven polyester fabric, and L. monocytogenes
seemed to be trapped and protected in biofilms within the fibers on the underside of the belt. Similarly,
Chaturongkasumrit et al. [15] showed that it was difficult to eliminate L. monocytogenes biofilms growing
on a polyurethane conveyor belt material by cleaning with an alkaline foam followed by disinfection
with Tego-51 (an amphoteric disinfectant). The efficacy was poorer on worn belt materials, which had
rougher surfaces. They showed that a slightly better reduction could be obtained by doubling the
concentrations of chemicals, but a total eradication of L. monocytogenes was not achievable through a
regular C&D regime. Indeed, most studies have found that regular C&D agents are not able to remove
neither laboratory nor industrial biofilms without applying shear stress, elevated temperatures, and/or
an increased holding time (see e.g., [1,16–20]). However, there are some exceptions. For example,
Reynisson et al. [21] studied laboratory biofilms produced by a fish bacterial flora and concluded that
the biofilms were eliminated under regular C&D concentrations and temperatures, and they suggested
that the industry could reduce concentrations.
      In a «seek & destroy» strategy to combat L. monocytogenes in the food production environment, it has
been suggested to use heat treatment of whole equipment or parts of it to eliminate L. monocytogenes,
when regular C&D after dismantling is not sufficient [12,13]. Other alternatives were to sanitize with
70% alcohol or high concentrations of quaternary ammonium compounds (QAC) without subsequent
rinsing. There are several reasons for the industry not implementing these strategies: Heat treatment
is often not possible for practical reasons, ethanol cannot be used extensively for health and safety
reasons, and concerns about resistance buildup or QAC transfer to food products are expressed among
food producers. Another drawback of these approaches is that the soils and nutrients are not removed,
and niches where L. monocytogenes can establish are therefore maintained. Enzymatic cleaning agents
are available on the market and could be an option to regular alkaline foams to remove residual soil,
but they are still not commonly used [22,23]. Most enzymes suggested or used as antibiofilm agents
target the polymeric substances of the extracellular matrix of bacteria (see e.g., [24–30]). Therefore,
the detergents and enzymes in these cleaning agents are likely to create a disruption and dispersal of
biofilms that may cause more effective access for disinfectants and provide potent biofilm eradication
and microbial control.
      Compared with disinfectants, comparative studies on cleaning agents for removing
L. monocytogenes biofilms are few, and as far as we know, the effect of commercial cleaning agents has
not been investigated. Furthermore, manufacturers of C&D agents recommend approaches to remove
biofilms that have not been documented in systematic studies. The aim of this work was to compare the
efficacy of different recommended cleaning approaches to remove established L. monocytogenes biofilms.
To simulate a worst-case scenario, we employed the same conveyor belt L. monocytogenes biofilm model
system as described in Fagerlund et al. [14], where a common niche for L. monocytogenes is combined
with L. monocytogenes strains that have shown persistence in the food industry, and L. monocytogenes
were allowed to form biofilms for four days prior to C&D. A typical «standard» cleaning process
was compared with cleaning processes recommended for biofilm removal and curative treatment.
Protocols and in-use concentrations of the cleaning agents were in accordance with the manufacturer’s
suggestions. A disinfection step with peracetic acid was included to simulate a complete C&D process.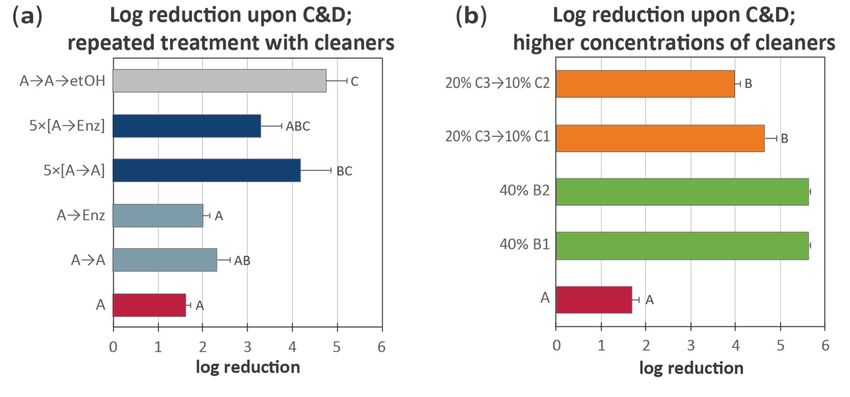
Molecules 2020, 25, 792                                                                                                   3 of 15

2. Materials and Methods

2.1. Bacterial Strains and Growth Conditions
     A mixture of seven L. monocytogenes strains, belonging to different phylogenetic clusters, were used
as inoculum in the current study: L. monocytogenes strains (MLST sequence types in parenthesis): MF4536
(ST9), MF5376 (ST7), MF5634 (ST121), MF5377 (ST8), MF4565 (ST18), MF5630 (ST19), and MF5378
(ST394). The selected strains were the same strains as those previously used [14], which were originally
isolated by Møretrø et al. [31].
     Bacteria were grown in brain heart infusion (BHI) broth (Oxoid, Basingstoke, UK). Overnight
cultures were grown in 5 mL volumes in culture tubes at 30 ◦ C with shaking. All biofilm and growth
experiments were carried out at 12 ◦ C. For plating, RAPID’L. mono (RLM) agar plates (Bio-Rad, Oslo,
Norway) and BHI agar (Oxoid, Basingstoke, UK) plates were used.

2.2. Cleaning and Disinfection (C&D) Agents
     The selected chemical cleaning agents were purchased from manufacturers in Norway with high
market share and are listed in Table 1. The enzymatic cleaning agent was from another European
company. The companies provided information about the following: (i) Selection of cleaning agent
for regular use (cleaning agent A); (ii) Selection of cleaning agents for removal of L. monocytogenes
biofilms (B1, B2, C2, Enzymatic agent); and (iii) Selection of cleaning agents and time/concentration
combinations for curative cleaning (B1, B2, C1, C2, C3, Enzymatic agent). The agents were used
at the minimum recommended user concentrations, unless otherwise specified. All manufacturers
recommended the dismantling of equipment and thorough mechanical scrubbing, as well as relatively
high temperatures (45 ◦ C or higher) for curative cleaning. All cleaning agents were freshly prepared
before use. The ethanol solution was not recommended as a cleaning agent but was included, because
some food processing factories use it to clean/disinfect conveyor belts before or after breaks.

                                 Table 1. Cleaning agents used in the current study.

        Product                 Recommended Use1                                       Intended Use
                                                                      Chlorinated alkaline foam cleaner for the regular
        Agent A                         2–5%
                                                                                 cleaning of open surfaces
                                                                    Strong alkaline foam–gel for cleaning heavily soiled
       Agent B1                         2–8%
                                                                                         surfaces
                                                                    Chlorinated alkaline foam for the regular cleaning of
       Agent B2                         3–6%
                                                                                       open surfaces
                                                                  Strong acidic foam cleaner for the removal of protein and
       Agent C1                        1–10%
                                                                                    mineral salt fouling
                                                                  Acidic cleaner for the removal of protein and mineral salt
       Agent C2                        1–10%
                                                                                            fouling
       Agent C3                         1–2%                             Alkaline cleaner for cleaning-in-place (CIP)
                                                                  Enzymatic foam cleaner for the prevention and removal
   Enzymatic agent        Two-component (1% + 0.2%), 45 ◦ C        of biofilms from open surfaces. Use between regular
                                                                              cleaning and disinfection steps
      75% ethanol                       100%                         Ethanol/propanol agent for disinfection of surfaces
                                          1 According   to user information sheets.

     The industrial disinfectant agent used was based on peracetic acid and is referred to as «PAA».
When examining normal user concentrations of sanitation agents, PAA was used at the indicated
minimum user concentration, 1.5%, at which the solution contains a minimum of 0.02% peracetic
acid, 0.05% acetic acid, and 0.15% hydrogen peroxide. When testing potential curative treatments
(see Section 2.5.3), PAA was used at 3% concentration as the elevated disinfectant concentration,
as recommended by the manufacturers.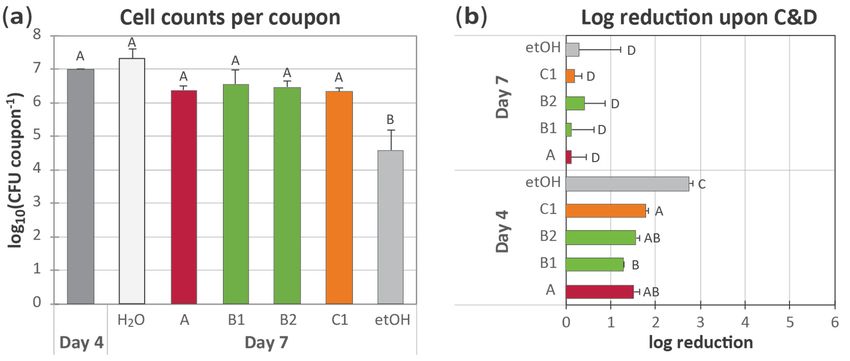
Molecules 2020, 25, 792 4 of 15
2.3. Bactericidal Suspension Tests
Overnight cultures of the seven tested L. monocytogenes strains were mixed in equal numbers,
and the combined suspension was diluted to approximately 108 CFU ml−1 in peptone water. One ml
of the diluted culture was added directly to 9 mL of deionized H2 O (control) or user concentrations of
cleaning agents (Table 1), resulting in a final cell concentration of approximately 107 CFU ml−1 . After
5 min, 0.5 mL of the suspension was transferred to 4.5 mL Dey–Engley (D/E) neutralizing broth (Difco,
New Jersey, USA), and dilutions were plated on BHI agar plates. The tests were performed with all
solutions at 12 ◦ C. The experiment was performed twice.
2.4. Conveyor Belt Biofilm Assay
Biofilms of L. monocytogenes were produced and harvested as described in Fagerlund et al. [14].
In brief: Overnight cultures of the seven L. monocytogenes strains were mixed in equal volumes
and diluted to a final concentration of ~106 CFU ml−1 . Inoculums of 1 mL were used to inoculate
each coupon (1.0 × 1.5 cm) of food-grade PVC conveyor belt material (E8/2 U0/V5 MT white FDA,
Forbo-Siegling Transilon, Baar, Switzerland) placed vertically in 24-well plates, so that the air/liquid
interface crossed the length of the coupon. Biofilms were grown at 12 ◦ C for 4 days before C&D
experiments were commenced. Then, coupons were treated with C&D on days 4, 5, 6, and 7, as
detailed in Section 2.5, and they were incubated in fresh BHI at 12 ◦ C between treatments. The harvest
of coupons was performed before and after coupons were subjected to C&D on the first and/or last
days of C&D treatment (days 4 and 7), as described [14]: After rinsing three times in H2 O to remove
nonadherent bacteria, coupons were vortexed with glass beads and sonicated (40kHz, 10 min, Branson
3510, Bransonic Ultrasonic Corporation, Soest, The Netherlands). Then, dilutions of suspended bacteria
were plated on BHI or RLM agar plates and incubated for 2 to 3 days at 30 ◦ C and 37 ◦ C, respectively.
2.5. C&D Treatment of Biofilms
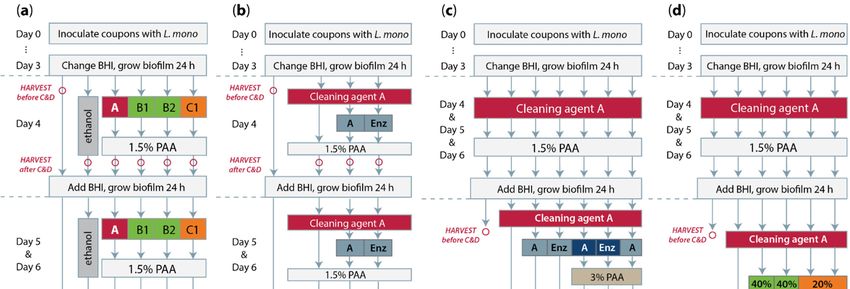
The different C&D treatments employed in the current study are illustrated in Figure 1.Molecules 2020, 25, 792 5 of 15
Molecules 2020, 25, 792 5 of 15
Figure 1. Diagrams
Figure 1. Diagrams illustrating
illustrating thethe
applied cleaning
applied cleaningandanddisinfection
disinfection(C&D)
(C&D)treatments.
treatments. Each arrow
Each represents
arrow represents thethe
step in in
step thetheprotocol
protocol where
where coupons
coupons were
were rinsed
rinsedthree
times in H
three 2O. Red
times in Hcircles
O. Red indicate
circles the steps
indicate where
the steps coupons
where were
coupons harvested
were for
harvestedthe determination
for the of
determination colony
of forming
colony units
forming (CFU)
units coupon
(CFU) coupon −1steps
−1. For
. For involving
steps cleaning
involving
2
agent A, redagent
cleaning boxesA,indicate
red boxes incubation for 10 minfor
indicate incubation at room
10 mintemperature (RT), while
at room temperature blue
(RT), boxes
while blueindicate incubation
boxes indicate for 30 min
incubation for 30with
mincleaning solution
with cleaning pre-heated
solution to 45 °C,
pre-heated
◦
andtoincubation either at (b) RT or (c) 45 °C. For ◦
additional details, see the main text. (a) Standard C&D treatment described in Section 2.5.1
45 C, and incubation either at (b) RT or (c) 45 C. For additional details, see the main text. (a) Standard C&D treatment described in Section 2.5.1 and employed in and employed in the experiment
shown in Figure 2. shown
the experiment (b) C&D in biofilm
Figure 2.treatment
(b) C&D with thetreatment
biofilm enzymatic cleaning
with agent described
the enzymatic cleaninginagent
Section 2.5.2 and
described in Figure
Section3.2.5.2
(c) Reinforced
and Figure treatment with cleaning
3. (c) Reinforced treatment agents,
with see
Section 2.5.3agents,
cleaning and Figure 4a. The2.5.3
see Section cleaning steps shown
and Figure 4a. Theincleaning
light blue andshown
steps dark blue boxes
in light («A»
blue andand
dark«Enz») represent
blue boxes («A»identical
and «Enz») treatments;
representdifferent
identicalcoloring (light/dark
treatments; different blue)
is employed to coordinate
coloring (light/dark blue) with the colorsto
is employed used in Figure
coordinate 4a. the
with (d) colors
C&D with
usedhigher
in Figureconcentrations
4a. (d) C&Dof chemical
with highercleaners, see Section
concentrations 2.5.3 and
of chemical Figuresee
cleaners, 4b. Section 2.5.3 and
Figure 4b.Molecules 2020, 25, 792 6 of 15
2.5.1. Standard C&D Biofilm Treatment
The standard C&D biofilm treatment (Figure 2) was performed as follows: Coupons were rinsed
three times in approximately 10 mL of sterile deionized H2 O (in 15-mL Falcon tubes) to remove
nonadherent bacteria and placed vertically in wells of a clean 24-well tray. Then, a chemical cleaning
agent (either agent A, B1, B2, or C1) was applied to each well in the form of foam (as intended by the
manufacturers; produced in foam pump bottles from Sunvita, Bergen, Norway). The coupons were
incubated in cleaning agent for 10 min before coupons were rinsed as before in H2 O and placed in a
second clean 24-well plate. Then, the wells were filled with 1.5% peracetic acid-based disinfection
agent (PAA) foam, and the coupons were incubated 5 min and finally rinsed in H2 O again. Coupons
treated in parallel with 75% ethanol were processed as follows: These were subjected to the first and
last rinse in H2 O (as above), but they were incubated in ethanol while the coupons processed in the
same experiment were subjected to C&D treatment (10 min in cleaning agent, rinse, 5 min in PAA).
Control coupons were rinsed three times with H2 O every day. The entire experiment was performed
at room temperature (RT) (approximately 20 ◦ C).
2.5.2. C&D Biofilm Treatment with Enzymatic Cleaning Agent
In the experiment where coupons were treated with the enzymatic cleaning agent (Figure 3),
referred to as «Enzymatic agent» (Table 1), the protocol was modified as follows: All coupons were
treated as described above with cleaning agent A and rinsed in H2 O. Then, coupons were either left in
H2 O, treated with either 2% agent A or normal user concentrations of Enzymatic agent, both pre-heated
to 45 ◦ C and applied as foam. Incubation was performed for 30 min at RT before rinsing and treatment
with PAA, as described in Section 2.5.1.
2.5.3. Curative C&D Biofilm Treatment
In experiments to test curative treatments, biofilms were allowed to develop for 4 days, as before,
and then – on days 4, 5, and 6 – coupons were subjected to treatment with 2% agent A for 10 min
followed by 1.5% PAA for 5 min, as described in Section 2.5.1. On day 7, alternative cleaning agent
treatments were tested, followed by treatment with PAA at an increased concentration (3%). In the
reinforced treatment with the Enzymatic agent (Figure 4a), the same conditions as in the Enzymatic
agent assay described above (Section 2.5.2) were used, except that the 30 min incubation step was
performed in a closed container at 45 ◦ C, and PAA was used at a concentration of 3%. Both one round
and five successive rounds of the protocol were performed, as well as one round followed by treatment
with 75% ethanol for the duration of the parallel experiment where coupons were subjected to an
additional four rounds of the protocol.
In treatments with higher concentrations of cleaners (Figure 4b), the following cleaning steps were
compared: Submersion in 40% agent B1 or B2 for 30 min at RT, submersion in 20% agent C3 for 30 min
followed by rinsing in H2 O as before and incubation either in 10% foam of agent C1 or submerged in
10% agent C2. All coupons were finally rinsed and treated with 3% PAA as before.
2.6. Statistical Calculations
Estimates for the mean and variance (standard error of mean of two or three biological experiments)
for each treatment plotted in the figures were calculated from the log10 -transformed values of CFU
per coupon (or reduction in CFU per coupon). The total counts used were averages of technical
replicates, when included. One-way ANOVA and Tukey’s pairwise comparison were used to test
for differences between pairs and groups of treatment means. One-sample t-tests were used to test
whether log10 reductions were significantly different from 0. Statistical tests were performed in Minitab
v18.1 (Minitab Ltd, Coventry, England).Molecules 2020, 25, 792 7 of 15
3. Results and Discussion
3.1. Suspension Tests to Examine Tolerance of Planktonic Cells to the Tested Cleaning Agents
A panel of chemical cleaning agents intended for use in the food industry and recommended by
their manufacturers for use against biofilms of L. monocytogenes were obtained for testing (Table 1).
To examine whether the employed L. monocytogenes strains had a specific tolerance toward the employed
cleaning agents, bactericidal suspension tests were performed on the L. monocytogenes mixture, using
the recommended minimum user concentrations for each product (Table 2). We have previously shown
that the bacterial reductions were 5 log units after the exposure of these L. monocytogenes strains to the
employed concentration of PAA disinfectant (1.5%) for 5 min at 12 ◦ C [14].
The bacterial reductions were >5 log units after exposure to the tested concentrations of the
chlorinated alkaline cleaners (agents A and B2) for 5 min at 12 ◦ C, but they were only between 1 and 2
log units for the strong alkaline cleaner (B1), while the cleaning-in-place (CIP) alkaline cleaner (C3)
gave intermediate results. Since the exact composition of the agents is not known, it is not possible to
explain the differences, but chlorine likely contributes to the high bactericidal effect observed, although
chlorine has less bactericidal activity at high pH [2].
More than 5 log reduction was also obtained for the strong acidic cleaner (C1), but almost no
bactericidal activity was found for the regular acidic cleaner (C2), although the pH was similar for both
products. The enzymatic agent also showed listericidal effects, although the pH was relatively neutral,
and the enzymes used were not expected to show listeridal activity according to the manufacturer’s
information. Again, the exact compositions of the cleaners are not known, so the differences may be
due to additives.
Table 2. Bactericidal suspension test results (cleaning agents).
Product Concentration Bactericidal Suspension Test Results (log reductions)1 pH
Agent A 2% >5.3, >5.4 12.1
Agent B1 2% 1.9, 1.1 12.5
Agent B2 3% >5.3, >5.4 12.7
Agent C1 1% >5.3, >5.4 2.0
Agent C2 1% 0.6, 0.5 1.9
Agent C3 1% 3.8, >5.4 12.2
Enzymatic Agent 1% + 0.2% 3.9, 4.0 7.8
1 Results from both biological replicates are shown. For the control sample without added cleaning agent, 7.3 and
7.4 log CFU ml−1 was obtained.
3.2. Application of Chemical Cleaning Agents to Biofilms at Normal In-Use Concentrations
The efficacy of cleaning agents was tested on biofilms formed from a mixture of seven different
strains of L. monocytogenes on PVC conveyor belt material coupons, as previously described [14].
The efficacy was compared with the conventional chlorinated alkaline cleaning agent (agent A, Table 1),
exposure to a 75% ethanol solution, and with merely rinsing the coupons each day in water. Treatments
with cleaning agents, which were employed at the recommended user concentrations, were followed
by rinsing and treatment with a foaming peracetic acid-based disinfection agent (PAA). In the initial
experiment, the conveyor belt biofilm model was used to compare the use of cleaning agent A with
two additional alkaline cleaning agents—a strong alkaline cleaner (agent B1), a chlorinated alkaline
cleaner (B2)—as well as a strong acidic cleaner (C1) (Table 1). The results are shown in Figure 2.
After the initial 4 days of biofilm development, the cell densities in the L. monocytogenes biofilms
reached approximately 1 × 10⁷ CFU per coupon (3 cm2 surface area) (Figure 2a, bar: day 4). Next,
coupons were subjected to daily cycles of C&D, or daily incubation in 75% ethanol, for three days.
Control coupons were rinsed with sterile H2 O every day. Then, coupons were sampled on day 7 after
allowing 24 h of regrowth after the last treatment cycle (with C&D, ethanol, or H2 O, respectively).
Treatment with ethanol resulted in significantly lower cell density on each coupon compared with
rinsing in H2 O or treatment with C&D using one of the four tested cleaning agents (p ≤ 0.05 for allMolecules 2020, 25, 792 8 of 15
after allowing 24 h of regrowth after the last treatment cycle (with C&D, ethanol, or 8Hof2O,
Molecules 2020, 25, 792 15
respectively). Treatment with ethanol resulted in significantly lower cell density on each coupon
compared with rinsing in H2O or treatment with C&D using one of the four tested cleaning agents (P
relevant
≤ 0.05 fortwo-way comparisons)
all relevant two-way (Figure 2a). Interestingly,
comparisons) (Figure 2a).the differences inthe
Interestingly, biocidal activity
differences in between
biocidal
cleaning agents as shown in the biocidal suspension tests (Table 2) did not seem to matter,
activity between cleaning agents as shown in the biocidal suspension tests (Table 2) did not seem as the effect
to
toward
matter, the L. monocytogenes
as the effect towardbiofilms was not significantly
the L. monocytogenes biofilmslower
was for
notagent B1 than lower
significantly for thefor
other tested
agent B1
agents.
than forProbably,
the otherthe mainagents.
tested effect was biofilmthe
Probably, removal
main and not
effect a killing
was biofilmeffect in biofilms,
removal and notas abiofilms
killing
are generally very resistant to biocidal activity [8]. Overall, no significant differences
effect in biofilms, as biofilms are generally very resistant to biocidal activity [8]. Overall, no were detected
between
significantany of the other
differences conditions
were detectedtested.
betweenThus,
anynone of other
of the the four C&D regimes
conditions tested.tested
Thus,were
noneable to
of the
reduce the total amount of L. monocytogenes biofilm on the conveyor belt materials
four C&D regimes tested were able to reduce the total amount of L. monocytogenes biofilm on the present 24 h after
the last C&D
conveyor belttreatment.
materials present 24 h after the last C&D treatment.
Figure 2.2.Biofilms
Figure Biofilmsof of L. monocytogenes
L. monocytogenes werewere
allowedallowed to develop
to develop undisturbed
undisturbed on conveyor
on conveyor belt couponsbelt
coupons until day 4. Then, coupons were treated each day with either (i) rinsing
until day 4. Then, coupons were treated each day with either (i) rinsing in H2 O, (ii) cleaning with in H 2 O, (ii) cleaning
with cleaning
cleaning agents agents
A (2%),A (2%),
B1 (2%),B1 (2%), B2 (3%),
B2 (3%), or C1or C1 (1%),
(1%), followed
followed by disinfection
by disinfection with with a peracetic
a peracetic acid
acid (PAA)-based
(PAA)-based disinfection
disinfection agent agent (1.5%),
(1.5%), or (iii)
or (iii) incubation
incubation in in 75%ethanol
75% ethanol(etOH).
(etOH).(a)
(a)Total
Total counts
counts
L. monocytogenes in conveyor belt biofilms prior to treatments (Figure 1a; day 4) and after
of L. after three
three
consecutive days of treatments followed by 24 h of regrowth in brain heart infusion infusion (BHI)
(BHI) culture
culture
medium (Figure
medium (Figure1a;1a;
dayday7). 7). (b) Tolerance
(b) Tolerance of biofilms
of biofilms to treatment
to treatment regimes,regimes,
shown asshown
the log as the log
reductions
reductions
in in bacterial
bacterial counts upon C&Dcounts (orupon
ethanol)C&D (or ethanol)
treatment on daystreatment
4 and 7. For on each
daysexperiment,
4 and 7. the For mean
each
experiment,
values of twothe mean values
replicates of two replicates
with standard errors of the with standard
means errors Different
are shown. of the means
lettersare shown.
indicate a
Different letters indicate a statistically different effect of treatments (confidence
statistically different effect of treatments (confidence level 95%); in (b), data for days 4 and 7 werelevel 95%); in (b),
data for days
considered 4 and 7 were
separately in theconsidered separately in the statistical analysis.
statistical analysis.
When the total numbers
numbers of CFU CFU perper coupon
coupon before
before and
and after
after C&D
C&D (or
(or ethanol)
ethanol) treatment
treatment were
were
compared (Figure 2b), the results results showed
showed that that overall,
overall, the treatments
treatments had significantly
significantly lower effect
on day
day 77 compared
compared with with on on day
day 44 (p(PMolecules 2020, 25, 792 9 of 15
environments [32,33]. Further studies are needed to rule out whether the various tolerance effects
Molecules 2020, 25, 792 9 of 15
observed are due to the age of the biofilm, adaptive responses of L. monocytogenes biofilm cells
obtained through exposure to the C&D agents, or a combination of both biofilm age, previous
L. monocytogenes
exposure to the C&Dbiofilm cells obtained
agents, through exposure to the C&D agents, or a combination of both
or other factors.
biofilm age, previous exposure to the C&D agents, or other factors.
3.3. Examining the Efficacy of Enzyme-Based Cleaning for Biofilm Removal
3.3. Examining the Efficacy of Enzyme-Based Cleaning for Biofilm Removal
According to the user instructions, the enzymatic foaming cleaning agent should be applied for
30 min at 45 °C,tobetween
According the usertheinstructions,
regular C&D the step,
enzymatic
to removefoaming cleaning
biofilms. The agent should
efficacy of thisbetreatment
applied for in
30 min at 45 ◦ C, between the regular C&D step, to remove biofilms. The efficacy of this treatment
the L. monocytogenes conveyor belt biofilm model was tested and compared with two treatment
in the L. monocytogenes
protocols employing C&D conveyor belt using
treatment biofilm model
only the was tested and
conventional compared
cleaning agentwith two treatment
A (Table 1): In all
protocols employing C&D treatment using only the conventional cleaning
three protocols, coupons with biofilm were rinsed and cleaned with room-temperature solution agent A (Table 1): In all
of
three
agentprotocols,
A as before coupons withatbiofilm
(for 10 min were rinsed
RT), followed and cleaned
by rinsing with in
three times room-temperature
H2O. Then, one coupon solutionwas of
agent A as before
left standing in the(for 10rinse
last min water,
at RT), while
followed the by rinsing
other three times
two coupons werein H 2 O. Then,
subjected toone coupon
a second stepwasof
left standing in the last rinse water, while the other two coupons were
cleaning (30 min): one coupon was treated with the Enzymatic agent, while the other was treated subjected to a second step of
cleaning
with agent (30 min):
A; both onewere
coupon was treated
pre-heated with
to 45 °C.the Enzymatic
After rinsing,agent, whilecoupons
all three the otherwere
was subjected
treated with to
agent A; both were pre-heated to 45 ◦ C. After rinsing, all three coupons were subjected to disinfection
disinfection with PAA as described above. Although the optimum temperature for the Enzymatic
with
agentPAAis 45as°C,
described above.
in practice, the Although
foam-based thecleaning
optimum of temperature
food industrial for surfaces
the Enzymatic agent is 45at◦ 45
and equipment C,
in ◦
°Cpractice,
is likelythebothfoam-based
difficult (ascleaning of food may
the materials industrial
keep surfaces and equipment
a temperature of 4–12 °C at and
45 Ccoolis likely
downboththe
difficult (as the materials may keep a temperature of 4–12 ◦ C and cool down the foam) and something
foam) and something one would want to avoid (increasing temperatures may enhance microbial
one wouldTherefore,
growth). want to avoidwhile(increasing
the cleaning temperatures
agents had may enhance microbial
a temperature of 45 °C growth).
at the timeTherefore, while
of application,
the cleaning agents had a temperature of 45 ◦ C at the time of application, the 30 min exposure time
the 30 min exposure time was performed at room temperature (~20 °C). As before, the C&D
was performed ◦ C). As before, the C&D procedure was performed daily for
procedure was at room temperature
performed (~20days
daily for four starting with four-day-old biofilms of L. monocytogenes,
four
and days starting
sampling waswith four-day-old
performed on thebiofilms L. monocytogenes,
first andoflast and sampling
days of C&D treatment (dayswas performed
4 and on the
7). The results
first and last days
are shown in Figure 3. of C&D treatment (days 4 and 7). The results are shown in Figure 3.
Figure
Figure 3.3. The
The four-day-old
four-day-old biofilms
biofilms were
were subjected
subjected to
to C&D
C&D treatments
treatments on on days
days 4,4, 5,
5, 6,
6, and
and they
they were
were
allowed
allowed 24 h of regrowth before sampling. The C&D treatments were either (i) 2% Agent A10for
24 h of regrowth before sampling. The C&D treatments were either (i) 2% Agent A for min
10
only (A); (ii) 2% Agent A for 10 min followed by 2% Agent A at 45 ◦ C for 30 min at RT (A→A); or (iii)
min only (A); (ii) 2% Agent A for 10 min followed by 2% Agent A at 45 °C for 30 min at RT (A→A); or
2%
(iii)Agent A for A
2% Agent 10for
min10followed by an Enzymatic
min followed Agent pre-heated
by an Enzymatic to 45 ◦ C, to
Agent pre-heated for45
30°C,
minfor at 30
RT min
(A→Enz).
at RT
After
(A→Enz). After these treatments, all coupons were disinfected with 1.5% PAA. (a) Counts of in
these treatments, all coupons were disinfected with 1.5% PAA. (a) Counts of L. monocytogenes L.
conveyor belt biofilms
monocytogenes priorbelt
in conveyor to C&D at day
biofilms 4 and
prior day 7.at(b)
to C&D dayTolerance
4 and day of 7.
biofilms to treatment
(b) Tolerance regimes.
of biofilms to
Results
treatmentare regimes.
based onResults
three replicates;
are baseddetails are otherwise
on three replicates;asdetails
described in the legend
are otherwise to Figure 2.in the
as described
legend to Figure 2.
All three C&D treatments resulted in significantly lower cell densities on coupons sampled after
allowing 24 h of regrowth after the three consecutive C&D cycles on days 4, 5 and 6, compared
All three C&D treatments resulted in significantly lower cell densities on coupons sampled
with coupons that were only rinsed with sterile deionized H2 O each day (Figure 3a). However,
after allowing 24 h of regrowth after the three consecutive C&D cycles on days 4, 5 and 6, compared
no statistically significant difference could be detected between the conventional C&D treatment and
with coupons that were only rinsed with sterile deionized H2O each day (Figure 3a). However, no
C&D treatments performed with an extra cleaning step employing either enzymatic or conventional
statistically significant difference could be detected between the conventional C&D treatment and
cleaner (Figure 3a).
When examining the log reductions obtained by comparing the total numbers of CFU per coupon
before and after C&D treatment, we obtained a similar result as in the experiment shown in Figure 2b:Molecules 2020, 25, 792 10 of 15
All C&D treatments had a significantly lower effect on day 7 compared to the effect on biofilms treated
on day 4 of the experiment (p = 0.003) (Figure 3b). In addition, as before, on day 7, none of the C&D
treatments were able to significantly reduce the amount of L. monocytogenes biofilm present on the
conveyor belt coupons (p ≥ 0.23).
Furthermore, there was no significant difference between treatments observed in this experiment
(p = 0.4 for day 4 and p = 0.9 for day 7). Thus, under these conditions, the enzymatic cleaner
containing enzymes targeting polymeric substances (EPS) of the extracellular matrix, and the
conventional chlorinated alkaline cleaning agent, which acts through the unspecific degradation,
wetting, and solubilization of organic matters, reduced biofilm by approximately one log10 . To our
knowledge, the effect of commercial enzymatic agents on L. monocytogenes biofilms has not been
reported before. However, the results were in the same range as in two previous studies on biofilm
removal using enzymes, resulting in a modest reduction of 1–2 log10 reduction [22,34]. As stated in
Section 3.2, the literature shows highly variable results for the effect of commercial alkaline cleaners on
L. monocytogenes biofilms. In conclusion, disregarding the type of cleaning agent, including one extra
cleaning step did not result in enhanced removal of the L. monocytogenes biofilm, and it appears not to
be a solution for biofilm removal.
3.4. Curative C&D Treatments with Extreme Use of Cleaners
The results obtained above (Figure 2; Figure 3) showed that none of the tested C&D regimes were
able to significantly reduce the level of bacteria in conveyor belt biofilms subjected to C&D on the three
previous days. It is easy to envision similar situations in a food processing facility in which a biofilm
has been established and subsequently, perhaps in the face of contamination problems, is subjected
to daily C&D without obtaining the desired effect. The manufacturers of the cleaning agents were
asked what action they would recommend in such a scenario. Suggestions included the application of
repeated cleaning cycles and the use of increased concentrations of the chemical cleaning agents, as
well as the use of more than one type of cleaning agent in succession. These suggestions were tested in
the current study.
Furthermore, one of the manufacturers stressed that all parts should be allowed to completely
dry between each C&D step and that heated water (35–55 ◦ C) should be used for the rinsing steps
performed before the application of each cleaning agent. All manufacturers additionally suggested the
inclusion of a mechanical brushing step. These approaches were not tested in the current study.
3.4.1. Biofilm Treatment with Reinforced C&D and Repeated C&D Cycles
Although the addition of one extra cleaning step did not seem to significantly increase the removal
of L. monocytogenes biofilms in our tests (Figure 3), the manufacturer of the enzymatic cleaning agent
recommended repeated cleaning cycles for the elimination of L. monocytogenes biofilms. Furthermore,
they recommended using 45 ◦ C throughout the exposure time for the Enzymatic agent and doubling
the concentration of the disinfectant. This approach was tested for one conventional cleaning agent
and the Enzymatic cleaning agent, using the following conditions (see Section 2.5.3 and Figure 1c):
Biofilm formation was initialized for 4 days as before, followed by treatment of all coupons with the
same standard C&D regime on days 4, 5, and 6. This treatment consisted of cleaning with a standard
chlorinated alkaline cleaning agent (agent A) followed by PAA disinfectant at 1.5% as previously
described. Then, on day 7, coupons were subjected to different C&D protocols, as described in
Section 2.5.3 and Figure 1c: (i) A protocol with a standard cleaning step (agent A, 10 min at RT) followed
by 3% PAA. (ii) A protocol with the standard cleaning step, followed by reinforced cleaning with
either an Enzymatic agent or conventional cleaner (agent A) (30 min with 45 ◦ C during incubation),
and finally 3% PAA. (iii) A protocol where the entire C&D cycle [described in ii)] was performed five
times in succession. (iv) A protocol where the two-step cleaning cycle with agent A in both steps was
followed by the submersion of coupons in 75% ethanol (total time for ethanol exposure approximately
3 hours). The results are shown in Figure 4a.Molecules 2020, 25, 792 11 of 15
Molecules 2020, 25, 792 11 of 15
cleaning cycle with agent A in both steps was followed by the submersion of coupons in 75% ethanol
(total time for ethanol exposure approximately 3 hours). The results are shown in Figure 4a.
In this experiment, the highest efficacy was observed for the treatment of coupons that were
In this experiment, the highest efficacy was observed for the treatment of coupons that were
subjected to two cleaning steps (one for 10 min at RT and one for 30 min at 45 ◦ C) followed by incubation
subjected to two cleaning steps (one for 10 min at RT and one for 30 min at 45 °C) followed by
in 75% ethanol (Figure 4a; gray bar). Under these conditions, no bacteria were detected on 50% of
incubation in 75% ethanol (Figure 4a; gray bar). Under these conditions, no bacteria were detected
the individual tested coupons, and this treatment thus gave about 5 log reduction. In comparison,
on 50% of the individual tested coupons, and this treatment thus gave about 5 log reduction. In
when a shorter ethanol treatment step was applied without prior cleaning steps and subsequent PAA
comparison, when a shorter ethanol treatment step was applied without prior cleaning steps and
treatment, 3 log reduction was obtained (Figure 2b; gray bar).
subsequent PAA treatment, 3 log reduction was obtained (Figure 2b; gray bar).
The treatment employing five successive rounds of the reinforced C&D procedure using the
The treatment employing five successive rounds of the reinforced C&D procedure using the
standard alkaline cleaning agent A in both cleaning steps gave the second largest reduction. This was
standard alkaline cleaning agent A in both cleaning steps gave the second largest reduction. This
the only treatment (beside ethanol) that was significantly different from using regular one-step cleaning
was the only treatment (beside ethanol) that was significantly different from using regular one-step
with an alkaline foam and gave above 4 log reduction in CFU on coupons (Figure 4a; 5 × [A→A]).
cleaning with an alkaline foam and gave above 4 log reduction in CFU on coupons (Figure 4a; 5 ×
In this test, one of six replicates gave a result below the detection limit.
[A→ A]). In this test, one of six replicates gave a result below the detection limit.
Figure 4. Tolerance of biofilms with reinforced cleaning protocols. Biofilms were allowed to develop for
Figure 4. Tolerance of biofilms with reinforced cleaning protocols. Biofilms were allowed to develop
4 days, and coupons were then cleaned with agent A followed by disinfection with 1.5% PAA for three
for 4 days, and coupons were then cleaned with agent A followed by disinfection with 1.5% PAA for
consecutive days. On day 7, coupons were subjected to different treatment protocols, and the amount
three consecutive days. On day 7, coupons were subjected to different treatment protocols, and the
of L. monocytogenes remaining on coupons after treatment was compared with the number of bacteria
amount of L. monocytogenes remaining on coupons after treatment was compared with the number of
present on the day 7 coupons that were subjected only to rinsing in H2 O. For details on protocols, see the
bacteria present on the day 7 coupons that were subjected only to rinsing in H2O. For details on
main text and Figure 1c,d. (a) Bacterial reductions obtained after biofilm treatment with reinforced
protocols, see the main text and Figures 1c,d. (a) Bacterial reductions obtained after biofilm treatment
cleaning and repeated C&D steps (b) Bacterial reductions obtained after biofilm treatment with high
with reinforced cleaning and repeated C&D steps (b) Bacterial reductions obtained after biofilm
dosages of chemical cleaning agents. Experiments in (a) and (b) were performed at the same time,
treatment with high dosages of chemical cleaning agents. Experiments in (a) and (b) were performed
and the results for the control treatment using standard C&D treatment with cleaning agent A (column
at the same time, and the results for the control treatment using standard C&D treatment with
A, in red) is shown in both figures. The average CFU per coupon for coupons rinsed in H2 O only
cleaning agent A (column A, in red) is shown in both figures. The average CFU per coupon for
was 1.8 × 10⁷ CFU coupon−1 , and the detection limit was 5.6 log reductions. Results are based on
coupons
(a) rinsed
three and (b) in
two O only was
H2biological 1.8 × 10each
replicates,
7 CFU coupon−1, and the detection limit was 5.6 log
with parallel coupons. Mean values and standard
reductions.
errors of the Results
means are areshown,
basedwith
on (a) three letters
different and (b) two biological
indicating replicates,
statistically different each
effect with parallel
of treatments
coupons. Mean
(confidence levelvalues
95%);and standard
except in (b), errors
whereof the meanswith
treatments are agents
shown,B1 with
anddifferent letters
B2 reached theindicating
detection
statistically different effect of treatments (confidence
limit, and therefore, significance was not calculated. level 95%); except in (b), where treatments with
agents B1 and B2 reached the detection limit, and therefore, significance was not calculated.
These two treatments were significantly more effective than the control C&D procedure using
only These two treatments
one standard cleaningwere
step significantly
(Figure 4a; red more
bar).effective than the rounds
Five successive control of
C&Dthe procedure
reinforced using
C&D
only one standard
procedure using thecleaning step (Figure
enzyme-based cleaner4a;in red
the bar).
second Five successive
cleaning stepsrounds
(Figure of
4a;the
5 ×reinforced
[A→Enz])C&D gave
procedure using the enzyme-based cleaner in the second cleaning steps (Figure 4a;
a larger average log reduction than the standard control C&D treatment (Figure 4a; red bar); however, 5 × [A→ Enz])
gave a larger in
the variation average log reduction
performance thanand
was high, thethe
standard
differencecontrol
was C&D treatment (Figure
not significantly different4a;(pred bar);
= 0.12).
however, the variation in performance was high, and the difference was not significantly
Since the cleaning efficacy of alkaline increases with temperature [2], it is tempting to speculate that different (P
=the0.12). Since the cleaning efficacy of alkaline increases with temperature [2], it
increased effect of several repeating exposures to cleaning agent A is merely a result of higher is tempting to
speculate
temperature that the
and increased
a longer effecttime
exposure of several repeating
to alkaline. For the exposures to cleaning
combination agent A
with enzymes, theisincrease
merely in
a
result of higher temperature and a longer exposure time to alkaline. For the combination
exposure time and temperature was not enough to result in a significantly increased biofilm removal. withMolecules 2020, 25, 792 12 of 15
3.4.2. Biofilm Treatment with High Dosages of Chemical Cleaning Agents
The use of highly increased concentrations of chemical cleaning products, along with the soaking
of dismantled equipment parts in these solutions for extended periods of time, was suggested by the
manufacturers as an approach to eliminate L. monocytogenes biofilms. Another advice was to use more
than one type of cleaning agent. We selected to test the application of increased concentrations and
incubation times of cleaning agents in an attempt to achieve a more efficient removal of biofilm in our
model. For an overview of the tested protocols, see Section 2.5.3 and Figure 1d.
For testing the alkaline foaming agents B1 and B2, coupons were submerged for 30 min in 40%
solution of each cleaning agent. This concentration is 5–7 times higher than the highest indicated user
concentrations when the products are employed in regular cleaning. According to the manufacturer,
this strategy had not been tested in situ before, as the cleaners were relatively new. In line with the
results from an early study on L. monocytogenes biofilm eradication [35], the manufacturer of C1, C2,
and C3 had experienced a good effect of increased temperatures, concentrations, and the sequential
use of alkali and acid cleaners in problem solving. An initial 30 min soaking step with a 20% solution
of an alkaline clean-in-place (CIP) detergent cleaner, agent C3, was used prior to treatment with the
acidic cleaner (Table 1). Thus, agent C3 was used at 10 times the normal user concentration for this
product. Then, following rinsing, we tested both the cleaning agent C1, applied as foam, and a different
non-foaming product intended for CIP cleaning: agent C2 (Table 1). Agents C1 and C2 were used at
10% concentration, which is the highest recommended user concentration, and it was allowed to act for
40 min before rinsing. To be able to compare results across experiments, the conditions were otherwise
as described above: Biofilms were developed for four days and then subjected to a standard C&D
procedure using agent A and 1.5% PAA on days 4 to 6. After completion of the indicated cleaning
steps on day 7, coupons were disinfected with 3% PAA. The results are shown in Figure 4b.
The use of higher cleaning agent concentrations, combinations, and extended exposure times
(soaking) of the biofilms to the cleaning agents followed by 3% PAA disinfection showed significant
(p < 0.003) effects and increased the listericidal effects by between 2 and 4 log reductions compared
to the control C&D with 2% agent A and 3% PAA (Figure 4b). The experiment was performed at
RT and not at 35–55 ◦ C as the manufacturer recommended, and one would expect an even larger
reduction with higher temperature. Arizcun et al. [35] found that the reduction of L. monocytogenes
biofilm increased by more than 4 logs by increasing the temperature from 20 to 55 ◦ C in a sequential
cleaning experiment with alkaline and acetic acid. For the treatment of coupons with 40% solutions
of cleaning agents, no bacteria were detected on the tested coupons after C&D treatment, both with
the strong alkaline foam gel (B1) and the chlorinated alkaline foam B2 (Figure 4b; green bars) (the
detection limit was a log reduction of 5.6).
3.5. Overall Comparison of Cleaning Approaches
In the present study, model L. monocytogenes biofilms were allowed to develop on a conveyor belt
material with a woven underside, which is a well-known niche where L. monocytogenes may persist and
survive C&D in industrial settings. The obtained results supported the experiences from the industry,
as the recommended C&D protocols with conventional and enzymatic cleaning agents showed limited
effects against L. monocytogenes in biofilms. In addition, repeating the C&D cycle had limited effect,
and it can not be regarded as cost effective in a practical situation.
The manufacturers of the C&D agents stressed that mechanical action is needed to remove
biofilms, but we chose to not include any significant form of mechanical cleaning and shear forces in
the model system. It is likely that higher bacterial reductions would have been observed if scrubbing or
rinsing with high-pressure sprays had been applied. However, considering that biofilm formation and
bacterial persistence primarily occur on sites and niches in food processing equipment and surfaces
where brushing or mechanical forces are not effective due to limited availability or poor hygienic
design issues, the model system applied seems relevant. Another factor is the likely higher diversity,
complexity, and variations in microbial biofilm structure existing in the food processing environmentsMolecules 2020, 25, 792 13 of 15
relative to those reflected in the present study. Here, monospecies biofilms of L. monocytogenes formed
on a single substrate under defined conditions were used. Biofilms produced by L. monocytogenes
are complex structures and consist of both polysaccharides, teichoic acid, proteins, and extracellular
DNA (eDNA), which is something that may explain why they may be more difficult to eradicate than
common food soils or biofilms formed by other bacteria [3,10,14].
High concentrations and extended exposure times of the cleaning and/or disinfection agents were
needed to eradicate L. monocytogenes biofilms from the conveyor belt in the absence of mechanical action.
These conditions were extreme compared to normal in-use conditions, and issues such as an increased
use of time, costs for chemicals, health issues, and the sensitivity of equipment and machines to high
concentrations of chemicals must be considered before implementing such procedures. An effective
alternative to excessive cleaning was using an alcohol disinfectant after a thorough cleaning with
a caustic cleaning agent. This approach can be considered as an alternative curative treatment of
L. monocytogenes house strains.
In addition to the effect on biofilms and removing soil, environmental and health effects also must
be taken into consideration when choosing cleaning agents. The exact composition of the commercial
agents was not known, and an investigation of the safety of the products is beyond the scope of this
paper. However, according to the information provided by the manufacturers in the product safety
data sheets, all cleaning agents tested, except for the enzymatic (which were classified as irritating
to skin) contained chemicals that cause serious skin and eye damage. The enzymatic agent could
cause asthma symptoms. All alkaline cleaning agents were classified as very toxic to aquatic life with
long-lasting effects, which was due to their content of alkali, hypochlorite, and/or alkyl amino oxides,
while the acidic agents were classified as chemicals with no environmental impact. The enzymatic
agent contained an enzyme that was acutely toxic to aquatic organisms. Although the acid and alkaline
cleaners in this study showed a similar degree of effect on biofilms, and the latter is more toxic to the
environment, one cannot deduce that the food industry should move from alkaline to acidic cleaners in
general. For many food processes, the removal of fat or starch is important, and then alkaline cleaners
are more effective [3].
4. Conclusions
The study supported experiences from the industry showing that Listeria monocytogenes biofilms
formed on conveyor belt materials are difficult to remove through regular cleaning and disinfection.
Both increasing concentrations and combining acidic and alkaline cleaning agents seemed promising
for the removal of L. monocytogenes biofilms in niches that are difficult to reach for mechanical
action. In addition, applying an alcohol disinfectant after thorough cleaning was efficient for
eliminating biofilms.
Author Contributions: Formal analysis; investigation; visualization: A.F.; project administration; supervision;
validation: A.F. and S.L.; writing—original draft preparation: A.F., E.H., and S.L.; conceptualization; methodology;
writing—review and editing: A.F., E.H., T.M., and S.L. All authors have read and agreed to the published version
of the manuscript.
Funding: This work was supported by Norwegian Research Funding for Agriculture and Food Industry, grant
numbers 221663 and 262306. The APC was funded by Nofima.
Acknowledgments: The authors thank Tove Maugesten and Charlotte Nilsen for their excellent technical assistance.
Conflicts of Interest: The authors declare no conflict of interest.
References
1. Gibson, H.; Taylor, J.H.; Hall, K.E.; Holah, J.T. Effectiveness of cleaning techniques used in the food industry
in terms of removal of bacterial biofilms. J. Appl. Microbiol. 1999, 87, 41–48. [CrossRef]
2. Fukuzaki, S. Mechanisms of actions of sodium hypochlorite in cleaning and disinfection processes. Biocontrol.
Sci. 2006, 11, 147–157. [CrossRef] [PubMed]
3. Stanga, M. Sanitation: Cleaning and disinfection in the food industry; Wiley-VCH: Weinheim, Germany, 2010.Molecules 2020, 25, 792 14 of 15
4. Urano, H.; Fukuzaki, S. The mode of action of hypochlorite in the cleaning process. Biocontrol. Sci. 2005, 10,
21–29. [CrossRef]
5. Møretrø, T.; Langsrud, S. Residential bacteria on surfaces in the food industry and their implications for food
safety and quality. Compr. Rev. Food Sci. Food Saf. 2017, 16, 1022–1041. [CrossRef]
6. Carpentier, B.; Cerf, O. Review—Persistence of Listeria monocytogenes in food industry equipment and
premises. Int. J. Food Microbiol. 2011, 145, 1–8. [CrossRef] [PubMed]
7. Ferreira, V.; Wiedmann, M.; Teixeira, P.; Stasiewicz, M.J. Listeria monocytogenes persistence in food-associated
environments: Epidemiology, strain characteristics, and implications for public health. J. Food Prot. 2014, 77,
150–170. [CrossRef]
8. Larsen, M.H.; Dalmasso, M.; Ingmer, H.; Langsrud, S.; Malakauskas, M.; Mader, A.; Møretrø, T.; Mozina, S.S.;
Rychli, K.; Wagner, M.; et al. Persistence of foodborne pathogens and their control in primary and secondary
food production chains. Food Control 2014, 44, 92–109. [CrossRef]
9. Tompkin, R.B. Control of Listeria monocytogenes in the food-processing environment. J. Food Prot. 2002, 65,
709–725. [CrossRef]
10. Colagiorgi, A.; Bruini, I.; Di Ciccio, P.A.; Zanardi, E.; Ghidini, S.; Ianieri, A. Listeria monocytogenes biofilms in
the wonderland of food industry. Pathogens 2017, 6, 41. [CrossRef]
11. Lappi, V.R.; Thimothe, J.; Nightingale, K.K.; Gall, K.; Scott, V.N.; Wiedmann, M. Longitudinal studies on
Listeria in smoked fish plants: Impact of intervention strategies on contamination patterns. J. Food Prot. 2004,
67, 2500–2514. [CrossRef]
12. Codex Alimentarius Commission. Guidelines on the application of general principles of food hygiene to the
control of Listeria monocytogenes in foods. CAC/GL 61. 2007. Available online: http://www.fao.org/input/
download/standards/10740/CXG_061e.pdf (accessed on 12 February 2020).
13. U.S. Department of Agriculture, Food Safety and Inspection Service. FSIS Compliance Guideline: Controlling
Listeria monocytogenes in Post-Lethality Exposed Ready-to-Eat Meat and Poultry Products. 2014. Available
online: https://www.fsis.usda.gov/wps/wcm/connect/d3373299-50e6-47d6-a577-e74a1e549fde/Controlling-
Lm-RTE-Guideline.pdf?MOD=AJPERES (accessed on 12 February 2020).
14. Fagerlund, A.; Møretrø, T.; Heir, E.; Briandet, R.; Langsrud, S. Cleaning and disinfection of biofilms composed
of Listeria monocytogenes and background microbiota from meat processing surfaces. Appl. Environ. Microbiol.
2017, 83, 01046-17. [CrossRef] [PubMed]
15. Chaturongkasumrit, Y.; Takahashi, H.; Keeratipibul, S.; Kuda, T.; Kimura, B. The effect of polyesterurethane
belt surface roughness on Listeria monocytogenes biofilm formation and its cleaning efficiency. Food Control
2011, 22, 1893–1899. [CrossRef]
16. Goode, K.R.; Asteriadou, K.; Robbins, P.T.; Fryer, P.J. Fouling and cleaning studies in the food and beverage
industry classified by cleaning type. Compr. Rev. Food Sci. Food Saf. 2013, 12, 121–143. [CrossRef]
17. Bredholt, S.; Maukonen, J.; Kujanpaa, K.; Alanko, T.; Olofson, U.; Husmark, U.; Sjøberg, A.; Wirtanen, G.
Microbial methods for assessment of cleaning and disinfection of food-processing surfaces cleaned in
low-pressure system. Eur. Food Res. Technol. 1999, 209, 145–152. [CrossRef]
18. Leriche, V.; Briandet, R.; Carpentier, B. Ecology of mixed biofilms subjected daily to a chlorinated alkaline
solution: Spatial distribution of bacterial species suggests a protective effect of one species to another. Environ.
Microbiol. 2003, 5, 64–71. [CrossRef]
19. Wirtanen, G.; Husmark, U.; Mattila-Sandholm, T. Microbial evaluation of the biotransfer potential from
surfaces with Bacillus biofilms after rinsing and cleaning procedures in closed food-processing systems.
J. Food Prot. 1996, 59, 727–733. [CrossRef]
20. Simões, M.; Pereira, M.O.; Vieira, M.J. Effect of mechanical stress on biofilms challenged by different chemicals.
Water Res. 2005, 39, 5142–5152. [CrossRef]
21. Reynisson, E.; Guðbjörnsdóttir, B.; Marteinsson, V.P.; Hreggviðsson, G.O. Decontamination efficiency of fish
bacterial flora from processing surfaces. Food Technol. Biotechnol. 2009, 47, 75–82.
22. Puga, C.H.; Rodríguez-López, P.; Cabo, M.L.; SanJose, C.; Orgaz, B. Enzymatic dispersal of dual-species
biofilms carrying Listeria monocytogenes and other associated food industry bacteria. Food Control 2018, 94,
222–228. [CrossRef]
23. Meireles, A.; Borges, A.; Giaouris, E.; Simões, M. The current knowledge on the application of anti-biofilm
enzymes in the food industry. Food Res. Int. 2016, 86, 140–146. [CrossRef]You can also read