Livestock country reviews 11 - POULTRY SECTOR Ethiopia - FAO
←
→
Page content transcription
If your browser does not render page correctly, please read the page content below
11
                       FAO ANIMAL PRODUCTION AND HEALTH

livestock country reviews

     POULTRY SECTOR
            Ethiopia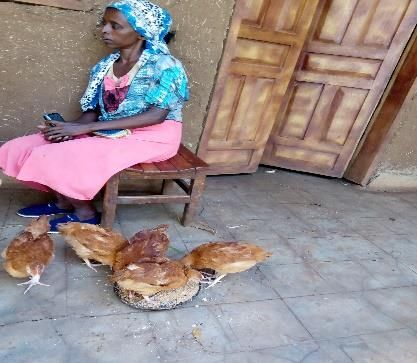
11

                                                                 FAO ANIMAL PRODUCTION AND HEALTH

                                       livestock country reviews

                   POULTRY SECTOR
                                          Ethiopia

                                                    Author
                                              Nigussie Dana
                                             Director General
                      Southern Agricultural Research Institute
                                           Hawassa, Ethiopia

                                                  Editors
                                          Giacomo de’ Besi
                                              Anne Mottet
                                             John Maguire
Food and Agriculture Organization of the United Nations (FAO)

                                FOOD AND AGRICULTURE ORGANIZATION OF THE UNITED NATIONS
                                                                              Rome, 2019
Required citation: FAO. 2019. Poultry Sector Ethiopia. FAO Animal Production and Health Livestock Country Reviews. No. 11. Rome. The designations employed and the presentation of material in this information product do not imply the expression of any opinion whatsoever on the part of the Food and Agriculture Organization of the United Nations (FAO) concerning the legal or development status of any country, territory, city or area or of its authorities, or concerning the delimitation of its frontiers or boundaries. The mention of specific companies or products of manufacturers, whether or not these have been patented, does not imply that these have been endorsed or recommended by FAO in preference to others of a similar nature that are not mentioned. The views expressed in this information product are those of the author(s) and do not necessarily reflect the views or policies of FAO. ISBN 978-92-5-131339-8 © FAO, 2019 Some rights reserved. This work is made available under the Creative Commons Attribution-NonCommercial-ShareAlike 3.0 IGO licence (CC BY-NC-SA 3.0 IGO; https://creativecommons.org/licenses/by-nc-sa/3.0/igo/legalcode/legalcode). Under the terms of this licence, this work may be copied, redistributed and adapted for non-commercial purposes, provided that the work is appropriately cited. In any use of this work, there should be no suggestion that FAO endorses any specific organization, products or services. The use of the FAO logo is not permitted. If the work is adapted, then it must be licensed under the same or equivalent Creative Commons licence. If a translation of this work is created, it must include the following disclaimer along with the required citation: “This translation was not created by the Food and Agriculture Organization of the United Nations (FAO). FAO is not responsible for the content or accuracy of this translation. The original [Language] edition shall be the authoritative edition.” Disputes arising under the licence that cannot be settled amicably will be resolved by mediation and arbitration as described in Article 8 of the licence except as otherwise provided herein. The applicable mediation rules will be the mediation rules of the World Intellectual Property Organization http://www.wipo.int/amc/en/mediation/rules and any arbitration will be conducted in accordance with the Arbitration Rules of the United Nations Commission on International Trade Law (UNCITRAL). Third-party materials. Users wishing to reuse material from this work that is attributed to a third party, such as tables, figures or images, are responsible for determining whether permission is needed for that reuse and for obtaining permission from the copyright holder. The risk of claims resulting from infringement of any third-party-owned component in the work rests solely with the user. Sales, rights and licensing. FAO information products are available on the FAO website (www.fao.org/publications) and can be purchased through publications-sales@fao.org. Requests for commercial use should be submitted via: www.fao.org/contact-us/licence-request. Queries regarding rights and licensing should be submitted to: copyright@fao.org.
Contents
Foreword ................................................................................................................................... vi
Acknowledgements ...................................................................................................................vii
Acronyms and abbreviations ....................................................................................................viii
Executive summary.....................................................................................................................ix
1.     Introduction........................................................................................................................ 1
     1.1.    Country profile............................................................................................................. 1
     1.2.    Agricultural sector ....................................................................................................... 2
2.     Current status of poultry production and supply chains ................................................... 5
     2.1.    The poultry flock .......................................................................................................... 5
       2.1.1.       Geographical distribution of poultry flocks ......................................................... 6
       2.1.2.       Breeds ................................................................................................................... 6
     2.2.    Poultry production systems ......................................................................................... 8
       2.2.1.       Poultry production systems and their distribution .............................................. 8
       2.2.2.       Industrial and integrated/medium- and large-scale intensive systems ............ 10
       2.2.3.       Family poultry production systems .................................................................... 14
       2.2.4.       Feed resources ................................................................................................... 17
       2.2.5.       Poultry and public health ................................................................................... 20
       2.2.6.       Environment ....................................................................................................... 22
     2.3.    Poultry value chain analysis....................................................................................... 22
       2.3.1.       Chicken meat ...................................................................................................... 23
       2.3.2.       Table eggs ........................................................................................................... 24
3.     Poultry and egg markets and regulations ........................................................................ 26
     3.1.    Poultry supply and demand ....................................................................................... 26
       3.1.1.       Production .......................................................................................................... 26
       3.1.2.       Consumption ...................................................................................................... 27
       3.1.3.       Prices .................................................................................................................. 28
     3.2.    Trade, marketing and markets .................................................................................. 29
       3.2.1.       Domestic market ................................................................................................ 29
       3.2.2.       Trade................................................................................................................... 30
     3.3.    Current governance, policies, and legal framework ................................................. 31
       3.3.1.       Policies ................................................................................................................ 31
       3.3.2.       Producer organizations ...................................................................................... 32
                                                                                                                                             iii
4. Sustainable development of the poultry sector: Status and prospects........................... 33
4.1. Current economic, social and environmental strengths and weaknesses
of the poultry sector .................................................................................................. 33
4.1.1. Strengths and weaknesses in production, inputs, etc. ...................................... 33
4.1.2. Strengths and weaknesses in marketing and trade ........................................... 34
4.2. Poultry development ................................................................................................. 35
4.2.1. Past poultry development strategies ................................................................. 35
4.2.2. Major ongoing and recently closed projects...................................................... 36
4.3. Prospects of the poultry sector – opportunities and challenges .............................. 38
4.3.1. Prospects of the poultry sector .......................................................................... 38
4.3.2. Opportunities and challenges of the poultry sector .......................................... 40
4.3.3. The way forward ................................................................................................ 41
5. Appendix........................................................................................................................... 44
Appendix 1. Classification of poultry production systems ................................................... 44
Appendix 2. Key sector stakeholders ................................................................................... 45
6. Bibliography...................................................................................................................... 47
ivTables
TABLE 1. Geographic location, land area, population and economy ................................................ 1
TABLE 2. Agricultural land (as percent of total land area) and contribution of agriculture
to national GDP and employment...................................................................................... 2
TABLE 3. Distribution of poultry, 2016.............................................................................................. 6
TABLE 4. Some of the major hatcheries in Ethiopia, 2015.............................................................. 11
TABLE 5. Number of chicken holders by size of chicken holding, 2017 .......................................... 15
TABLE 6. Estimated number (thousands) of poultry by type and breed classification in
Ethiopia, 2017 .................................................................................................................. 16
TABLE 7. Production capacities of some of the major feed mills ................................................... 18
TABLE 8. Quantity of major compound feeds produced (tonnes/year) by private feed
processing plants and farmers' unions from September 2015 to August 2016 .............. 19
TABLE 9. Number of chickens afflicted, treated and died of disease and other causes in
different parts of Ethiopia, 2016 ...................................................................................... 21
TABLE 10. Number of private and public formal animal health service centres in 40
sample weredas/districts ................................................................................................. 22
TABLE 11. Annual poultry meat production in Ethiopia as percentage share of African and
global production, 2016 ................................................................................................... 26
TABLE 12. Annual poultry egg production in Ethiopia as percentage share of African and
global production, 2016 ................................................................................................... 26
Figures
FIGURE 1. Gross national income (GNI) per capita, Atlas method (current USD) .............................. 1
FIGURE 2. Urban and rural population ............................................................................................... 2
FIGURE 3.A. Per capita consumption of major food items in Ethiopia, 1961–2013 .............................. 3
FIGURE 3.B. Production of animal-source foods in Ethiopia, 1961–2013.............................................. 3
FIGURE 3.C. Protein consumption.......................................................................................................... 4
FIGURE 4. National poultry population, 2005–2016........................................................................... 5
FIGURE 5. Map of the main typologies of livestock production zones by the major
administrative regions of Ethiopia ................................................................................... 10
FIGURE 6.A. Poultry meat consumption, 2003–2013 .......................................................................... 27
FIGURE 6.B. Per capita intake of energy derived from poultry meat, 2003–2013 .............................. 27
FIGURE 6.C. Per capita intake of protein derived from poultry meat, 2003–2013 ............................. 27
FIGURE 7.A. Poultry egg consumption, 2003–2013 ............................................................................. 28
FIGURE 7.B. Per capita intake of energy derived from poultry eggs, 2003–2013 ............................... 28
FIGURE 7.C. Per capita intake of protein derived from poultry eggs, 2003–2013............................... 28
FIGURE 8. Producer price (USD/tonne), 2006–2016 ........................................................................ 29
FIGURE 9.A. Live poultry imports, 2003–2016 ..................................................................................... 30
FIGURE 9.B. Poultry meat imports, 2003–2016 ................................................................................... 31
vForeword
The poultry sector continues to grow and industrialize in many parts of the world. An
increasing human population, greater purchasing power and urbanization have been strong
drivers of growth. A clear division is developing between industrialized production systems of
large and medium size feeding into integrated value chains, and extensive production systems
supporting livelihoods and supplying local or niche markets. The primary role of the former is
to supply cheap and safe food to populations often distant from the source of supply, while
the latter acts as a source of nutrition and livelihood safety net, often as part of a diverse
portfolio of income sources. Understanding how poultry production systems and value chains
work is essential in order to develop a country’s poultry sector sustainably.
This review for Ethiopia is part of a series of Country Reviews commissioned by the Animal
Production and Health Division (AGA) of the Food and Agriculture Organization of the United
Nations (FAO). The reviews aim to support sustainable and effective development
interventions and policy recommendations and contribute to informed decision-making and
investments in the poultry sector by:
providing information and data about national poultry supply chains (with a special
focus on poultry production);
analysing strengths, weaknesses and prospects along the supply chain;
identifying opportunities for poultry sector development.
This review is not intended to be exhaustive. Some topics are only partially covered or not
covered at all and the document will be supplemented and updated on a continuous basis.
Contributions and feedback are welcome by the author(s) and AGA1.
1 For more information please visit the FAO website at: www.fao.org/poultry-production-products or
contact Poultry-Gateway@fao.org
viAcknowledgements
The contribution of Mr Aman Getiso is appreciated for his resourceful engagement in
collecting and summarizing some of the statistical information used in drafting this report.
Mrs Elfinesh Balcha, a rural farmer involved in extensive scavenging poultry production, and
Mr Ghirmai Gebreselasie, manager of Adama Poultry, Poultry Products and Feed Processing
Farm PLC are highly appreciated for their kind cooperation in the case studies. Sincere
appreciations also go to the managers and technical personnel of many of the organizations
listed in the contact list.
We would like to thank the following FAO colleagues who reviewed the document and
provided valuable feedback and inputs: Francesca Castri, Francesca Distefano, Tadele Mirkena
and Felix Njeumi.
viiAcronyms and abbreviations
AGP Agricultural Growth Program
ATA Agricultural Transformation Agency
CSA Central Statistical Authority
CRGE Climate-resilient green economy
DZARC Debre Zeit Agricultural Research Centre
DOCs Day-old chicks
EIAR Ethiopian Institute of Agricultural Research
FAO Food and Agriculture Organization of the United Nations
FCR Feed conversion ratio
FDRE the Federal Democratic Republic of Ethiopia
GDP Gross domestic product
GNI Gross national income
GP Grandparent
GTP Growth and transformation plan
HPAI Highly pathogenic avian influenza
ILRI International Livestock Research Institute
LMP Livestock Master Plan
MoANR Ministry of Agriculture and Natural Resources
MoA Ministry of Agriculture
NAHDIC National Animal Health Diagnostic and Investigation Centre
ND Newcastle disease
NVI National Veterinary Institute
NGO Non-governmental organization
OIE World Organization for Animal Health
SMEs Small and micro enterprises
SNNPR Southern Nations, Nationalities and Peoples’ Region
USDA United States Department of Agriculture
viiiExecutive summary
Poultry production is one of the key livestock subsectors of Ethiopia. It plays important roles
in terms of generating employment opportunities, improving family nutrition, and
empowering women. It is a suitable business for poor households due to the small quantity of
land needed and low investment costs required to start up and run the operation.
The current poultry population of Ethiopia is estimated to be around 60 million out of which
the majority (37.9 percent or 22.7 million) are chicks and only 33.6 percent (20.2 million) are
laying hens. About 56 percent (9.6 million) of Ethiopian households have poultry holdings with
varying range of flock size. However, about 80 percent of the households with poultry keep
from 1 to 9 chickens. The sector is indeed dominated by extensive scavenging and small-
extensive scavenging family poultry production systems (please see the classification system
available in Appendix 1) in rural areas.
Small-scale intensive and semi-intensive poultry production systems are found both in urban
and rural areas. However, the former are mainly concentrated in urban and peri-urban areas
in the central parts of the country. Such producers use different breeds of exotic and
indigenous chicken and obtain inputs (e.g. day-old chicks of broilers and layers, pullets, feed
and vaccines) from the medium- and large-scale intensive poultry producers in addition to a
very limited supply from government sources, particularly research centres.
Ethiopia has a small (but growing) number of medium- and large-scale intensive broiler and
layer farms (>1 000 broilers or >500 layers) located in and around Addis Ababa, Debre Zeit,
Modjo and Adama. Such poultry farms are also emerging in the growing urban areas of
Mekele, Bahir Dar, Gondar, Hawassa and Dire Dawa. Throughout the country, there are about
35 farms that are estimated to produce more than 1 000 broilers. The number of producers
operating with capacity of over 10 000 birds is very small.
The dominant proportion of the national poultry meat and eggs are produced under the
scavenging family poultry production systems using low producing indigenous breeds.
However, exotic breeds in intensive production systems are contributing to an increasing
share of production. In 2016, exotic breeds contributed to more than 27 percent of the total
number of eggs produced nationally, despite they constitute only 9 percent of the total
national flock.
Over the past several decades, the consumption of poultry meat and eggs was very low, and
remains today far below African and global averages. The average annual per capita poultry
meat consumption level in Ethiopia in 2013, estimated at 0.66 kg, was far below the East
African average of 1.64 kg. The annual per capita poultry meat consumption level of Africa,
estimated at about 6.73 kg, was more than ten times the consumption level in Ethiopia.
Likewise, the annual per capita poultry egg consumption of Ethiopia in 2013 was estimated to
be 0.36 kg, while the estimates for East Africa and Africa during the same year were about
1.03 and 2.65 kg, respectively.
The domestic market for poultry is constrained by seasonal fluctuations in demand and price.
Such fluctuations are mostly associated to the fasting tradition that prohibits consumption of
livestock products for up to 250 days of the year to Orthodox Christians, accounting for around
43 percent of the total population (CSA, 2007). However, these seasonal variations are
expected to smooth out because there are an increasing number of people of other religious
ixbackgrounds and faiths (more than 50 million today) who also consume poultry products
during these fasting periods. Moreover, rising incomes, rapidly growing population and
increasing urbanization of the country suggest that consumption and demand for poultry
products will rise in the future.
Exports and imports of poultry are limited. Export of poultry products is almost nil. The import
trade chiefly includes introduction of day-old chicks and parent stocks by large-scale intensive
poultry producers.
The value chains of both the medium and large-scale intensive and family poultry production
systems show that the sector is seriously challenged in terms of achieving optimum
production efficiency, feed availability and quality and marketing of products and inputs.
However, the prospects for the development of the poultry sector are high in both systems.
There is strong recognition and support for the sector by policy makers. The government has
set ambitious goals to transform the existing poultry system with a plan to produce a surplus
of eggs and poultry meat for export in year 2020 and to increase the contribution of poultry
meat to the total national meat consumption from the current 9 to 30 percent by 2030.
Industrial and integrated systems have already begun to grow substantially. The capacity of
local poultry integrators is rising. An increasing number of foreign companies are setting up
base in Ethiopia. Recent surveys of the sector indicate that there are many opportunities for
investment in the existing value chains. The country should exert further and sustained efforts
through investment interventions in better genetics, feed and animal health services and
marketing together with complementary policy support to attract competent new
investments to develop the sector.
x1. Introduction
1.1. COUNTRY PROFILE
TABLE 1. Geographic location, land area, population and economy
Region Eastern Africa
Surface area (sq. Km) 1 104 300 (FAO estimate)
Land area (sq. Km) 1 000 000 (FAO estimate)
Population, total 104.9 (World Bank, 2017)
(millions, 2017)
Population, growth rate 2.5 (World Bank, 2018)
(annual %, 2017)
Economy group Low-income economy (World Bank, 2018)
GDP (current USD, 80.6 (World Bank, 2018)
billions, 2017)
GDP growth rate 10.2 (World Bank, 2018)
(annual %, 2017)
GDP per capita 767.6 (World Bank, 2018)
(Current USD, 2017)
Human development 0.448, rank 174 (UNDP, 2016)
index (HDI, 2015)
Ethiopia is located in Eastern Africa. It is bordered by Eritrea, Sudan, South Sudan, Kenya,
Somalia and Djibouti. It is the second most populous nation in Africa, after Nigeria, with a
population of about 104.9 million growing at a rate of about 2.5 percent annually (Table 1).
Although it is the fastest growing economy in the region, it is also one of the low-income
economies, with a per capita GNI of 740 USD in 2017 (Figure 1). Currently, about 20 percent
of the population lives in the cities. The urban population increased from 9.7 to 19.3 million
between 2000 and 2015. This number is expected to rise further to 30.2 million by 2025 and
70.5 million by 2050 (Figure 2).
FIGURE 1. Gross national income (GNI) per capita, Atlas method (current USD)
800
700
600
Current USD
500
400
300
200
100
0
2006 2007 2008 2009 2010 2011 2012 2013 2014 2015 2016 2017
Source: World Bank, 2018
1Poultry sector review: Ethiopia
FIGURE 2. Urban and rural population
200 000
180 000
160 000
Population (thousands)
140 000
120 000
100 000 Urban
80 000 Rural
60 000
40 000
20 000
0
Source: United Nations, Department of Economic and Social Affairs, Population Division, 2017
1.2. AGRICULTURAL SECTOR
TABLE 2. Agricultural land (as percent of total land area) and contribution of agriculture to national
GDP and employment
Agricultural land 36.26 (FAOSTAT, 2018)
(% of land area, 2015)
Agriculture, value added (% GDP, 2016) 37.23 (World Bank, 2018)
Employment in agriculture (%, 2017) 68.2 (ILO, 2018)
Employment in agriculture, female 59.4 (ILO, 2018)
(%, 2017)
Agriculture is the dominant sector of the Ethiopian economy. In the 2013/14 Ethiopian fiscal
year, agriculture contributed 40 percent of the national GDP and the contribution of livestock
to the agricultural GDP was estimated to be 20.7 percent (MoFEC, 2018). In 2016, agriculture
contributed approximately 37.2 percent of the GDP. In 2017, it employed about 68.2 percent
of the population, the proportion of females employed in the sector being about 59.4 percent
(Table 2).
Livestock is an integral component of the agricultural sector. Ethiopia has the largest cattle
population in Africa, with around 59.5 million cattle. The country has 30.7 million sheep and
about similar number of goats, 1.2 million camels and 59.5 million chickens (CSA, 2017).
Livestock play a significant role as source of food and income in addition to several other
important economic and sociocultural functions.
Between 1961 and 1993, the per capita consumption of milk, meat and eggs has been
declining slightly (Figure 3.a.). Since 1993, however, the per capita consumption of milk has
been increasing while the consumption of eggs and meat has remained almost unchanged.
The trend in the production of eggs and milk followed an almost similar pattern to that of
consumption (Figure 3.b.). Meat production tended to grow slightly from 1993 to 2013.
2Introduction
However, the contribution of poultry meat to the total meat production in 2013 was only
around 9 percent (FAOSTAT, 2018). Figure 3.c. shows the contribution of different food items
to the daily per capita protein consumption in Ethiopia. The data across the time periods
considered (i.e. 1993–1995, 2003–2005, 2011–2013) showed that most of the daily per capita
protein consumption was derived from vegetal products; milk and meat from cattle, goats and
other non-poultry species. The average per capita protein consumption from eggs (0.11–
0.13 g/capita/day) and poultry meat (around 0.22 g/capita/day) over the periods considered
was very low (Figure 3.c.).
FIGURE 3.A. Per capita consumption of major food items in Ethiopia, 1961–2013
250
Index 1961 = 100
200
150
100
50
0
1961 1965 1969 1973 1977 1981 1985 1989 1993 1997 2001 2005 2009 2013
Eggs Meat Milk Cereals Roots and tubers
Source: FAOSTAT, 2018
FIGURE 3.B. Production of animal-source foods in Ethiopia, 1961–2013
800
Index 1961 = 100
700
600
500
400
300
200
100
0
1961 1965 1969 1973 1977 1981 1985 1989 1993 1997 2001 2005 2009 2013
Eggs Meat Milk
Source: FAOSTAT, 2018
3Poultry sector review: Ethiopia
FIGURE 3.C. Protein consumption
70
60
50 Other
Eggs
g/capita/day
40 Freshwater fish
Meat, others
30
Poultry meat
20 Milk
Vegetal
10
0
1993-1995 2003-2005 2011-2013
Source: FAOSTAT, 2018
42. Current status of poultry production and supply
chains
In Ethiopia, the term poultry is almost synonymous to chicken. Other poultry species such as
guinea fowl, geese, turkeys and ducks are not common in the country. Poultry production
offers considerable opportunities in terms of generating employment opportunities,
improving family nutrition, empowering women (especially in rural areas) and ultimately
ensuring household food security. Extensive scavenging poultry production is often the
domain of poor women. Reasons include that it requires little initial investment and that it
does not usually conflict with women’s other household duties.
Section 2 provides statistical information on the national poultry population (Figure 4) and on
its geographic area of distribution (Table 3). It presents the different poultry systems operating
in Ethiopia at different scales along commercial lines and the predominant systems in the
country, the extensive scavenging and small-extensive scavenging family poultry production
systems (see the classification system available in Appendix 1). Two case studies are also
presented. The first case study is on a medium-scale intensive poultry producer and includes
information on animals and management, housing, health, service availability, inputs, sales,
overall farm facilities and waste management. The second case study is on an extensive
poultry producer and includes production and household information (e.g. age, sex and family
size of owner, ownership, key uses of poultry, and percentage of income from poultry). The
information in the case studies was collected at the farm level through a questionnaire.
2.1. THE POULTRY FLOCK
The total poultry population from 2005 to 2016 is presented in Figure 4. The figure shows that
the increase in poultry population over the years has been slow and that the poultry
population in 2016 was estimated at 59.5 million. The major reason for the stagnation of the
poultry population growth is the high poultry mortality due to diseases and predators
prevalent in the scavenging production systems. For instance, about 32 million birds died due
to disease and close to 30 million birds were lost due to causes other than disease, e.g. mainly
predators in 2016 (CSA, 2017). The other reason is the limited expansion of commercial
poultry production, both in terms of number of operators and volume of operation.
FIGURE 4. National poultry population, 2005–2016
70 000
60 000
Number (thousands)
50 000
40 000
30 000
20 000
10 000
0
2005 2006 2007 2008 2009 2010 2011 2012 2013 2014 2015 2016
Source: FAOSTAT, 2018 (for data from 2005 to 2013); CSA, 2015a, 2016, 2017
5Poultry sector review: Ethiopia
2.1.1. Geographical distribution of poultry flocks
Table 3 shows the distribution of the total poultry population among the different regions of
Ethiopia in 2016. The figures indicate that Oromia region has the largest number of chickens,
followed by Amhara. The SNNPR, Oromia, Tigray and Amhara regions together represent
96 percent of the total national chicken population. The remaining 4 percent are mainly
distributed among Afar, Somali, Benshangul Gumuz and Gambela regions. Almost all of the
exotic and hybrid chickens are found in the SNNPR, Oromia, Tigray and Amhara regions.
TABLE 3. Distribution of poultry, 2016
Chickens (thousands)
Geographic area (region)
Total Indigenous Exotic Hybrid
SNNPR 11 197 9 997 485 715
Oromia 20 408 19 604 291 513
Tigray 5 746 4 288 892 566
Amhara 19 962 18 020 930 1 012
Subtotal 57 313 51 909 2 598 2 806
% of the country's total 96 96 99.7 99
Benshangul Gumuz 1 249 1 225 4 20
Gambela 386 378 4 4
Afar 198 198 - -
Somali 161 161 - -
Harari 91 91 - -
Dire Dawa 101 98 - 3
Subtotal 2 186 2 151 8 27
% of the country's total 4 4 0.3 1
Country's total 59 499 54 060 2 606 2 833
Source: CSA, 2017
2.1.2. Breeds
Use of improved genetics is one of the key elements to improving productivity in the poultry
sector. Lack of access to productive and adaptable chicken breeds still remain one of the most
critical challenges to increasing the economic contribution of the sector. Most of the chickens
kept by smallholder farmers are unimproved indigenous flocks, well-adapted to the local
environments but having slow growth rates and very poor egg productivity. Attempts to
increase productivity are mainly focused on the introduction of high yielding exotic chickens
to replace indigenous stocks. However, the success achieved in terms of improving
productivity in villages through the introduction of exotic breeds is still limited due to the
failure of imported breeds to adapt to local conditions. Other reasons include poor
management; lack of input and output markets; and shortage of quality feeds, vaccines and
veterinary inputs. Efforts to develop high yielding indigenous chicken breeds are still
insufficient.
6Current status of poultry production and supply chains
Exotic breeds
Currently there are about 5.4 million exotic and hybrid chickens, representing 9 percent of the
total national poultry population (Table 3). Exotic chickens were first introduced into Ethiopia
in 1953 and 1956 by Jimma Agricultural and Technical School and Alemaya College of
Agriculture, respectively (Wondmeneh et al., 2016). Four breeds of chickens (Rhode Island
Red, Australorp, New Hampshire and White Leghorns) were imported from Kenya, Denmark
and the United States during this time. Later, the Debre Zeit Agricultural Research Centre
(DZARC) was also involved in evaluating the performance of these breeds including additional
introductions such as the Brown Leghorn, Light Sussex and Barred Rock. Egg production,
hatchability and mortality rates of the breeds were evaluated over several years. The White
Leghorn was rated the best in terms of egg production, adaptability, disease tolerance and
feed efficiency (DZARC, 1984). In 1996, the Ministry of Agriculture and Livestock introduced
the Fayoumi chicken from Egypt. These chickens were directly distributed to rural households
throughout the country to improve the extensive scavenging and small-extensive scavenging
family poultry production systems.
In the mid 2000s, DZARC introduced the Lohman Silver and Koekoek breeds. The Lohman
Silver did not adapt to the village production system while Koekoek performed well in several
villages (Wondmeneh et al., 2016). In 2010, a layer grandparent (GP) generation was imported
and tested at the Debre Zeit poultry research farm for the first time. Two broiler parent stocks
from Hubbard breeders (Hubbard classic and Hubbard JV) were tested. The parents and
broilers of the classic line outperformed their JV counterparts. The GP was generally found to
be adaptive and suitable under on station conditions at Debre Zeit. In addition to ensuring
sustained supply of improved genetics to producers, the establishment of the GP stock
enabled the national poultry research program to develop the skill required to manage larger
breeder flocks and demonstrated the capacity of the research farm as a future source of
parent stock.
In 2015, additional introductions of exotic breeds known for their wider adaptation and high
performance were tested. Three dual purpose (Red barred, Lohman Dual and Novo color) and
three layer (Lohman brown, dominant Sussex and Novo brown) breeds are being kept at
Debre Zeit research centre. These six breeds are still under evaluation at the research centre
(Wondmeneh et al., 2016).
The Rohde Island Red (RIR), Fayoumi and Koekoek were among the chicken breeds widely
distributed to village producers, although the supply of the RIR and Fayoumi has almost
ceased. Instead, several medium- and large-scale intensive producers are involved in the
distribution of exotic breeds to producers in the different family poultry production systems.
At present Ethiochicken is the largest supplier of exotic breeds mainly to the extensive
scavenging and semi-intensive family poultry producers, operating in the four largest poultry
producing regions (the SNNPR, Oromia, Tigray and Amhara). Currently, the broiler and layer
breeds kept by most of the intensive poultry farms in the country include Cobb broilers, and
ISA, Lohman and Ross layers with parents imported mainly from the European Union (EU).
Indigenous breeds
In 2016, indigenous chickens represented about 91 percent of the total national poultry
population (Table 3). As in many other parts of Africa, the indigenous chicken of Ethiopia
actually comprise chickens with a wide range of morphologic or genetic diversity. Currently,
7Poultry sector review: Ethiopia
eight indigenous chicken ‘types’ of Ethiopia, named after either their plumage colour or
geographic origin of sampling, were reported in DAD-IS (DAD-IS, 2017). The small number of
breeds included in the database indicates the shortage of data on the chicken genetic
resources of Ethiopia. It also suggests that much of the diversity that exists in the locally
adapted populations still remains undocumented. A number of morphologic, phenotypic and
genetic characterizations (Tadelle, 2003; Halima, 2007; Nigussie, 2011; Emebet, 2015) showed
that very little variations exist among ecotypes (or the chicken 'types') and that most of the
variations in the indigenous chickens are given to variations within individual populations.
Indigenous flocks are slow in growth rates and very poor in egg productivity. Mean body
weights at 8 and 16 weeks of age could be as low as 242 and 621 g, respectively (Nigussie,
2011). The mean annual egg production does not exceed 60 eggs/hen. Despite their lower
productivity, indigenous birds are still the major suppliers of poultry products in Ethiopia. They
are well adapted to their environments, resistant to diseases, can scavenge for food, and are
able to avoid predators as they are agile and fast, with the colour and patterns of their feathers
providing natural camouflage. This suggests that improving the productive attributes of
indigenous poultry could have a significant impact on the poultry sector. The opportunities
arising from the existing huge genetic variation within indigenous populations should be
exploited. For instance, selective breeding of the indigenous Horro chicken at the DZARC
carried out since 2008 increased egg production by 123 percent and body weight by 95
percent during the first 8 generations (Wondmeneh et al., 2016).
2.2. POULTRY PRODUCTION SYSTEMS
In this review, the poultry production systems of Ethiopia are classified into the industrial and
integrated/medium- and large-scale intensive systems and the different categories of family
poultry production systems (i.e. the small-scale intensive, semi-intensive, extensive
scavenging and small-extensive scavenging systems) (Appendix 1). Producers keeping over
1 000 broilers or 500 layers are considered in the section presenting the medium- and large-
scale intensive systems. Within such systems, there are large variations among producers in
terms of technology use, management level and scale of operation. Although not exhaustive,
information is provided on some of the larger companies, with around 10 000 birds or more.
In the section regarding family poultry production systems (Section 2.2.3.), small-scale
intensive and semi-intensive production systems are treated together. The extensive
scavenging and small-extensive scavenging systems are also presented together due to the
lack of clear statistics identifying these sub systems.
2.2.1. Poultry production systems and their distribution
Medium- and large-scale intensive poultry producers are mainly located in and around cities
and major towns. They are largely concentrated between Addis Ababa, Debre Zeit and Adama.
Broiler production is concentrated in Adama, Modjo and Debre Zeit; pullet rearing is heavily
concentrated in Debre Zeit; while egg production is mainly in Addis Ababa (Vernooij et al.,
2012).
The total number of small-scale intensive poultry producers and their specific contribution to
the national poultry production is not known. However, they provide the largest share of
poultry eggs and meat to the growing urban population (Boere et al., 2015). Their distribution
is similar to that of medium- and large-scale intensive poultry producers. The semi-intensive
8Current status of poultry production and supply chains
family poultry producers, instead, are also common in rural areas connected to urban markets.
The distribution of the extensive scavenging and small-extensive family poultry production
systems is not limited to any specific location.
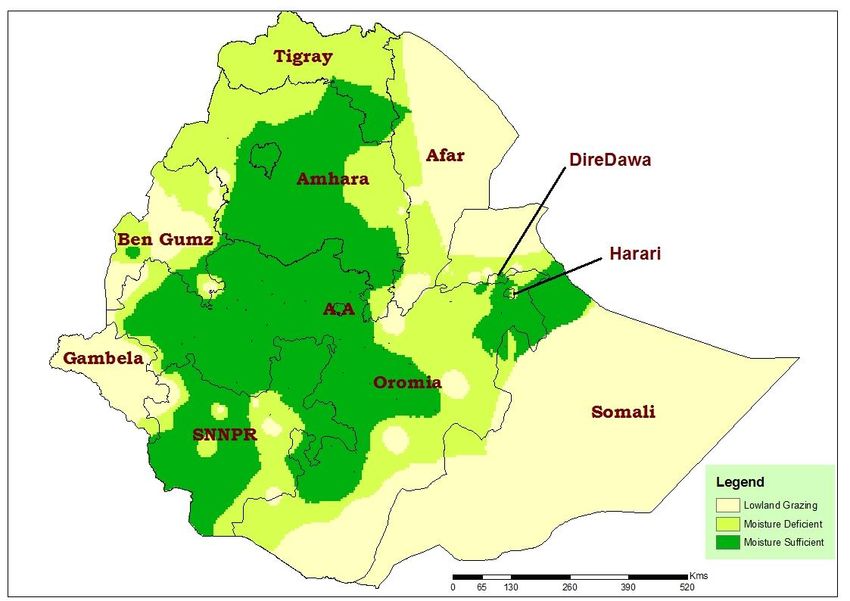
In order to support decisions on intervention strategies suitable for livestock development in
the different production environments of Ethiopia, the Ministry of Agriculture and Natural
Resources (MoANR) and ILRI (2014) defined the major livestock production systems under
each environment. The main livestock production typology zones identified are the:
(i) lowland grazing zone (includes the lowland pastoral and agro-pastoral systems);
(ii) highland mixed crop-livestock rainfall sufficient; and (iii) highland mixed crop-livestock
rainfall deficient (MoANR and ILRI, 2014).
The distribution of medium- and large-scale intensive poultry production system is not linked
to the production typology zones identified by MoANR and ILRI. However, the distribution of
family poultry production systems shows clear patterns along the production typology zones.
Family poultry systems are mostly found in the highlands (both in the mixed rainfall sufficient
and mixed rainfall deficient typology zones) and more rarely in agro-pastoral areas. Pastoral
communities do not keep chickens at all. Figure 5 shows the map of the main typologies of
livestock production zones by major adminstrative regions of Ethiopia.
9Poultry sector review: Ethiopia
FIGURE 5. Map of the main typologies of livestock production zones by the major administrative
regions of Ethiopia
Source: MoANR and ILRI, 2014
2.2.2. Industrial and integrated/medium- and large-scale intensive systems
Farms with >1 000 broilers or >500 layers are classified as medium- and large-scale intensive
poultry systems (see Appendix 1). In Ethiopia, statistics on the size and distribution of such
producers is not exhaustive. According to the estimates reported by USDA in 2017,
approximately 35 farms in the country are considered to produce over 1 000 broilers.
Producers operating with a capacity of over 10 000 birds are very small in number and are
found in and around Addis Ababa, Debre Zeit, Modjo and Adama while they are also emerging
in the growing urban areas of Mekele, Bahir Dar, Gondar, Hawassa and Dire Dawa. Currently,
there are only a few poultry integrations in Ethiopia at this scale: ELFORA Agro-Industries PLC,
Alema Farms PLC, Ethiochicken, SAFE Poultry PLC, Astral Foods, and Feedco Animal Feeds PLC
(Boere et al., 2015). ELFORA Agro-Industries PLC, located in Debre Zeit, Addis Ababa and
Chefa, was established in 1997 and is one of the largest companies engaged in poultry
operations. The company produces parent stock, hen table eggs, day-old chicks (DOCs),
pullets, broilers, and is also involved in meat processing and retailing for local and export
markets.
10Current status of poultry production and supply chains
Breeding stocks and hatching eggs
In Ethiopia, both broiler and layer parent stock are imported from other countries either in
the form of DOCs or hatching eggs. The poultry companies importing parent stocks own
hatcheries and multiplication facilities for producing DOCs for their own farms or for
dissemination to other smaller farms. Alema Farms, ELFORA Agro-Industries, Ethiochicken,
SAFE Poultry PLC, Astral Foods and Feedco Animal Feeds PLC are among the major companies
importing breeding stock, supplying DOCs and hatching eggs.
TABLE 4. Some of the major hatcheries in Ethiopia, 2015
Capacity DOC delivered
Company name Parent source
Setters Hatchers per year
Abebaw (Modjo) 28 080 7 000 365 000 ISA
Alema Farms 225 000 98 000 2 880 000 ISA, Cobb and
(new) Lohman
Ayma Poultry 57 000 19 200 250 000 ISA
Farm (Alemshet
Degife)
Daniel Getu 57 600 19 200 100 000 ISA
ELERE Farm 180 000 72 600 1 300 000 Cobb and Lohman
(Fanta Terefe)
Gerado Farm 76 800 19 200 250 000 ISA
(Ebrahim)
Hawasa Genene 57 600 18 000 120 000 ISA
SW Poultry Farm 77 000 19 200 300 000 ISA
(Samson Wossen)
Kombolcha 168 400 42 000 450 000 ISA and Koekoek
(Shimelis)
ELFORA 210 000 76 000 112 000 (per week) Ross and Hendrix
ELFORA (new 410 472 82 944 6 000 000 Cobb
farm in Chefa)
Bracod Agro- 38 400 19 200 2 000 Lohman
industry
Andasa (Bahir 38 000 12 000 10 000 Lohman
Dar)
Milkias Albert 76 800 19 200 - Cobb
Ethiochicken N/A N/A 2 400 000 N/A
SAFE Poultry PLC N/A N/A 2 000 000 N/A
Astral Foods PLC N/A N/A 50 000 (per hatch) N/A
Feedco Animal N/A N/A 50 000 (per hatch) N/A
Feeds PLC
Note: N/A= not available.
Source: Boere et al., 2015
Table 4 presents some of the major hatcheries in Ethiopia in 2015. The parent stock farms at
Alema Farms PLC rear 10 000 broilers and 5 000 layers of Ross and Lohman breeds,
11Poultry sector review: Ethiopia
respectively. The hatchery produces 2.88 million broiler and layer DOCs per year;
approximately half of the broiler DOCs produced are used for own production, the remaining
half are for sale.
The existing hatchery of ELFORA Agro-Industries can produce 112 000 DOCs per week and an
additional four new hatcheries are being established with capacity of 6 million DOCs per year.
Although ELFORA has the largest DOC production capacity, SAFE Poultry PLC, producing
around 2 million DOCs per year, is probably the largest supplier of layer DOCs to small-scale
intensive family poultry producers having a formal marketing chain with farmers for the DOCs
they provide. The DOCs produced by the former are mainly for use within its own farms.
Ethiochicken is the other company engaged in the introduction of parent stock and DOCs. It
also operates through a tailor-made distribution model with the government by supplying 40-
day-old dual purpose chicken to rural smallholder farmers. Its hatchery has a capacity of at
least 2.4 million DOCs per year.
Astral Foods PLC and Feedco Animal Feeds PLC also produce substantial numbers of broiler
and layer DOCs each with a hatching capacity of 50 000 DOCs per batch. None of these
companies are apparently engaged in the supply of fertile hatching eggs.
Despite the growing production of broiler and layer DOCs, the total output of the Ethiopian
hatcheries is too low and currently there is a severe shortage of DOCs in the country. Most of
the hatcheries in Ethiopia are poorly functioning. Knowledge on the hatching process is low
and management standards in most of the hatcheries are poor. Management of parent stocks
and hatcheries are below global industry standards (Boere et al., 2015).
Broiler meat
ELFORA Agro-Industries PLC and Alema Farms are the two major large-scale intensive broiler
producers in the country. ELFORA Agro-Industries PLC has a processing plant with an annual
production capacity of 1 000 tonnes of broiler meat. In addition to this, in 2015 it has
established an integrated poultry farm in Chefa with a capacity of 714 000 broilers per year,
producing 5 000–6 000 tonnes of broiler meat annually. Two of its processing plants have
export hygiene standards approved and registered by the Ministry of Agriculture (MoA).
Alema Farms has an annual production capacity of 150 000 broilers. The farm has a chicken
processing plant with a single processing line for 2 000 birds per hour; they also further
process some of the chicken meat into sausages. Currently, Alema Farms operates at limited
production, slaughtering only 4 000 broilers per day.
Hen table eggs
ELFORA produces about 112 million table eggs annually. The layer farms of Alema Farms hold
around 15 000 commercial layers. Ethiopia has around 10–20 medium-scale intensive poultry
producers keeping between 1 000–10 000 broilers and layers, e.g. Maranata, Almaz, Abebaw
Modjo, Genesis and Fanta poultry farms. Although data on their exact contribution to national
production is not available, they provide a large amount of eggs and poultry meat to the
growing towns (Boere et al., 2015; Vernooij et al., 2012).
12Current status of poultry production and supply chains
Feed resources and feeding systems
Most of the poultry companies described above have their own feed mills. The feeds produced
by most of these companies are intended primarily for consumption within their own farms
and only the surplus is sold to other producers. However, not all intensive poultry producers
own feed mills. Producers operating at and around 1 000 birds purchase compound feeds
from larger poultry producers and other companies specialized in feed mill operations.
Compound feeds are available mostly in the form of mash. Pellets are not common. Feeding
systems are rarely automated, including in large-scale intensive farms operating over 10 000
birds.
Environmental aspects (waste management)
Most intensive poultry farms in Ethiopia do not have clear waste management schemes. The
manure and processing by-products are usually disposed of right outside the towns where the
farms are located. Part of the poultry litter is sold to livestock producers, particularly to be
recycled as an ingredient of the feed mixtures for fattening cattle. The litter sold as feed
ingredient is untreated and carries many undesirable elements and contaminants such as
feathers, antibiotics and other poultry house wastes. Vegetable producers and gardeners are
also regular customers buying untreated poultry litter and manure for use as fertilizer. The
current practice of using untreated poultry litter by vegetable producers and gardeners in
close proximity to poultry farms can potentially cause spread or recurrence of disease.
Inspection and regulation by environmental protection authorities is almost non-existent.
CASE STUDY 1. Adama Poultry Farm, Poultry Products and Feed Processing PLC.: a medium-
scale intensive layer farm in Adama
This company is located in Oromia Regional State, Adama town, about 90 km East of Addis
Ababa. It is a private commercial farm owned by Mr Wondwesen Belay and managed by
Mr Ghirmai Gebreselassie. The farm employs a total of 28 workers including a veterinarian,
administrative and feed mill operating staff, a supervisor, poultry farm attendants, gardeners
and security guards. The poultry farm is located in a well-developed site with electricity and
adequate water supply and all weather road access.
The poultry houses have concrete walls with corrugated iron roofs, equipped with relatively
modern feeding and watering troughs and laying nests. The birds are housed on bedded floors
with standard housing spaces in sufficiently ventilated and clean houses.
The total annual production capacity of the farm is 10 000 birds. The farm has a hatchery with
capacity of producing 10 000 DOCs per month and a feed mill with capacity of 1 tonne/hour.
It also has a mini –processing plant with a small freezer capacity. Currently the farm produces
table eggs only and is operating at about half its total capacity with 5 250 Bovans Brown layers.
Laying hens (and replacement stock) are raised from DOCs purchased from other large-scale
intensive poultry producers. The hatchery and processing facilities are not functional due to
technical reasons.
The farm produces its own compound feed using raw feed materials obtained from local
markets, premixes are purchased from importers. Vaccinations against ND, Marek's, Gumboro
and Fowl Pox are carried out on a regular basis following the schedules provided by the
13Poultry sector review: Ethiopia
manufacturer. The mortality rate of the farm during the brooding and growing period ranges
from 10 to 15 percent. Daily records are kept on laying performance, morbidity and mortality.
Table eggs are sold to local traders and supermarkets around Adama and Addis Ababa. Prices
fluctuate seasonally, falling substantially during the Orthodox Christians' fasting periods.
Interference of brokers and lack of market information are serious constraints to the
marketing of products. The poultry farm wastes are disposed into deep pits while dead birds
are incinerated.
2.2.3. Family poultry production systems
In rural areas, family poultry production systems generate tremendous opportunities in terms
of improving food security and nutrition and empowering women. Family poultry production
is a suitable enterprise for women and poor households due to the small quantity of land
needed and low investment costs required to start up and run the operation. Family poultry
production can empower rural women, despite their often poorer access to land and inputs
as well as their heavy work burden within rural households.
In this review, family poultry production systems are classified into four categories based on
market access, production objectives, level of specialization/technology use, flock size, etc.
(Appendix 1). The characteristics of such systems in Ethiopia are described below:
1) The small-scale intensive system, is based on the use of specialized, commercial DOCs or
pullets (200–1 000 broilers, 100–500 layers), commercial balanced rations and good quality
houses. Producers under this system have full access to veterinary services and the overall
mortality rates of birds are low to medium (50 percent).
The Ethiopian Livestock Master Plan (LMP) estimated that there were about 120 000
households under the semi-intensive family poultry system in 2014 (Shapiro et al., 2015).
However, the CSA report shows that the number of chicken holders with flock sizes ranging
from 50 to 199 is only about 9 000, of which around 8 000 holding from 50 to 99 chickens
(CSA, 2017).
14Current status of poultry production and supply chains
TABLE 5. Number of chicken holders by size of chicken holding, 2017
Total number of Number of households by size of chicken holding
households 100 to
Region 1 to 9 10 to 49 50 to 99
owning chickens 199
(thousands) chickens chickens chickens
chickens
Country's total 9 649.2 7 696 1 945 7.1 1.1
SNNPR 2 032.4 1 702 330 0.3 0.1
Oromia 3 256 2 581 674 1 -
Tigray 919.6 727 192 0.6 -
Amhara 3 174 2 500 669 4 1
Benshangul 148.4 101 47 0.3 -
Gumuz
Gambela 36.3 21 15 0.3 -
Afar 22.5 15 7 0.5 -
Somali 27 22 5 - -
Harari 14 11 3 - -
Dire Dawa 19 16 3 0.04 -
Source: CSA, 2017
3) The extensive scavenging system shares almost all the attributes described below for small
extensive system. However, it is based on a larger flock size (ranging from 5 to 50 birds)
comprised of indigenous and/or crossbred chickens and it is practiced by households having
access to rural markets. Producers in this system do not have regular access to exotic chickens
and usually raise their own replacement stock. Food security and income generation are the
primary reasons for keeping chickens. They use broody hens to hatch replacement stock.
4) The small-extensive scavenging system is practiced by households located in remote villages
with little or no access to markets, with the main purpose of chicken rearing being for
household consumption. It is based on a flock size of 1–5 indigenous chickens kept under
scavenging conditions. Birds have no or little supplementary feeding and no housing. Chicks
are produced through natural incubation. This system is also characterized by high chicken
mortality (often >70 percent) due to lack of proper health care and veterinary services.
The extensive scavenging and small-extensive scavenging systems are the dominant forms of
poultry production in Ethiopia. A report by the CSA (CSA, 2017) shows that out of the
estimated total of 17.2 million households in the country, the number of households keeping
poultry is about 9.6 million (56 percent). About 80 percent of such households (7.7 million
households) keep from 1 to 9 chickens while 19.6 percent (about 1.9 million households) keep
from 10 to 49 chickens (Table 5), indicating that the dominant proportion of poultry producers
practice small-extensive scavenging family poultry production followed by extensive
scavenging.
In extensive scavenging systems, poultry keeping is mainly an activity undertaken by women
and can be a source of supplementary income. Poultry can contribute to as much as 20–25
percent of the household income, much of which is controlled by women (Ayele and Rich,
2010). A study by Gebremedhin et al. (2016) found that decisions on the income generated
15Poultry sector review: Ethiopia
from scavenging poultry belonged to women in 30 percent of the cases and by both women
and men in about 54 percent of the cases. Poultry income is often used to cover school
expenses, indicating that targeting rural women in family poultry development schemes does
not only mean empowering women but also contributing to the education of their children.
The small-extensive scavenging and extensive scavenging family poultry production systems
are low-input low-output systems. Table 6 presents the proportion of different poultry types
in the flock. The overall flock structure shows significant number of unproductive birds carried
both to ensure replacement and also as a means of averting risks associated to the heavy
mortality inherent in this type of system. Laying hens comprise only about 34 percent of the
total national poultry flock.
TABLE 6. Estimated number (thousands) of poultry by type and breed classification in Ethiopia,
2017
Breed classification
Poultry All poultry
Indigenous Exotic Hybrid
type*
Number % Number % Number % Number %
Cocks 5 843 9.8 5 283 8.9 258 0.4 302 0.5
Cockerels 3 296 5.5 2 997 5.0 102 0.2 197 0.3
Pullets 6 246 10.5 5 416 9.1 437 0.7 393 0.7
Non-
laying 1 629 2.7 1 506 2.5 59 0.1 64 0.1
hens
Chicks 22 568 37.9 21 499 36.1 240 0.4 830 1.4
Laying
19 912 33.6 17 352 29.2 1 515 2.6 1 045 1.8
hens
Total 59 495 100 54 054 90.9 2 610 4.4 2 831 4.7
*Poultry are classified according to the Ethiopian context: males and hens over 24 weeks of age are referred
to as cocks and laying-hens, males and females between 8 and 24 weeks are referred to as cockerels and
pullets, both males and females from day-old to 8 weeks of age are referred to as chicks, and spent hens in
the poultry flock are referred to as non-laying hens.
Source: CSA, 2017
16You can also read