Livestock Product Value Chains in East Africa A Scoping and Preliminary Mapping Study - regional solutions to local problems - Kilimo Trust
←
→
Page content transcription
If your browser does not render page correctly, please read the page content below
Livestock Product Value Chains in East Africa
 A Scoping and Preliminary Mapping Study

                 regional solutions to local problems
Produced by DEVELOPMENT ASSOCIATES LTD
     P.O. Box 60023, Dar Es Salaam, Tanzania
          Email: dass@africaonline.co.tz
                  March 2009

                    for

            KILIMO TRUST
EXECUTIVE SUMMARY
1) An extensive assessment of poverty in East Africa, conducted by ILRI in 2002 found out
that areas where livestock raising is the main livelihood activity are often the ones with
highest incidences of poverty in East Africa. In Tanzania, for example, agro-pastoral and
pastoral areas account for 95% of the cattle population, yet most agro-pastoral and pastoral
households live below the poverty line of US$ 1 per day. At the same time, estimates made
using available statistics of livestock, average rates of off take and world prices gives a total
value of annual trade in livestock and livestock products in East Africa at about US$ 5
billion. If realized, this would be about 12% of the reported GDP of the EAC member
countries combined. Given that there are case studies which show that the current statistics
on livestock could be an under-estimate, it is clear that a significant proportion of wealth in
East Africa is held in the form of livestock.
2) The purpose of this scoping study was to assess, confirm and articulate what the
stakeholders consider to be the most critical gaps with respect to information and evidence
they need to strategize on trade in livestock and livestock products in East Africa. The
findings were then to inform Kilimo Trust’s process of designing a strategic study that will
contribute to the availability of the demanded information and evidence. The scoping study
was therefore designed to undertake the following:
a) Analysis of Value Chains and Key Stakeholders - starting with the key livestock types
and products followed by preliminary mapping of the main value chains as well as the
stakeholders/actors in these chains.
b) Articulation of Issues of the different Stakeholders – through key informant interviews
with individuals and focus groups; and
c) Validation of Identified Issues – by assessing which of the issues identified by
stakeholders represent opportunities that warrant further Strategic Studies.
3) To deliver these outputs, data collection included review of existing documents and
stakeholder interviews. Documents reviewed included published materials and grey
literature obtained from different stakeholders in the public and private sector. Interviews
of stakeholders were conducted through e-mail, telephone and personal interviews guided
by a checklist developed for this purpose. The interviews covered all relevant stakeholders
in the livestock sector/value chains including input suppliers, producers and their
associations, processors and their associations, traders and their associations, consumers,
livestock boards, NGOs involved in livestock development, local government officials and
government ministries responsible for livestock development
4) The findings show that, stakeholders are concerned by four clusters of issues:
a) Productivity issues: which were mainly raised by traders, processors, retailers, and
consumers, whose principal concerns related to volumes, timing and quality of livestock
and livestock products available in the market. On the other hand, the producers
presented productivity issues in terms of poor incentives to invest in the improvement
of productivity due to low returns, drought problems, and unavailability and high costs
of necessary inputs.
Kilimo Trust: regional solutions to local problems Page ib) Handling and processing issues: there was a strong contradiction between the views of
producers on one hand, and other actors on the handling and processing issues. The
producers mainly identified inadequate facilities for handling and processing of
livestock products, while processors considered the main problem to be the inadequate
and low quality supply of raw material to fully utilize installed capacity. The main
consequence has been a vicious cycle where few investors are attracted to invest in
handling and processing facilities for fear of low capacity utilization, while producers are
reluctant to increase production because of perceived low off-take.
c) Marketing and trade issues: Both productivity, and handling and processing issues were
perceived as factors limiting marketing and trade. Other issues raised included the
informality of livestock trade, high transaction costs, inadequate supportive
infrastructure, heavy taxation, lack of classification and grading systems, poor hygiene of
most outlets (the main issue raised by consumers), unfair competition from imported
products, and limited business management capacity along the value chain. Interestingly
almost all issues focused on national and regional trade, and rarely on international
export trade. It is also notable and informative that nearly all the actors along the chain
raised the issue of limited demand for livestock products as a major constraint.
d) Cross-cutting institutional and policy issues: nearly all stakeholders were of the opinion
that most of the constraints facing the livestock sector are not being addressed due to a
weak institutional framework, mainly caused by limited implementation of policy.
5) The findings also show that there have been many projects and programmes in the region
designed to deal with these issues. However, most of these interventions have not
succeeded for three main reasons: firstly, the poor quality of data for planning,
underscoring the fact that collection and analysis of statistics is an area that has long been
neglected by all stakeholders in the livestock sector. Therefore, unreliability (or even the
unavailability) of baseline statistics has resulted in the pursuit of wrongly or inadequately
identified objectives in many interventions. Secondly, there has apparently been poor
integration of different projects and programs leading to duplication and gaps. Thirdly and
most importantly, is the poor vertical integration of the value chains. For example, there is
very little knowledge of the dynamics of markets and the acceptable grades and standards
for livestock and livestock products.
6) In view of these findings, it is recommended that a Strategic Study should be commissioned
to quantify the final markets (national and regional) for livestock and livestock products in
East Africa and develop baseline data for planning. The specific objectives will be to:
a)Identify the most important segments of the markets of final products for major livestock
products. For example, for traditional chicken they comprise live birds, dressed meat, fast
cooked meat, certified organic meat or eggs, and so on.
b) Determine and quantify the distinctive characteristics of each of these market segments
such as market size and growth projections.
c) Determine the Critical Success Factors (CSFs), such as price, quality, differentiation,
branding and volatility, for each segment.
Kilimo Trust: regional solutions to local problems Page iid) Benchmark chain efficiencies, with respect to the ability of the chain to meet the CSFs
which it confronts in its final markets.
e)Identify priority investments needed to facilitate the performance of various value chains
for the livestock products with the brightest future in terms of market size and growth.
Kilimo Trust: regional solutions to local problems Page iiiACKNOWLEDGEMENTS This document is a result of studies and consultations with several stakeholders in Tanzania, Kenya, Uganda, Rwanda and Burundi. We are grateful to all Government Officials, individuals and institutions that contributed information and data through interviews, discussions and valuable suggestions on how the livestock sector can be improved to benefit the poor in East Africa. We are very grateful to the research Assistants Mr. Issack Isae, Mr. Venuste Rusharaza, and Ms. Carol Mtui for a commendable job of collecting all the valuable grey literature and information from all countries. We wish to thank Mr. Stephen Kimani and the rest of the Kilimo Trust staff for the invaluable support and patience. Finally, we wish to express our sincere thanks to all our partners and associates who in one way or the other contributed to the success of this assignment. Kilimo Trust: regional solutions to local problems Page iv
ABBREVIATIONS

ACP                   Africa Caribbean Pacific
A.I.                  Artificial Insemination
ASAL                  Arid Semi Arid Lands
ATD                   Pg 19
AU/IBAR               African Union/ Inter African Bureau for Animal Resources
BCK                   Pg 15
BPN                   Pg 23
CAHW                  Community Animal Health Worker
CBO’s                 Community Based Organizations
CBPP                  Contagious Bovine Pleuropneumonia
COTAGIRWA             Pg 19
CRSP                  Collaborative Research Support Program
CSF                   Criticcal Success Factors
CYMMIT                International Maize and Wheat Improvement Center
DFID                  Department of International Development
DASIP                 District Agriculture Investment Project
DRC                   Democratic Republic of Congo
EA                    East Africa
EAC                   East African Community
EU                    European Union
FAO                   Food and Agriculture Organization
FBO’s                 Faith Based Organizations
FMD                   Foot and Mouth Disease
GBK                   Pg 17
HPI                   Heifer Project International
ICRAF                 The International Centre for Research in Agroforestry
IFPRI                 The International Food Policy Research Institute
ILRI                  International Livestock Research Institute
KCC                   Kenya Creameries Company
LAT                   Leather Association of Tanzania
LGA                   Local Government Authority
LINK                  Livestock Information Network and Knowledge System
LISSA                 Livestock Self-Help Association
LTMS-K                Livestock Traders Society of Kenya
MINAGRI               Ministry of Agriculture and Animal Resources, Rwanda
MOET                  Multiple Ovulation Embryo Transfer
MT                    Metric Tons
NAIC                  National Artificial Insemination Centre
NGOs                  Non Governmental Organization
PAAP                  Policy Analysis and Advocacy Programme
PINGOs                Pastoralist Indigenous Non-Governmental Organization
R&D                   Research and Development
RTTDC                 Regional Programme on Ticks and Tick-borne Diseases
SACCOs                Savings and Credit Associations
SMEs                  Small and Medium Enterprises
SNV                   Netherlands Development Organisation
SSA                   Sub-Saharan Africa
TAD’s                 Transboundary Animal Diseases
UHT                   Ultra High Temperature processed milk
US                    United States

Kilimo Trust: regional solutions to local problems                               Page v
Table of Contents

EXECUTIVE SUMMARY ............................................................................................................................... i
ACKNOWLEDGEMENTS ............................................................................................................................iv
ABBREVIATIONS ...........................................................................................................................................v
1      INTRODUCTION................................................................................................................................... 1
2      LIVESTOCK OPPORTUNITIES AND PROSPECTS IN THE EAC REGION ............................ 3
    2.1    Livestock and Reduction of Poverty in East Africa: the potential .................................................... 3
    2.2    Livestock and Reduction of Poverty in East Africa: the market opportunities ................................ 7
      2.2.1    Estimated demand and supply gaps in the East African Market .............................................. 7
       2.2.2          Opportunities for export beyond the EAC ............................................................................... 9
    2.3    On-going Trade in the East Africa Region ...................................................................................... 10
      2.3.1    Meat Products ........................................................................................................................... 10
       2.3.2          Dairy cattle and dairy products ................................................................................................ 11
       2.3.3          Hides and skins......................................................................................................................... 12
3      LIVESTOCK VALUE CHAINS AND KEY ACTORS IN THE EAC REGION ........................... 14
    Overview ...................................................................................................................................................... 14
    3.1    Meat Value Chain ............................................................................................................................ 14
      3.1.1     Production ................................................................................................................................ 15
       3.1.2          Bulking ...................................................................................................................................... 15
       3.1.3          Wholesale and transportation .................................................................................................. 16
       3.1.4          Processors ................................................................................................................................. 16
       3.1.5          Retailers..................................................................................................................................... 17
       3.1.6          Consumers ................................................................................................................................ 18
       3.1.7 Discussion – number of participants in the meat value chain and potential for poverty reduction
                18
    3.2    Dairy Value Chain............................................................................................................................ 18
      3.2.1    Production ................................................................................................................................ 18
       3.2.2          Bulking and Transportation ..................................................................................................... 19
       3.2.3          Processing and wholesale ......................................................................................................... 19
       3.2.4          Retail ......................................................................................................................................... 20
       3.2.5          Consumption ............................................................................................................................ 20
       3.2.6 Discussion – number of participants in the dairy value chain and potential for poverty reduction
                20
    3.3    Eggs Value Chain ............................................................................................................................. 20
    3.4    Hides and skins ................................................................................................................................ 21
      3.4.1    Production ................................................................................................................................ 21
       3.4.2          Bulking ...................................................................................................................................... 21
       3.4.3          Wholesale ................................................................................................................................. 21
       3.4.4          Processing ................................................................................................................................. 22
       3.4.5          Retail and consumption............................................................................................................ 22
Kilimo Trust: regional solutions to local problems                                                                                          Page vi
3.4.6 Discussion – number of participants and potential for poverty reduction ............................. 22
3.5 Supporting Environment ................................................................................................................. 24
3.5.1 Inputs supply............................................................................................................................. 24
3.5.2 Provision of services ................................................................................................................. 24
3.5.3 Key institutions ......................................................................................................................... 24
4 KEY ISSUES AND KNOWLEDGE GAPS ........................................................................................ 26
4.1 Productivity ....................................................................................................................................... 26
4.1.1 Issues ......................................................................................................................................... 26
4.1.2 What has already been done on the identified issues ............................................................. 27
4.1.3 Knowledge gaps ........................................................................................................................ 28
4.2 Handling and Processing ................................................................................................................. 29
4.2.1 Issues ......................................................................................................................................... 29
4.2.2 What has already been done on the identified issues ............................................................. 30
4.2.3 Knowledge gaps ........................................................................................................................ 31
4.3 Marketing and Trade ....................................................................................................................... 32
4.3.1 Issues ......................................................................................................................................... 32
4.3.2 What has already been done on the identified issues ............................................................. 33
4.3.3 Knowledge gaps ........................................................................................................................ 34
4.4 Cross-cutting Institutional and Policy Issues ................................................................................... 35
4.4.1 Issues ......................................................................................................................................... 35
4.4.2 What has already been done on the identified issues ............................................................. 36
5 CONCLUSIONS AND RECOMMENDATIONS ............................................................................. 37
5.1 Key Value Chains ............................................................................................................................. 37
5.2 Articulation of Issues by Stakeholders ............................................................................................ 38
5.3 Validation of Knowledge Gaps ........................................................................................................ 39
5.4 Proposed Scope and Objectives of the Required Strategic Study .................................................. 41
Appendix 1: Stakeholders/Institutions Contacted for Information .............................................................. 46
Appendix 3: Summary of Key issues, causes, knowledge gaps and possible actions proposed by
Stakeholders .................................................................................................................................................... 54
List of Tables
Table 1:Estimated annual production of products from slaughtered animals ................................................ 5
Table 2: Estimated annual production of products from live animals ............................................................ 5
Table 3: Export of meat (MT) from EA countries ........................................................................................ 10
Table 4: Export of poultry products from EA countries .............................................................................. 11
Table 5: Export of pig meat (MT) from EA countries ................................................................................. 11
Table 6: Export of dairy products (MT) from EA countries ......................................................................... 12
Table 7: Exports of Hides and Skins/leather from East Africa, 2000-2005................................................. 12
Kilimo Trust: regional solutions to local problems Page viiList of Figures Figure 1: Past price trends and projected changes in per capita consumption of livestock products ............ 1 Figure 2: Livestock population in East Africa (est. 2005) ................................................................................ 4 Figure 3: Estimated annual value of selected livestock products total for the EAC @ world prices .............. 6 Figure 4: Poverty in East Africa – Uganda, Tanzani and Kenya. After Thornton et al. 2002 ....................... 7 Figure 5: An estimate of demand and supply of meat and raw milk in the EAC region ................................ 8 Figure 6: Schematic presentation of typical livestock value chain ................................................................. 14 Figure 7: Value Chain for hides and skins in East Africa .............................................................................. 23 Figure 8: Proportional distribution of funding of different aspects of new livestock development programs in Kenya. .......................................................................................................................................................... 40 Kilimo Trust: regional solutions to local problems Page viii
1   INTRODUCTION

1) Before the recent global economic crisis, all projections were pointing towards a rapid increase in the
   demand for livestock products. These projections were based on the rapid rate of population growth as
   well as the proportion of people with higher incomes. For example, in 2007 IFPRI estimated that by
   2050, consumption of meat per capita will double in Sub-Saharan Africa, increase by 82% in Asia, and
   increase by 65% in the Middle East and North Africa, compared to the consumption rates in year
   2000 (Figure 1a). Recently there was an extraordinary increase in the world prices of many food
   commodities, and the , prices of livestock, especially dairy products mirrored those of grains such as
   rice, wheat and maize. This proved beyond doubt that livestock products are now key food staples.
   Figure 1b, from FAO show that in a period of ten years (between Jan 1998 and December 2007), the
   price of whole milk powder rose by a factor of 2.5 and the price of butter doubled. Price of some meat
   products also increased.

________________________________________________________________________________

                                                Figure1b: Price of dairy whole milk powder, dairy
Figure 1a: Expected per capita meat consumption butter, bovine meat, poultry meat (1998 – 2008)
(2000 vs 2050)                                  Source: FAO International Commodity Prices Data
Source: IFPRI, 2007                             (15 September 2008): http//www.Fao.org
________________________________________________________________________________

Figure 1: Past price trends and projected changes in per capita consumption of livestock products

2) The current economic crisis will slow down, but is not expected to reverse the nutrition revolution
   driven by millions of new entrants to the middle class status, especially in Asia and the Middle East.
   Therefore, the world will continue to see a shift away from traditional staples such as roots and tubers,
   and a corresponding increase in the consumption of livestock products particularly meat and dairy
   products. For example, by 2007, Chinese annual average (per capita) meat consumption had risen to
   50 kg from a level of just 20 kg in 1985. For this reason China alone accounts for 57% of the rise in
   total meat consumption in developed countries.

3) The trends described above indicate expanding market opportunities for the livestock sector, except
   for the fact that barriers (especially food safety requirements) to international markets for livestock
   products are more stringent than for crop products. Because of frequent outbreak and endemic nature
   of livestock diseases, livestock products from Sub-Saharan Africa (SSA) cannot compete with other
   major exporters in the developed world which meet food safety standards. . The difficulties in disease
Kilimo Trust: regional solutions to local problems                                        Page 1
control and the near impossibility of eradication due to high costs means that the livestock sector in SSA has few options for taping into the expanding global market. For this reason it is important to focus on national and regional markets. 4) This scoping study was therefore designed to identify most promising livestock value chains for livestock trade within and among the five countries that are members of the East African Community; namely Burundi, Kenya, Rwanda, Tanzania and Uganda. In this region it is estimated that between 80 and 90% of the poor keep livestock of some type. In Uganda, Tanzania and Kenya most of the livestock (over 60%) is found in the arid and semi-arid areas, where livestock constitute the major asset for more than 90% of the population. 5) History shows that development of the livestock sector since the start of economic liberalization programmes has included programs to expand and support livestock production in the long-run. Through liberalization there has been an overall policy shift towards privatization and substantial effort has been focused on putting into place appropriate and conducive policy frameworks for the private sector to operate. In almost all the countries in the region, reforms have been undertaken in research, extension, veterinary services, credit services and trade. Research has been reformed either through centralization or decentralization of research organization while extension and veterinary services have been reformed through allowing the private sector to participate in the delivery of these services. In marketing and trade, countries in the region have increasingly opened their markets and willingness to satisfy international sanitary standards to be able to access international markets. 6) The purpose of the study was to confirm demand by stakeholders and to articulate what they consider as the most critical gaps with respect to information and evidence they need to strategize for improved trade of livestock products in the region. The main output of the study is a detailed situation and stakeholder analysis regarding trade in livestock and livestock products in the region and an articulation of preliminary issues that require further detailed assessment. 7) Data collection methods employed to achieve the objectives of the study included review of existing documents and stakeholders interviews. Documents reviewed included published materials and grey literature obtained from different stakeholders in the public and private sector. Interviews of stakeholders were conducted through e-mail, telephone and personal interviews guided by a checklist developed for this purpose. The interviews covered all relevant stakeholders in the livestock sector/value chains including inputs suppliers, producers and their associations, processors and their associations, traders and their associations, consumers, livestock boards, NGOs involved in livestock development, local government officials and government ministries responsible for livestock development (See Appendix 1). 8) The report is organized into five chapters with chapter 2 providing a preliminary evaluation of the market opportunities and prospects. Chapter 3 describes the major livestock value chains in the region as well as the key actors in those chains. Chapter 4 presents; key issues of concern to stakeholders, evaluates what has already been done or is being done by governments and other projects to deal with these issues, and then deduces the genuine knowledge gaps. Chapter 5 discusses and provides recommendations on the scope of a strategic study that should be commissioned to deal with the identified knowledge gaps. The report is supported by the following appendixes: a) Appendix 1: Stakeholders/Institutions Consulted b) Appendix 2: Livestock Value Chains and Key Actors in East Africa c) Appendix 3: Summary of Key issues, causes, knowledge gaps and possible actions Kilimo Trust: regional solutions to local problems Page 2
2     LIVESTOCK OPPORTUNITIES AND PROSPECTS IN THE EAC REGION

9) The most important elements in turning livestock or any asset potential to incomes and development
   are the production potential, market opportunities, and the means of linking the potential and the
   opportunities. This section presents a review of literature and discusses two questions:
      a) Does the livestock asset provide a potential for poverty reduction?

      b) Are there opportunities that the livestock keepers can exploit to transform their livestock assets
         into incomes and other forms of wealth?

10) If there is potential it is important to understand how big it is in terms of cash income that farmers can
    generate and utilize to get out of poverty. If indeed there is substantial potential what factors contribute
    to low contribution of livestock to poverty reduction in the traditional livestock sector in the EA
    region? Are the market opportunities for livestock and livestock products (national, regional,
    international markets) large enough to drive the growth of the livestock sectors in the EA region and
    sustain livelihoods of the poor?

2.1     Livestock and Reduction of Poverty in East Africa: the potential

11) There is evidence in the literature that livestock often generates higher and more reliable income
    compared to most of the traditional agricultural activities and thus offers a genuine potential for
    livestock keeping households to increase their incomes through improved production, processing and
    marketing of livestock and livestock products (Staal, 1997, MoAC/SUA/ILRI, 1998, Mdoe, et al.,
    2002). We will come back to this discussion in section 1.2, but let us look at whether the potential is
    actually real.

12) In trying to assemble statistics of the actual number of livestock in the region, one of the main findings
    of this scoping study is that there is a large paucity of correct and up-dated statistics on the number of
    livestock in the region. For example, an appraisal conducted in Kenya by the Smallholder Dairy
    Project, found out and concluded that the size of the dairy herd in Kenya could be twice that given in
    official statistics (Republic of Kenya, 2006). Efforts have been initiated in Uganda to conduct livestock
    census, and it is expected that reliable statistics will be available to correctly gauge the real size of this
    key asset for the rural households.

13) Figure 2 provides statistics assembled from different sources for the two main types of livestock,
    namely ruminants and poultry. These statistics show that the size of livestock asset in the region is
    estimated at 41 million cattle heads, 33 million goats, 14 million sheep, 900,000 camels, and 130
    million poultry. There are also other livestock such as pigs (3 million). Statistics also show that bee-
    keeping is an important undertaking by the smallholders in East Africa.

14) To gauge the potential of the livestock sector in poverty reduction, there is a need to assess the extent
    to which the livestock assets, as depicted in Figure 2, are converted into income per year. Despite the
    large livestock population in the region, the production of different livestock products for the market,
    is very low (Tables 1 and 2). On average beef production is estimated as just below 800,000 MT. A
    high proportion of this comes from cattle raised mainly for beef in the arid and semi-arid areas. A
    small proportion comes from dairy cattle. Off take from small ruminant livestock is estimated at an
    average of 130 MT which could be a gross under-estimation because majority of goats and sheep are
    consumed within the producing households. Similarly the estimated average production of 108 MT of
    poultry meat could be a gross under-estimation because majority of the poultry and poultry products
    are consumed within the producing households. However, the free-range poultry is one of the most
    important assets of rural poor households. Pig meat production in the EA region is estimated at 111
    MT per annum of which about 70% is produced in Uganda. For hides and skins, available statistics

Kilimo Trust: regional solutions to local problems                                              Page 3
show that 5.71 million pieces of hides and 12.31 million pieces of skins (goats and sheep) are produced annually in the EA region. These are equivalent to 129,070 MT. Figure 2: Livestock population in East Africa (est. 2005) Source: FAOSTAT Data (2004) and National Statistics Kilimo Trust: regional solutions to local problems Page 4
Table 1:Estimated annual production of products from slaughtered animals

 Country         Beef        Goat and Sheep       Poultry Meat       Pig Meat    Hides and Skins (‘000
                (MT)              Meat               (MT)             (MT)              pieces)
                                  (MT)
                                                                                   Hides         Skins
 Burundi          9,000                 4,000           5,000        5,000                  36       325
 Kenya          290,000               53,000          20,000        12,000               2,420     6,900
 Rwanda          19,000                 3,000           1,000        3,000                  75       342
 Tanzania      370, 000               40,000          41,000        13,000               1,980     2,740
 Uganda          97,000               31,000          41,000        78,000               1,209     2,000
 Total          785,000              131,000         108,000       111,000               5,710    12,310
Source: National Statistics
Table 2: Estimated annual production of products from live animals

 Country           Milk              Eggs               Wool              Honey              Beeswax
                  (MT)             (Numbers)            (MT)              (MT)                (MT)
 Burundi               19,000             3,000                                    800              800
 Kenya             4,000,000          1,255,000              1,500              20,000           20,000
 Rwanda               120,000             2,000                                  1,000            1,000
 Tanzania             715,000            63,000                                 45,000           16,000
 Uganda               511,000            20,000                                 14,000           11,000
 Total             5,365,000          1,343,000              1,500              80,800           48,800
Source: National Statistics

15) Figure 3 shows a rough estimate of the value of major livestock products harvested each year in the
    region. These estimates have been made using average world prices and it is estimated that these values
    could be realized in the city markets in East Africa.

16) Livestock also plays an important role in the production of crops by providing manure for soil fertility
    improvement. However, to calculate the value of manure is complicated and will not be attempted
    here. It is therefore clear that a significant value is held in the form of livestock.

               There are case studies which show that the current statistics on livestock
               could be an under-estimate, it is clear that a significant proportion of wealth
               in East Africa is held in the form of livestock. The total value of the total
               annual production from live animals adds to about US$ 5 billion. If realized
               this would be about 12% of the reported GDP of the EAC member
               countries combined.

Kilimo Trust: regional solutions to local problems                                          Page 5
Figure 3: Estimated annual value of selected livestock products total for the EAC @ world prices
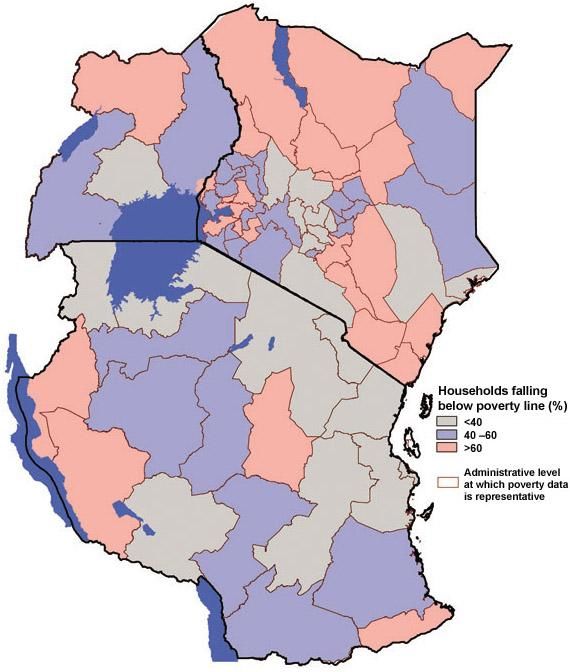
17) Given the size of wealth held in the form of livestock, it is frustrating that poverty is so widespread in
livestock keeping areas (including agro-pastoral and pastoral areas with large livestock numbers). In
Tanzania, for example, agro-pastoral and pastoral areas account for 95% of the cattle population, yet
most agro-pastoral and pastoral households live below the poverty line of US$ 1 per day (Mdoe et al.,
1998). Figure 4 presents a summary of the extensive assessment of poverty in East Africa, conducted
by ILRI. The assessment found out that areas with the highest incidences of poverty in East Africa are
those where livestock raising is the main agricultural activity without a major cash crop.
Kilimo Trust: regional solutions to local problems Page 6Figure 4: Poverty in East Africa – Uganda, Tanzania and Kenya. After Thornton et al. 2002
2.2 Livestock and Reduction of Poverty in East Africa: the market opportunities
2.2.1 Estimated demand and supply gaps in the East African Market
18) Figure 5 presents broad brush projected demand and supply differences by 2010 for meat and milk, in
each country and the region. These projections provide an important scenario and justification for
promotion of regional trade.
Kilimo Trust: regional solutions to local problems Page 71,600 a) Meat 7b) Raw Milk
Thousands
Millions
1,400 6
5
Milk in MT
1,200
4
1,000
Meat in MT
3
800 Demand
2
Demand 1 Production
600
Production
-
400
C
a
da
ia
a
EA
ny
d
an
an
an
200
Ke
nz
Ug
Rw
Ta
n d+
-
ru
Bu
C
a
da
a
a
EA
ny
i
d
an
an
an
Ke
nz
Ug
w
Ta
+R
ndi
ru
Bu
Figure 5: An estimate of demand and supply of meat and raw milk in the EAC region
Source: Tables 1 and 2 for production, AU-IBAR and NEPAD (2006) for demand in Kenya and demand in
other counties projected using current population and per capita consumption of meat and milk.
19) Regional level: Projections based on the current levels of per capita consumption of meat and milk
(which are significantly lower than the recommended levels of FAO of 50 kg of meat and 200 litres of
milk per year) shown that the region as a whole has a net deficit of both meat and milk products
(Figure 5). This deficit is likely to widen with increase in per capita consumption that may result from
improved incomes, urbanization and the initiatives currently being taken to promote consumption of
livestock products.
20) Burundi and Rwanda: Figure 5 shows that Burundi and Rwanda will continue to have deficit in both
meat and milk products confirming national statistics which show that Burundi and Rwanda have a
deficit of almost all livestock products. For example, because of dependency on imports, Burundi
experienced a serious shortage of chickens and chicken products (eggs/meat) after the flights into the
country from Europe were suspended during the period of civil war.
21) Like Burundi, Rwanda is generally a net importer of livestock and livestock products as national
demand for most livestock products outstrip domestic supply. According to Rwanda’s Ministry of
Agriculture and Animal Resources (MINAGRI) data, the unmet demand is more than 60%. The gap
between demand and supply is filled by imports from other countries within the region and outside the
region. For example, 10,958 metric tons of meat were imported in 2004 alone, with a total of 28,813
MT imported between 2000 and 2004. In the case of milk, local production of 121,137 metric tons in
2004 was able to cover only 41% of the demand estimated at 483,693 metric tons. The balance was
furnished through imports from Uganda and overseas countries in the form of powder milk. About
720,000 litres of milk were imported in 2005 compared with 2,930,000 litres imported in 1991
(MINAGRI).
22) Kenya: Figure 5 shows that Kenya will continue to register a deficit in meat, and will continue to
produce a surplus of milk and milk products. Currently Kenya exports milk and milk products to
almost all other countries in the region.
23) Tanzania: Figure 5 indicates that Tanzania will have a deficit of both meat and dairy products by the
year 2010 with the deficit of milk being significantly higher than meat deficit. National statistics show
that Tanzania is a net importer of dairy products as evidenced by different types of imported dairy
products being sold in supermarkets and shops in urban areas.
Kilimo Trust: regional solutions to local problems Page 824) Uganda: National statistics indicate that Uganda is a net importer of meat. Projections for 2010 as
shown in Figure 5 indicate that the country will continue to have a deficit of both meat and milk.
25) The above evidences suggest that there are still opportunities for expanded trade in livestock and
livestock products within each country and between the countries in the region. It is expected that
demand will continue to increase because of continuing positive trends in the most important factors
that influence demand:
a) Income and urbanization: most of the demand for livestock products arise from urbanization and
increase in income in urban areas. In this new and expanding market for livestock products, apart
from livestock products consumed in urban households there is higher consumption of livestock
products away from home in hotels, restaurants and fast food food businesses.
b) Supermarket culture: an important aspect of urbanization is trade through supermarkets which
offer opportunities for increased trade in high quality livestock products. Supermarkets are
spreading rapidly in the region and have registered significant presence in major cities and are now
spreading into smaller towns.
c) Tourism: The increasing trend in the number of tourists offers an opportunity for expanded
internal trade through increased consumption of livestock in hotels and restaurants. For example
the number of tourists who visited Kenya and Tanzania in 2006 was 1.7 million and 0.75 million,
respectively. This number was expected to double by 2012 (htt://www.africa news.com).
2.2.2 Opportunities for export beyond the EAC
26) There is great potential for the EA region to export livestock and livestock products to the Middle East
and North Africa (Figure 1a). The market for live animals and meat in this market is estimated to be
6,377,776 MT equivalent per year (estimated using 2006 population figure of 311,111,026 and per
capita consumption of 20.5 kg per year). According to AU-IBAR (2006) if all exports from SSA to
external markets for the different meat types, were exported to the Middle East, they would only meet
48.5% of beef and veal meat, 21.6% of goat meat, 3.4% of fresh sheep meat and 1.9% of mutton and
lamb demand. This implies that there is high export potential for meat from EAC in the Middle East.
At the moment the main African players in this market are Ethiopia, Somalia and Sudan, who mainly
deal in live animals. Therefore, the Middle East is a potential meat market for the EAC member
states, but this market has hardly been exploited.
27) Currently, the Middle East countries are sourcing meat imports from the European Union, Australia,
New Zealand, Argentina and Brazil, all countries can meet the stringent requirement for food safety,
because of their superior disease control systems. The current standards governing international trade
in livestock trade are extremely difficult to implement as they are based on geographical origin of the
product, which demand expensive investments in creating, maintaining and certifying disease free
zones. There are proposals to adopt a “commodity-based approach”, which will make it easier for
African countries to compete. Since most of the meat from EAC is produced on natural rangelands,
there is an increasing opportunity in the demand for products from “animals that have not been fed
with ruminant meat and bone meal and were not treated with growth factors”. Southern African
countries such as South Africa, Namibia, Botswana, and Swaziland are already exploiting this
opportunity due to well developed meat processing facilities and certified as of export standard.
28) There are also other countries in SSA with a demand for livestock and livestock products that the EAC
can exploit. For example, Kenyan dairy products are currently being exported to Zambia and
Democratic Republic of Congo and these countries have the potential of importing more dairy
products. Demand for dairy products is also high in North and West African countries which currently
depend on dairy imports from the EU.
Kilimo Trust: regional solutions to local problems Page 92.3 On-going Trade in the East Africa Region
2.3.1 Meat Products
Beef cattle and beef
29) Substantial unofficial cross border trade of cattle is reported to take place between the EA countries.
Kenya imports about 25-30% of its beef cattle through unofficial movement of cattle from
neighbouring countries. In Tanzania, Ministry of Livestock Development statistics show that among
the EA countries, Kenya is the main trading partner in live cattle traded informally. It is estimated that
300,000 heads of cattle cross the Tanzania border every year to neighbouring countries (Ministry of
Livestock Development, 2006). Official exports of cattle from Tanzania to Comoro and Burundi in
2006/07 totalled 2,542 cattle heads compared to 1,706 cattle heads in 2005/2006 (Ministry of
Livestock Development, 2007).
30) In addition to export of live animals, there is export meat from the region. Unfortunately there is
paucity of information on external trade of meat. The available information for three countries
indicates the region exported insignificant quantities of beef and small ruminant meat relative to the
livestock resource in the region.
Table 3: Export of meat (MT) from EA countries
Country Year
1980 1990 2000 2002
Beef Ovine* Beef Ovine Beef Ovine Beef Ovine
Tanzania 223 1 4,300 0 26 72 1 53
Uganda 0 0 0 0 0 0 0 3
Kenya 1,001 27 1,828 102 57 28 118 11
Total 1,224 28 6,128 102 83 100 119 67
*Ovine is goat and sheep
Source: FAO (2005)
Small ruminant meat
31) Internal trade of small ruminants especially in rural areas is mainly informal between households that
raise them and those which do not keep small ruminants. Animals are also traded for the urban and
export markets. Like cattle, live small ruminants trade taking place between the EA countries is largely
informal cross border trade and data are not available. Available data on exports from the EA
countries show that Kenya and Tanzania export goats beyond the EA region. In Kenya, LTMS-K
exported 8,200 goats to Mauritius. In Tanzania, official exports of live goats to Comoro and Burundi
in 2006/07 totalled 1,852 goats valued at TShs 1.03 billion compared to 800 goats valued at Tshs 675.9
million in 2005/2006. Exports of small ruminant meat from the East African countries are small
(Table 3).
Poultry and poultry products
32) Countries in East Africa with inadequate hatcheries import day old chicks from other member states.
For example, Rwanda with one hatchery with a capacity of producing about 20,000 chicks, imports
day old chicks from Uganda, Belgium and France. Uganda imports about 20,000 day-old-chicks
from Kenya every week. Tanzania has 13 hatcheries producing about 1.7 million chicks every three
weeks but imports day old chicks mainly from Zambia while Burundi imports day old chicks from
Uganda. Stakeholders are of the view that the problem of inadequate supply of day old chicks can be
solved by promoting trade within the East African region as is the recent practice of importing day old
chicks to Tanzania from Uganda. However, they say that the long term solution is to establish parent
and grand parent stock farms in these countries. The implementation of the above solution is being
Kilimo Trust: regional solutions to local problems Page 10held back by lack of funds and harmonized veterinary and trade regulations in the East African
countries (The East African August, 2008)
33) In some EA countries substantial chicken bird trade takes place on the road side. In all the five East
African countries, 60% of the local chicken trade is in the hands of small traders. Eggs from indigenous
poultry are traded by small traders mainly in rural areas where most of the production takes place and
involves both small traders and wholesale traders. Beside internal trade in each EA country, there has
been substantial trade in poultry meat between the EA countries but the trade was hampered by the
outbreak of Bird Flu in South East Asia in 2006. For example, Uganda was exporting poultry and
poultry products to Kenya before a ban imposed by Kenya on Ugandan poultry and poultry products
following the Bird Flu scare. The ban was lifted in September 2008 but trade had not resumed. There
is also trade of poultry meat between Uganda and Rwanda with Uganda exporting poultry to Rwanda
although available official statistics from FAO do not capture this (Table 4).
Table 4: Export of poultry products from EA countries
Country Year
1980 1990 2000 2002
Poultry meat (MT):
Tanzania 2 0 182 0
Uganda 0 0 0 2
Kenya 58 14 5 6
Total 60 14 187 8
Eggs (MT):
Tanzania 0 0 4 0
Uganda 0 0 0 0
Kenya 69 21 30 31
Total 69 21 34 31
Source: FAO (2005)
Live pigs and pig meat
34) Small traders dominate the trade of live pigs in the EA region, with pig meat mostly consumed in
urban areas. The trade in live pigs takes place between small producers in rural areas and wholesale
traders who sell them to buyers in urban areas. For pig meat, most of it is traded through wholesalers
who supply pork to retailers such as pork butchers, supermarkets and hotels especially tourist hotels.
In terms of exports, available statistics show that Kenya exports significantly more pork and pork
products than her counterparts in the region (Table 5).
Table 5: Export of pig meat (MT) from EA countries
Country Year
1980 1990 2000 2002
Tanzania 0 0 53 44
Uganda 0 0 15 0
Kenya 356 37 605 508
Total 356 37 673 552
Source: FAO (2005)
Dairy cattle and dairy products
35) Two types of trade of dairy cattle take place in the region. There is trade between individual
smallholder dairy farmers, and between livestock multiplication units and medium/large scale dairy
producers and smallholder dairy producers. The second type is culled dairy cows trade for meat
between dairy producers and meat traders. Apart from internal trade in dairy cattle, there is informal
Kilimo Trust: regional solutions to local problems Page 11and formal trade in dairy cattle between the EA countries particularly for breeding stock. Raw milk is
the predominant internally traded dairy product in each of the EA countries. For example, much of
the milk marketed in the Dar es Salaam milk shed is either unprocessed or informally processed liquid
milk. Raw fresh milk constitutes the most traded item followed by fresh boiled warm and cool milk. In
Kenya, Uganda, and Tanzania for example, pasteurised milk which passes through the formal sector
accounts for only an estimated 20%, 10%, and 2% of the internally traded milk in each country,
respectively (MAAIF/NARO/ILRI, 1996; MOAC/SUA/ILRI, 1998; MOA/KARI/ILRI, 1998; Mbiha,
2008). In Rwanda, only 23% of the milk produced in the country is traded on local markets and the
rest consumed by dairy producing households. Overall, small traders account for most (80%) of the
milk and milk products traded in the EA region.
36) Kenya is the only country with a well developed dairy industry that produces milk that meets its
domestic consumption and with surplus for export. All the remaining countries in the EA region are
net importers of milk and milk products. Kenyan dairy products are currently being exported to all
other EAC members’ states (Burundi, Rwanda, Tanzania and Uganda). In addition, Kenya exports
milk products to Zambia, Democratic Republic of Congo and Saudi Arabia. Table 6 shows the
quantities of dairy products exported from three countries in the region with Kenya accounting for the
largest share of the exports. At the moment, New Kenya Co-operative Creameries and Brookside
Dairies are the two main exporters. However, Kenya also imports dairy products from the European
Union and limited amounts from within the East African region.
Table 6: Export of dairy products (MT) from EA countries
Country Year
1980 1990 2000 2002
Tanzania 453 0 2422 135
Uganda 0 0 996 161
Kenya 2,378 4,725 2,844 1,887
Total 2,831 4,725 6,262 2,183
Source: FAO (2005)
Hides and skins
37) Most of the hides and skins from rural slaughter slabs/butchers, slaughter houses and abattoirs pass
through wholesale agents. The rest are collected by small traders and then sold to wholesalers/tanners
for processing/export (See export volumes in Table 7). Apart from internal trade in unprocessed hides
and skins, there is a substantial informal cross border trade between the EA countries. Official statistics
show that on average more than 50% of the hides and skins are exported in unprocessed form. This
proportion varies across the EA countries. For example, exports of unprocessed hides and skins in
Kenya represent 40-50% of total production while in Tanzania and Uganda exports of unprocessed
hides and skins represent about 80% of total production.
38) Semi processed wet blue leather forms relatively larger proportion (60%) of the processed hides and
skins products. However, this proportion varies across the region. For example, most (90%) of the
processed leather in Tanzania is wet blue leather while in Kenya wet blue leather account for about
48% of the processed leather.
Table 7: Exports of Hides and Skins/leather from East Africa, 2000-2005
Country Year
2000 2001 2002 2003 2004 2005
Tanzaniaa) 7,117 17,784 20,100 25,583 25,786 26,749
b)
Kenya 13,470 13,877 11,515 18,808 27,186 -
c)
Uganda 13,015 - 12,857 - - -
Total 33,602 31,661 44,472 44,391 52,972 26,749
Kilimo Trust: regional solutions to local problems Page 12Source: a) United Republic of Tanzania (2006), b) AU-IBAR and NEPAD(2006), c) FAO (2005)
39) In general most (80%) of the leather produced in the EA region is consumed abroad with only about
20% consumed locally. For individual countries the actual consumption varies across the region. In
Tanzania, for example, less than 10% of the locally produced leather is used to make leather products
for local consumption. Kenya used to utilize a substantial proportion of locally processed leather for
making leather products such as shoes but the proportion of locally produced leather utilized locally
has declined due to the collapse of the leather industry including poor performance of the famous
Bata Factory (Kenyan shoe manufacturing company).
Kilimo Trust: regional solutions to local problems Page 133 LIVESTOCK VALUE CHAINS AND KEY ACTORS IN THE EAC REGION
3.1 Overview
40) A value chain is a sequence of target-oriented combination of specific actions in order to create a
marketable product or service for final consumption by a specific client. It is the process of moving
products from the point of production to the point of consumption. Therefore, the producers and
consumers are key actors in these chains. However, in between these two actors, there are tens of
individuals, groups, businesses and other actors, each making an input in moving and converting the
product on its way to the consumer. There are transporters, processors, wholesalers and retails. There
are also institutions that support this process, such as suppliers of input, finance and information
services, and public sector regulators who sets and enforce rules and regulations. Figure 6 provides a
simplified schematic presentation of a typical agricultural value chain. Most of these also apply to the
livestock sector. This model is used to describe the characteristics and actors in the value chains of the
major livestock sub-sectors in the EAC region. Schematic presentations of specific livestock value
chains are shown in Appendix 2.
_________________________________________________________________________________
PROCESSING
PRODUCTION BULKING WHOLESALE RETAIL CONSUMPTION
TRANSPORTATION STORAGE TRANSPORTATION
INPUTS SUPPLY PROVISION
OF
SERVICES
KEY INSTITUTIONS
Figure 6: Schematic presentation of typical livestock value chain
_________________________________________________________________________________
3.2 Meat Value Chain
41) The main meat value chains in East Africa, for all types of meat are summarized in this section. All the
major components of a value chain shown in Figure 6 are important in the supply and consumption of
meat in East Africa.
Kilimo Trust: regional solutions to local problems Page 143.2.1 Production
42) The primary production of beef cattle is dominated by pastoralists and agro-pastoralists mostly located
in arid and semi-arid areas. Ranches and fattening farms account for very small proportion of the beef
cattle in the region and most of the ranches are owned by governments. Private ranchers and beef
cattle fatteners are few and are just emerging. Similarly, the primary production of small ruminants for
meat is dominated by pastoralists and agro-pastoralists. However, the number of households keeping
small ruminants in the various production systems is slightly less than those keeping beef cattle. In
Tanzania for example, 37% of the agricultural households raise cattle compared to 30% reported to
raise small ruminants for meat. The main characteristics of actors in the production component are:
a) Pastoralists/ Agro-pastoralists: It is estimated that there are about 3,863,964
pastoralist/agropastoralist households in East Africa accounting for about 93-95% and 99% of the
beef cattle and small ruminants, respectively. They are mainly located in arid and semi-arid areas
such as the Masai steppe (Tanzania), Karamajong(Uganda) and Arid and Semi Arid Lands of
Northern Kenya.
b) Ranchers and fattening farms: Private and public commercial ranches and fattening farms total
about 682 in the region and account for 5-7 % and 1 % of the beef cattle and small ruminants,
respectively. The most important of these include:
i) In Kenya –Olpejata ranch, Loisaka ranch, Sosian ranch, El Karama ranch and Sale ranch.
ii) In Tanzania – NARCO ranches, SAAF ranch, Tanzania Meat Pride ranch and Manyara ranch.
iii) In Uganda – Nakitima ranch, Ndorokwai ranch, and 434 hectares developed and leased to
private investors in ranching.
43) There are no ranches in Burundi and Rwanda. In Rwanda, there are initiatives to establish ranches in
the near future.
44) Despite the large cattle population in the pastoral and agro-pastoral systems, the annual off take rate of
8-10% is lower than annual off take rate of about 12-15% in commercial ranches. Moreover, cattle in
the pastoral and agro-pastoral systems are slaughtered at the age of 6-7 years with mature weight of 200-
300 kg compared with slaughter age of 2-3 year with mature weight of 350-400 kg in commercial
ranches.
45) Majority of poultry (mainly chicken) is indigenous produced by smallholders, and it is estimated that
70% of households in the rural areas raise some sort of poultry. The production of exotic poultry
(mainly broiler chicken) is done by medium and large scale producers. These producers supply about
30% of the poultry meat in the region. They include:
a) In Burundi – NASA Poultry Farm
b) In Kenya – KenChick Limited which is the largest poultry farm in East Africa. Others are Alpha
Fine Foods Ltd, Unga Feeds Ltd, and Meat Processors Ltd.
c) In Rwanda – Kanombe Poultry Cooperative Farm and Kinyinya Poultry Farm
d) In Tanzania – A to Z farm; Interchick, Ideal chick,Tanzania Poultry Farms and Mkuza chicks
e) In Uganda – Ugachick Farm and Binyizika Enterprises Farms.
46) About 65% of pig production is carried out by smallholders using traditional methods. Commercial pig
farmers are very few in the region, but this is increasingly becoming important in peri-urban areas. In
the traditional pig production system, pigs are mainly fed on forages and supplemented with food
leftovers and rarely with concentrates. They are sometimes left to free range rather than being stall fed.
On the other hand, commercial pig producers obtain feed supplies from feed shops and directly from
feed millers.
3.2.2 Bulking
47) Bulking of live animals normally occurs in rural livestock markets organized about twice per week.
Individual producers bring the livestock they want to sell to these markets where traders who bulk
assemble and normally buy through an auction. The buyers include traders who then transport the
Kilimo Trust: regional solutions to local problems Page 15You can also read