LIVING ON THE EDGE Why crime and anti-social behaviour is leaving rural communities and businesses frustrated, undervalued and isolated ...
←
→
Page content transcription
If your browser does not render page correctly, please read the page content below
LIVING ON THE EDGE
Why crime and anti-social behaviour is
leaving rural communities and businesses
frustrated, undervalued and isolated.
Report & Recommendations from the
2018 National Rural Crime Survey

                          nationalruralcrimenetwork.net
National Rural Crime Survey 2018

Contents
Foreword                                                                   page 4

Executive Summary                                                          page 5

About the National Rural Crime Survey                                      page 6

About the National Rural Crime Network                                     page 7

Key Findings                                                               page 8

Recommendations                                                           page 12

NATIONAL RURAL CRIME SURVEY – THE RESEARCH

Approach                                                                  page 16

The Impact of Crime and Disorder on Victims                               page 21

The Impact of Crime and Disorder on the Wider Community                   page 38

A Broader View of Rural Crime and Disorder                                page 45

Perceptions of Policing in Rural Areas                                    page 49

Community Cohesion                                                        page 56

A Review of Security Measures                                             page 59

Other Business Related Issues                                             page 62

Appendix

                                                                                 3
                                                      nationalruralcrimenetwork.net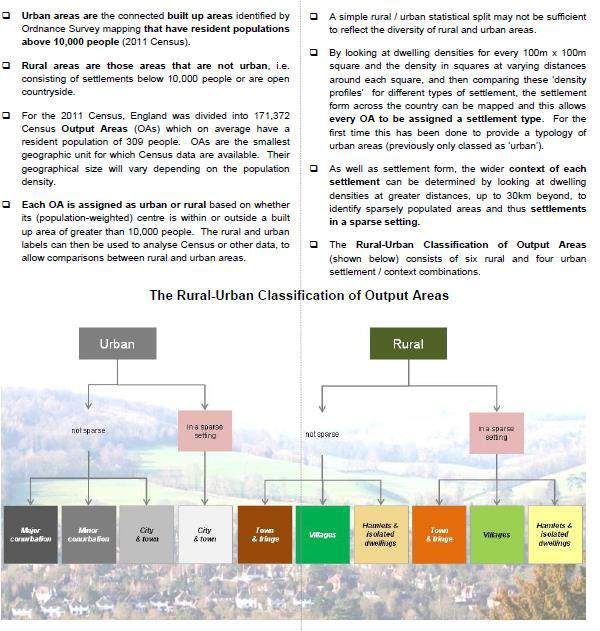
National Rural Crime Survey 2018

Foreword

Julia Mulligan
Chair, National Rural Crime Network
Police and Crime Commissioner, North Yorkshire

Almost three years ago, we published the                                    crime compete with its urban counterpart
report for the first National Rural Crime                                   when assessed against the police’s narrow
Survey - the largest survey of rural residents                              definition of ‘threat, risk and harm’, but this
and businesses ever undertaken. Now, we                                     constant prioritisation of ‘urban’ issues has
have gone further, engaging over 20,000                                     had very real consequences.
people and businesses in the 2018 survey.
                                                                            Crime is up. Anger is up. Frustration is up.
The results are no less stark, and raise                                    Trust is down. Those rating the police as
important concerns about rural policing,                                    good is down. And with 10.3 million people
where there could be said to be a wholesale                                 living in rural areas1 - these are trends we
loss of trust. Nationally, concerns about                                   can no longer ignore.
policing and its resources are growing, but
this is not another report about reducing                                   Every decision affecting national policing
resources. This survey instead demonstrates                                 moving forwards, from funding to safety and
that rural communities are being left behind,                               security, has to be set against the findings of
far and above of their urban counterparts,                                  this report. This report needs to be listened
and it also shows that what rural                                           to in the future when decisions on funding
communities need is very different to urban                                 are being made, we can no longer continue
communities                                                                 to see funding being sucked from rural areas
                                                                            to urban. It simply isn’t good enough and
I do not doubt the effort some police                                       politicians need to sit up and listen.
services have put into turning this tide, but if
nothing more, this report demonstrates the                                  I will continue to fight for rural communities,
sheer scale of the problem being faced.                                     who should not have to put up with
There are new developments too, not least                                   sub-standard services just because of where
growing anger and frustration, the increasing                               they live. This simply cannot be tolerated.
blight of fly-tipping and the overlooked                                    Despite the passionate and professional
impact of organised crime in rural areas.                                   police officers working incredibly hard day-
                                                                            in, day-out, them and the communities they
The ramifications of this valuable feedback                                 serve are being let down because priorities
from our rural communities goes much                                        lie elsewhere.
further than specific policing matters which
require further attention. Whilst those issues                              The results of the National Rural Crime
unquestionably need attention, there is a                                   Survey, and the wider feedback from rural
fundamental mismatch between the                                            communities, should not be underestimated.
expectations of rural people and the service                                It is incumbent on policing, partners and on
being delivered by policing. Rarely can rural                               government and us all to listen, and to act.

1
    Small Area Population Estimates 2013, Office for National Statistics.
    © Crown Copyright 2016.

                                                                                                                              4
                                                                                           nationalruralcrimenetwork.net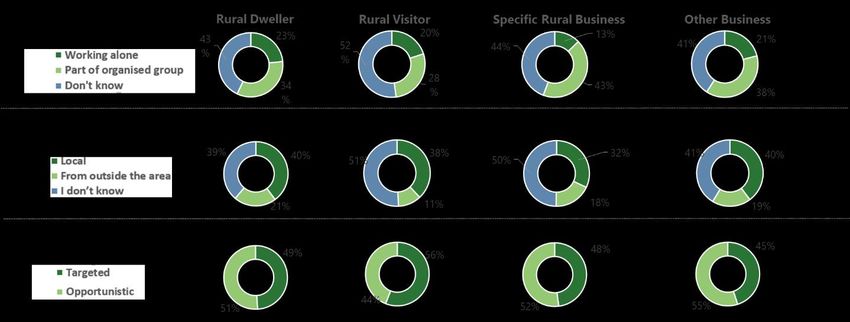
Executive Summary
Rural communities and businesses often           number of unique and often hidden
feel like they are living on the edge –          challenges which we fail to understand at our
geographically isolated, remote from             peril. The more questions we ask, the more
services those in urban areas take for           we see out shortcomings, not least busting
granted, but more importantly, frustrated        the myth that rural areas are ‘safe’.
at the way crime, deprivation and
vulnerability is hidden by a picture             To change that common view and get the
postcard view of the countryside.                recognition of the challenges that are faced,
                                                 we need evidence. Policy makers and
The National Rural Crime Network was             operational leaders will only be forced to act
formed in 2014 to bring greater recognition      if we are able to show that beyond that
and understanding of impact and problems         picture postcard view there are unique and
of crime in rural areas with a simple aim – to   serious challenges we need to address, not
support measures that kept people safe and       least the hidden vulnerability that is now so
made them feel safe too.                         well understood in urban areas.

It brings together 30 Police and Crime           Those of us who live and work in the
Commissioners from across the country,           countryside know these challenges exist, and
supported by a wide range of other bodies        this survey illustrates that beyond doubt.
with a deep interest in community safety and
rural affairs. Together, these members and       From the perception of police forces who are
supporters represent millions of people and      too remote and distant from people’s lives,
as such the Network is uniquely placed to        to the view that it is simply not worth
champion the needs of rural communities.         reporting crimes because they will not be
                                                 investigated.
We need to change the common view of
what rural communities look like. Yes, there     From the frustration and anger that a fear of
are picture postcard scenes with stunning        crime is having a detrimental impact on
scenery and, yes, there are many extremely       residents’ quality of life, to the real risk that
isolated homes and businesses, but there         rural businesses will not invest in the
are also large numbers of families and           countryside because of the threat that they
individuals of all ages and all social           will become a victim.
backgrounds living in all sorts of
homes and working in all sorts of                This survey, with its 20,000 plus responses,
businesses.                                      tells a real and compelling story of a
                                                 significant part of England and Wales living
Far from being the polar opposite of urban       on the edge – on the periphery, feeling
areas, there are many similarities in rural      ignored, unmistakeably isolated and
communities – a diversity of people with a       vulnerable. It is time to give those who live
range of important and competing issues.         and work in our countryside the support they
There are the obvious – of sparsity, of          need. It is time for those in positions of
geography and of infrastructure. But more        authority to sit up and take notice. It is time
than that, rural communities face a huge         for rural communities to be listened to.

                                                                                                     5
                                                                nationalruralcrimenetwork.net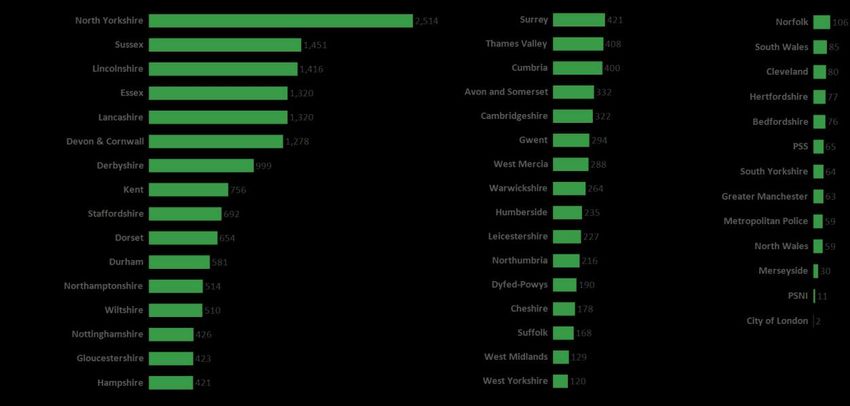
National Rural Crime Survey 2018

About the National Rural Crime Survey
In 2015, the National Rural Crime Network         main analysis of the data was confined to
undertook what is thought to be the largest       respondents who lived in an officially
rural policing survey ever undertaken. 13,193     recognised rural area as defined by the
people from rural areas, as defined by the        Office of National Statistics (ONS) Output
Office of National Statistics, took part then.    Areas 2011.

Three years on, we carried out another            The scale of the response was significant. In
survey to identify any changes since the last     total 20,252 responses were received from
survey, progress made towards the issues          across England, Wales and Northern Ireland.
which those who live or work in rural             We believe this in itself is testimony to the
communities told us were important in 2015        interest and concern amongst our rural
and determine the true personal, social and       population to the impact of crime.
economic cost of rural crime and anti-social
behaviour.
                                                  Full details on the methodology of the
The survey was open to those that live, own       National Rural Crime Survey can be found
a business or regularly visit a rural area. The   later in this report.

                                                                                                  6
                                                                nationalruralcrimenetwork.net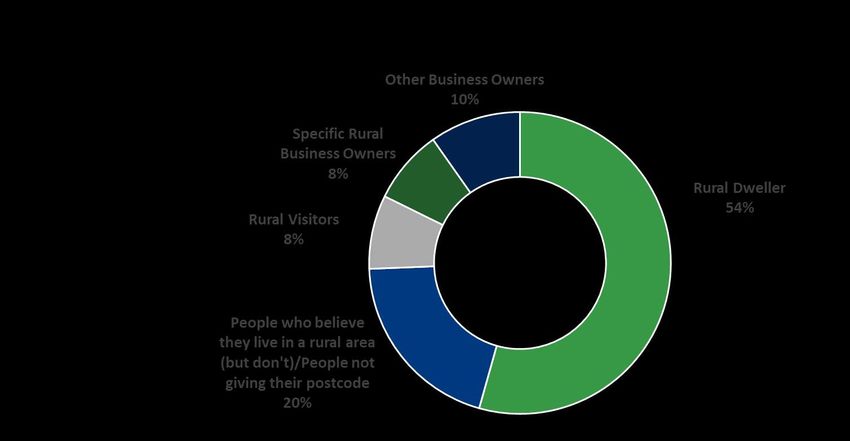
About the National Rural Crime Network
The National Rural Crime Network is                England and Wales. In addition to PCCs
working to see greater recognition and             and the police, the Network is supported
understanding of the problems and impact           by a wide range of other bodies with a
of crime in rural areas so more can be             deep interest in community safety and
done to keep people safe and make them             rural affairs.
feel safe too.
                                                   Together, these members and supporters
Established in July 2014, the Network is           represent millions of people and as such the
supported by 30 Police and Crime                   Network is uniquely placed to champion the
Commissioners and police forces across             needs of rural communities.

Our Vision

A thriving rural community – all those who live, work or enjoy the countryside
– that feels safe, understood and is secure.

Our Mission

Based on an in depth understanding of the needs, concerns and threats
to rural communities, make substantive policy and practice improvements

Our Objectives

1.   Give rural communities a voice

2.   Act as a multi-agency think tank on rural policing and criminal justice policy and
     practice, to ensure the needs of rural communities and victims are better served
     nationally and locally

3.   Protect the rural economy by influencing and improving policy regarding rural policing
     and community safety, actively seeking to change legislation where necessary

4.   Become a central hub for practitioners, encouraging national and regional outlets for
     discussions on rural crime issues between relevant rural partners, watch groups and
     appropriate national organisations, proactively sharing best practice

5.   Increase reporting of rural crime and wider community safety issues

                                                                                                  7
                                                                nationalruralcrimenetwork.net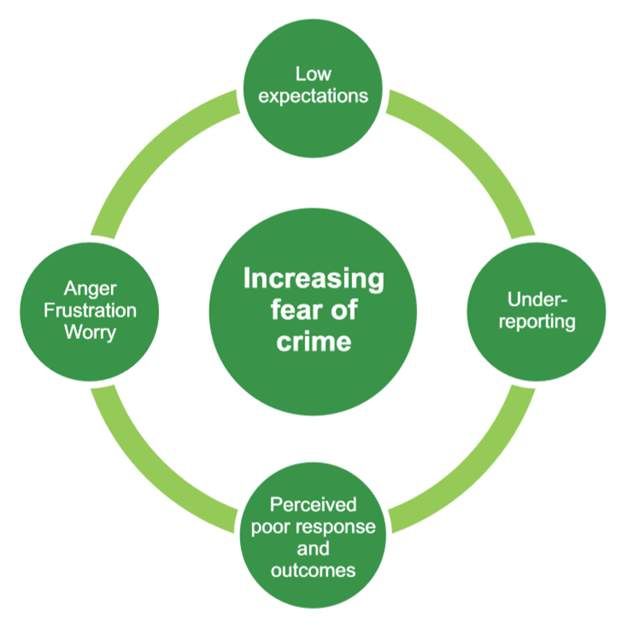
National Rural Crime Survey 2018

Key Findings
 1                                                 concerns with 57% seeing evidence of fly-
                                                   tipping and 32% evidence of speeding in
The perception of policing in rural                their communities in the last 12 months.
communities is poor, and much worse                Compared to 2015, the proportion of those
than in urban areas                                mentioning fly-tipping has risen 6% but the
                                                   proportion who mention speeding is down
The proportion of people who think their           21%.
local police do a good job is 11% lower than
in 2015 (27% net good). This is dramatically       Both of these issues are clearly important for
lower than the national figure from the            rural communities, but they share a
Crime Survey of England and Wales which            characteristic of not solely being policing
finds 62% of respondents rate the police in        issues with responsibility shared among local
their area as good or excellent.2 Similarly, the   authorities and other agencies, such as the
proportion who would rate their local police       Environment Agency. While most
as being good or excellent at crime                respondents know, for example, that councils
prevention and reduction is also 11% lower         are responsible for fly-tipping, there is a clear
than in 2015.                                      view that not enough is being done and that
                                                   councils can no longer cope given their
We can be very clear that this is not just         financial constraints.
about fewer resources as, while the
perception of policing performance is
getting worse across every force featured in        3
this survey, there are significant differences     Crime is not just an inconvenience - crime,
in the level of this fall. We believe this         and the fear of crime, is leading to
indicates that there are positive steps being      emotional strain and a loss of confidence
taken to address the challenges in some            within rural communities, particularly
areas and there is best practice that must be      among young people, families and
shared so all forces can work to improve the       farmers
perception of their performance among rural
communities.                                       This survey busts the myths about who we
                                                   tend to think of as vulnerable when we think
                                                   of rural crime and shows that farmers, young

 2                                                 people and hard working families are the
                                                   most affected and feeling the most
Some of the most common concerns are               vulnerable. A third of rural people believe
not solely policing matters, like fly-             that crime has a moderate or great impact
tipping and speeding – too many                    on their lives, with specific rural business
partners, like local authorities, are less         owners – like farmers – most in fear of
able to respond to the needs of rural              becoming a victim of crime. Fear of crime
communities                                        is highest amongst those in lower
                                                   socio-economic groups and the family life
Fly-tipping and speeding dominate the list of      stage, as well as younger people and women.

                                                                                                  8
                                                                 nationalruralcrimenetwork.net
Significantly, and concerningly, one in ten      appears to be because they do not feel the
rural people are feeling unsafe in their own     police and criminal justice system
homes after dark. The emotional impact of        understand the issues or do anything about
crime in rural areas often doesn’t just          them.
disappear within a few weeks but there is an
emotional legacy of frustration, anger and       There is also a cumulative impact and,
disgust, particularly for rural business         because what some would see as minor
owners. Beyond that, fear is the legacy for a    offences are not taken seriously, it opens the
significant number of victims, whether           potential for more serious crimes to be
general population or business victims.          committed in the future.

 4                                               In 2015 we reported of a damaging cycle in
                                                 rural communities whereby underreporting,
Communities believe crime in rural areas         fuelled by a lack of confidence in policing,
is a big problem – and is getting worse          means rural crime is underestimated officially
                                                 then is not prioritised, leading to perceptions
Not everyone in rural communities is             of poor response, which in turn discourages
affected personally by crime or anti-social      reporting, and so the cycle starts again. This
behaviour but most (around three quarters)       survey shows this cycle is still very much in
are aware of criminal activity that is           operation. It needs to be broken.
happening; whether through friends and
family, general hearsay or through seeing the
evidence of criminal activity around them. All
of this (alongside the influence of the media)
feeds into people’s perceptions of crime and
feelings of safety.

 5
Many crimes in rural communities go
unreported – especially by business
owners, because they don’t feel the
offence will be taken seriously or
anything will be done

Around one third of crimes against our
survey participants go unreported to the
police – and that figure is rising. Compared
to 2015, figures for non-reporting have
increased by a third for rural dwellers and
two-thirds for businesses. The reasons for
this are complex – but the root cause

                                                                                               9
                                                               nationalruralcrimenetwork.net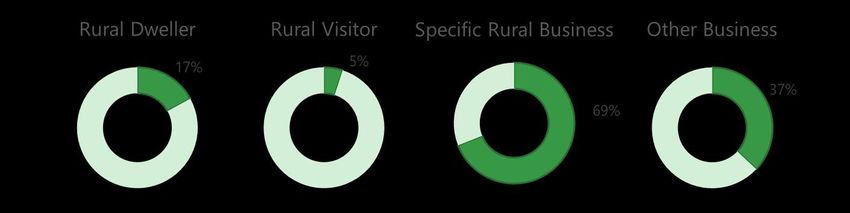
6                                                  8
Residents and businesses in rural                  The financial impact of crime is
communities believe they are being                 substantial – for residents and,
specifically targeted – and, on balance,           particularly, for businesses who are the
most believe the crime is organised                lifeblood of the rural economy

On balance, the perception is that most            The financial strain of crime is significant –
perpetrators of crime are part of an               the average financial impact of crime on
organised group, i.e. that they are not            rural business owners is £4,800, 13% up on
working alone. This is particularly the case       2015. It is not just the cost of replacement
for farms and specific rural business owners       that has to be considered here but repairs,
who we know are feeling increasingly               loss of earnings and upgrading of security.
victimised by organised crime gangs.               Around 40 – 50% of all victims – whether
However, contrary to anecdotal evidence the        residential or business - incur some kind of
perception is that the criminals are more          financial cost. Despite this, claims against
likely local than from outside of the area.        insurance are low at around one quarter. The
What is not clear is what is perceived as          costs of fly-tipping are particularly stark, the
local, for example criminals crossing county       average financial impact to the business
lines may still be local. The perception is that   owner was over £1,000 a time. A clear up bill
victims have been specifically targeted by the     that falls to the business owner alone.
perpetrator and this feeling of being
targeted increases the more remote the
victim is in terms of geographical location.        9
                                                   Rural victims feel angry and annoyed that

 7                                                 they are not taken seriously by those in
                                                   positions of power – and the extent of
Farmers and agricultural businesses are            crime is making communities feel
facing huge challenges – and they don’t            vulnerable
feel there is enough being done to
support them                                       Rural communities are strong and there has
                                                   been no drop in the strength of community
Half of rural businesses, such as farmers and      cohesion over the past three years. What has
other agricultural businesses, told us that        increased is the levels of frustration and
crime has a moderate or great impact on            anger – it should never be assumed that
their lives – significantly above the figure for   rural crime is not as impactful as urban
rural residents (48% versus 30%). 60% are          crime, but the National Rural Crime Network
fairly or very worried about becoming a            believes rural crime is not taken as seriously
victim of crime (compared to 36% of rural          as urban crime and our research indicates
residents), and there are indications that         rural communities – whether through
worry has risen since the last survey.             perceptions of policing or the impact of
                                                   crime – share that view.

                                                                                                 10
                                                                 nationalruralcrimenetwork.net
10
Ultimately, rural communities are not
understood and services do not match
need – if nothing is done there is a risk of
a wholesale loss of trust in rural policing
Too often rural communities are considered
safe and prosperous places. This
preconception stops serious needs analysis
being done, and when the lid is lifted it is
clear rural people and businesses are
fundamentally misunderstood. The National
Rural Crime Network believes this is true of
many areas, not just crime and policing, and
further work needs to be done to assess
community safety and service provisions
policy across the board in a specifically rural
context.
2
Crime Survey of England and Wales year ending March 2017
(urban and rural combined).
11
nationalruralcrimenetwork.netNational Rural Crime Survey 2018
Recommendations
These key findings from the National working group comprising representatives
Rural Crime Survey lead the National from DEFRA, MHCLG, the Home Office and
Rural Crime Network to make the health should undertake analysis to
following recommendations: understand the needs of rural communities
in the round. Such an approach would
We need Chief Constables to change the ensure any new initiatives are designed with
policing of rural communities rural communities in mind. From a policing
perspective this should include funding and
Policing needs to urgently reassess the way specialist capabilities.
‘threat, risk and harm’ is understood and
used as the principle measure with which to We need to put more focus on farmers
decide how to respond to crime and and specific rural businesses
community safety. This approach is clearly
flawed given it has led to rural communities More must be done to engage and
feeling angry and frustrated at an industrial communicate with farmers and specific rural
scale. The National Police Chief’s Council businesses who are the lifeblood of our rural
and organisations such as the College of economy. Rural businesses are bearing the
Policing should reassess ‘threat, risk and brunt of crime, it is often targeted and
harm’ in light of this report, not least to carried out by organised groups, and
better understand the cumulative impact policing needs to provide action and
crimes can have on communities. reassurance to those specifically affected.
We need to do more to understand rural We need to work together on organised
crime and its impact crime
Policing and partner organisations have The National Police Chiefs’ Council should
made little to no progress in understanding work with the National Rural Crime Network
the needs of rural communities, and it shows. and other partners to undertake research
This has to change – be it locally or into the impact of organised crime in rural
nationally, the public sector has to work areas, and specifically the cumulative impact
better together to understand needs and of crimes which it is felt some in policing feel
demand, assess vulnerability and tailor are ‘less serious’, such as theft, fly-tipping
services to rural communities. and poaching.
We need to put that understanding into We need the criminal justice system to
practice understand rural communities
It needs to be the common view that rural
For too long, resources have been focused crime is repetitive and organised and has
on urban areas for convenience. This has significant and pervasive consequences.
impacted on rural communities. Government Training needs to be provided at all levels,
needs to recognise the impact that reducing including Magistrates and prosecutors. The
rural services is having on those that live and quantity and quality of the training provided
work in that environment and a concerted to those engaging with rural issues in the
effort is required to undo the disadvantage criminal justice system, especially
that has been created. A cross-departmental Magistrates, needs to be improved. Too
12
nationalruralcrimenetwork.netoften, the impact of the crimes are not Farmers Union and Crimestoppers, will help
understood and, therefore, overlooked – find ways which encourage reporting
including in regard to wildlife crimes where Communities and businesses have an
there are no direct human victims. One important role to play in this – we need to
specialist in each CPS region is not enough. encourage them to report offences but
authorities need to play their part too and
We need justice to be done and be seen to ensure communities feel it is worth it.
be done for rural communities
We need to do more to help rural
Government must urgently assess sentencing residents and businesses with crime
guidelines for crimes which predominantly prevention
impact on and take place in rural
communities, such as poaching, fly-tipping Rural financial services, insurers and the
and organised theft or burglary. Too often police need to do more to help rural people
the criminal justice system sees these as low- and businesses with effective crime
level crimes and does not recognise the prevention. The survey shows that there is
impact they have, the cumulative impact and good work being undertaken already and
the links to serious and organised crime. further work needs to be done to know and
Communities perceive hardened criminals to share which protections are most effective
be receiving miserly fines which they see as and for who, with support to then implement
‘the cost of doing business’. This needs to those security upgrades locally, particularly
change, the judiciary should understand the among young families and farmers. We
interconnected and serious nature of rural would encourage research to be undertaken
crime as being on a par with serious to help establish this – and will engage with
acquisitive crime and specific guidelines are the College of Policing to support this.
required that take into account key issues,
such as: We need to ensure victims of fly-tipping
are not left to pay the price of
others’ actions
• rural isolation as an aggravating factor
• the impact on a business of being Notwithstanding the emotional and practical
unable to operate due to theft of impacts of being a victim of fly-tipping, each
machinery occurrence of fly-tipping will cost the
• the cost of recovering kennelling costs business owner an average of £1,000 to clear
when incurred up. Moreover, with nearly 6 in 10 business
• greater understanding of the ‘means’ having been a victim of fly-tipping, the
of criminals, with too many being
likelihood of being a repeat victim and
assumed to have no means and
therefore receiving the lowest fines incurring repeated expense only adds to this
injustice. Once the DEFRA ‘serious and
We need to make reporting crimes easier organised crime in the waste sector in
England’ review is complete, we recommend
Noting the distrust and apathy around that a focused review of fly-tipping is
reporting, we need to develop new ways to undertaken. At the least, victims of fly-
report crime so that we properly understand tipping should not be charged after being a
the extent of rural crime and its impact. victim of crime, and the landfill tax should be
Working with partners, such as the National waived for those victims.
13
nationalruralcrimenetwork.netNational Rural Crime Survey 2018
The Research
The National Rural Crime Survey was conducted by
independent research company The Buzzz who present
their findings and conclusions on the following pages.
Thank you to the team at The Buzzz for their work .
15
nationalruralcrimenetwork.netApproach Methodology The questionnaire was developed in conjunction with the NRCN. Much of the questionnaire replicated the Rural Crime Survey of 2015 although a number of redundant questions were removed. Questions were also added to build our understanding of the impact of crime on the rural population. It was a self-completion questionnaire designed to be filled in online on PCs, tablets and smartphones i.e. it was not administered by an interviewer in the way that the Crime Survey of England and Wales (CSEW) is conducted. Two versions of the survey were made available; an English version and a Welsh Language version. Both versions were accessed via the National Rural Crime Network (NRCN) website. A Word copy of the questionnaire used can be found in Appendix 3. Sampling The sample was one of convenience i.e. any member of the public could take part in the survey if they wished to do so. One of the main aims of this work was to give as many rural dwellers, business owners and regular rural visitors a voice as was possible. Participants were recruited via national and local marketing activity using a toolkit and direction provided by the NRCN. The survey was open to those that live, own a business or regularly visit a rural area. The main analysis of the data was confined to respondents who lived in an officially recognised rural area as defined by the Office of National Statistics (ONS) Output Areas 2011. A respondent’s Output Area is defined by their postcode. More details on Urban-Rural classification can be found in Appendix 1. The Response The scale of the response was significant. In total 20,252 responses were received from across England, Wales and Northern Ireland. We believe this in itself is testimony to the interest and concern amongst our rural population to the impact of crime.
Respondent Profile

                            Figure 1. Demographic profile of research participants

                                          Demographic Profile
    %
                                                     2015    2018
            54 52                                                                 56
      60            46 48                                                              47
      40                                                          28 26                                        28
                                                      21 20 26 25                           18 14
      20                               5 6   10 11                        8 9                       10 11 16
                                 3 3
       0

Base: All respondents 2018 n=20,252; all respondents 2015 n=22,807

The profile of survey respondents is broadly similar to that conducted in 2015. The one area
where it deviates is in socio-economic group where we have increased the response from
lower socio-economic groups which arguably gives us a more balanced viewpoint. This has
also aided our analysis as lower socio-economic groups contain more of the vulnerable
people we highlighted in the previous survey.

The relatively high incidence of older respondents to our survey is partly reflective of the
rural population but is also indicative of a genuine concern amongst the rural elderly
population to be heard.

                            Figure 2. Numbers of responses by Police Force Area
Classifying Rural Populations
Throughout the report we refer to the 6 different rural area clusters, as defined by the
Government Statistical Service (GSS). There are 3 sizes of conurbation used (Town & Fringe,
Village, Hamlets & Isolated), subdivided into whether they are located in a generally less
populous area (sparse) or more populous areas (less sparse). It is important to understand
the relative sizes of these areas when interpreting the findings of this research. Nearly half of
the rural population live in a rural town or its outskirts. The two other most significant rural
areas are Villages and Hamlets & Isolated Dwellings in more populated areas of the country
(sometimes referred to as less sparse). This classification is important in that it represents
rural enclaves which are relatively close to urban areas and are consequently more
vulnerable to criminal activity.
Figure 3. Sizes of the different rural area types in England & Wales based upon Output Areas (Output
areas contain similar numbers of households).
Hamlets & Isolated (sparse)
Village (sparse) 3%
3%
Town & Fringe
Town & Fringe
(less sparse)
(sparse)
46%
3%
Hamlets &
Isolated (less
sparse)
17%
Village (less
sparse)
28%
Our survey sample is a good reflection of the national split shown above. Where we are
slightly over represented is in the rural villages and isolated hamlets in less sparse areas.
Being over-represented here is important for our analysis as they represent the parts of rural
society that are arguably most difficult to police – the rural enclaves which are relatively close
to urban areas and are consequently more vulnerable to criminal activity.Figure 4. Sizes of the different rural area types in our survey sample in 2015 and 2018
Rural hamlets and isolated
Rural village dwellings (sparse), 4
Rural town (sparse), 4
and fringe
Rural town
(sparse), 3
and fringe
(less sparse),
13 3 31
30
26
Rural hamlets
and isolated
dwellings (less
sparse), 24 37
Rural village (less sparse),
35
Statistical Tests
As we have not taken a random sample of the rural population we are not claiming that
overall figures are absolutely representative of the population in question. We have therefore
not assigned any statistical confidence intervals to these figures. As respondents across
different parts of the country were recruited in a similar way then we feel justified in making
statistical comparisons between sub groups of the population and between the 2015 survey
and this one.
Statistically significant differences between sub groups are flagged on figures throughout
the report in blue and red where useful to the interpretation. Blue highlights figures that are
statistically higher than the net overall sample figure and red highlights those that are lower.
Base sizes for each question are referenced throughout the report. These vary according to
whether the respondent was eligible for the question and whether the respondent reached
that point in the survey (not all respondents completed the survey but we have used all the
data collected).
Comparative Data and the Use of Weighting
Where possible, appropriate and useful, the data from this survey has been compared with
data from the Rural Crime Survey 2015 and the Crime Survey of England & Wales.
1. Comparisons with the Rural Crime Survey 2015
The sample profile of the 2018 survey is very similar to that obtained in 2015 in terms of
demographic and rural area types. The largest difference between the two surveys is the
geographic split. The profile of each survey differed significantly by Police Force Area (PFA).
As PFA is a significant determining factor in many of the key measures generated by thissurvey, specifically those around police performance, we do use a simple weighting when
comparing the two data sets. Further details on the weighting procedure can be found in
Appendix B. No other weighting is used in the analysis of this data.
2. Comparisons with the CSEW
A number of questions in the survey replicate those found in the CSEW. There are two
reasons why we have made comparisons with the CSEW. Firstly, it is useful where there is no
published data from the CSEW for the rural population. Here we compare against CSEW data
for the population as a whole to give us a sense of where differences might exist for the rural
population. Secondly, particularly where data at a rural level may have been published, it
gives us the ability to benchmark our survey and underline the credibility of our approach.
Where comparisons with the CSEW are made, we use the most recent published data. This
can range from March 2016 through to March 2018.
Key Respondent Groups
Figure 5. below shows how our sample splits down by sample group. The main groups we
talk about within this report are: ‘Rural Dwellers’. ‘Rural Visitors’ (regular visitors to the
countryside), Specific Rural Business Owners (Mainly farming and agriculture) and ‘Other
Business Owners’.
There is also a fifth group of people who took our survey. This group is made up of two sets
of people: those whose postcodes aren’t officially classified as rural and those we can’t
attribute to an area because they didn’t give a postcode. As these people have taken the
time to complete the survey we do use their data where we can, specifically in the section on
‘crimes against society’ and security measures.
Figure 5. Sample groups used in this reportThe Impact of Crime and Disorder on Victims
This section covers everything that relates to the impact of crime on the rural population:
looking at the types of people and places that are most impacted by crime disorder; the
nature of the crime experienced by these people and how these crimes impact them and
their communities from both a financial and emotional perspective.
By the end of this section you should have a good understanding of who the most
vulnerable parts of rural society are and how rural crime has just as great an impact on
people as urban crime does, and in some cases more so.
Victimisation
Figure 6. Proportion who have been a victim of a crime in a rural area in the last 12 months by sample
group
Question: Have you had any crimes committed against you either in the area where you live or another rural area
in the last 12 months?
Base: All respondents eligible for question; n=16,193
Business owners, particularly those who own specific rural businesses (e.g. farming) were
more likely than the rest of our sample to have experienced a crime in the last 12 months.
This victimisation rate is high and highlights to us early on the impact that crime is having on
this section of the rural population. We do not have any comparative data for this figure as
crime recording figures aren’t readily available for rural businesses and the CSEW doesn’t
deal with business crime. However, for context, the rate of victimisation captured by the
CSEW (year ending March 2017) for rural dwellers is around 11%.
If we then take a look at the types of people who are most likely to be victims of crime
amongst our ‘Rural Dweller’ sample group (see Figure 7), then we also start to see who is
most likely to be affected crime in rural areas. The people most likely to be victims of crime
are young people and those who are bringing up families. They are also more likely to be a
victim if they live in rural hamlets in less sparsely populated areas i.e. small conurbations in
proximity to more urban areas (Figure 8.). This profile of victims is consistent to what wefound in 2015 and also fairly consistent with who is typically victimised across the country as
a whole.
Figure 7. Proportion of ‘Rural Dwellers’ who have been a victim of crime in a rural area in the last 12
months by demographic
Base: All ‘Rural Dwellers’ (non-business); n=11,003
Figure 8. Proportion of people who have been a victim of crime in a rural area in the last 12 months by
rural area type
Base: All ‘Rural Dwellers’ (non-business); n=11,003
The proportions of people who had experienced Anti-Social Behaviour (ASB) over the last 12
months was around 50% across each sample group (not applicable to rural visitors) with the
exception of rural retailers where 63% said they had been a victim. When we look at the
profile of ‘Rural Dwellers’ affected by ASB we again see the emergence of the family life
stage as being most affected (see Figure 9 below). No comparative data is available from the
CSEW for rural areas alone but ASB experience rates for the whole population was 30%
(CSEW year ending March 2017). Again, this suggests our sample does have a bias to those
most impacted by crime & disorder.Figure 9. Proportion of ‘Rural Dwellers’ who have been a victim of ASB in a rural area in the last 12
months by demographic
Base: All ‘Rural Dwellers’ (non-business); n=11,003
Whilst similar types of people are impacted by both crime and ASB, geographically people
are more likely to suffer from ASB if they live in a rural town, where the opportunity to
become a victim of ASB is clearly greater due to population size and a larger night time
economy.
Figure 10. Proportion of people who have been a victim of crime in a rural area in the last 12 months by
rural area type
Base: All ‘Rural Dwellers’ (non-business); n=11,003Types of crime
Broadly speaking, the types of crime that ‘Rural Dwellers’, ‘Rural Visitors’ and even ‘Other
Rural Businesses’ are victims of, are the same as those experienced across the country as a
whole i.e. they are not specific to rural areas. The following 3 Figures give an overview of the
types of crime these people fall victim to.
Figure 10. Relative occurrence of crimes against ‘Rural Dwellers’
Question: Have you had any crimes committed against you either in the area where you live or another rural area
in the last 12 months? To help you remember, here’s a list of different crimes. If you can’t find a description that
fits then please write your own description in one of the boxes provided.
Base: ‘Rural Dweller’ victims of crime (non-business); n=1,915
Figure 11. Relative occurrence of crimes against ‘Rural Visitors’
Question: Have you had any crimes committed against you when visiting a rural area for work or leisure pursuits,
in the last 12 months? To help you remember, here’s a list of different crimes. If you can’t find a description that
fits then please write your own description in one of the boxes provided.
Base: ‘Rural Visitor’ victims of crime; n=193Figure 12. Relative occurrence of crimes against ‘Other Rural Business Owners’ Question: Have you had any crimes committed against you either in the area where you live or another rural area in the last 12 months? To help you remember, here’s a list of different crimes. If you can’t find a description that fits then please write your own description in one of the boxes provided. Base: ‘Other Business Owner’ victims of crime; n=773 Where what many people would think of as rural crimes start to emerge is when we look at ‘Specific Rural Buiness Owners’ (see Figure 13 below). Whilst these people (mainly farmers) can fall victim to any crime that anyone might fall victim to, the weight of crime is towards crimes that are peculiar to farming and related industries. Fly tipping is clearly a huge issue for this group and so too are wildlife crime (incluing hare coursing), theft of equipment and criminal damage. 57% of this sample group had been a victim of fly tipping in the past 12 months which underlines the scale of the problem. While the survey didn’t probe on the specifics of each crime we did ask them to value the financial impact. For victims of fly tipping the average finacial impact to the business owner was over £1,000 a time. A clear up bill that fallls to the business owner alone.
Figure 13. Relative occurrence of crimes against ‘Specific Rural Business Owners’. Blue highlights crimes
                                          that are peculiar to rural areas.

Question: Have you had any crimes committed against you either in the area where you live or another rural area
in the last 12 months? To help you remember, here’s a list of different crimes. If you can’t find a description that
fits then please write your own description in one of the boxes provided.
Base: ‘Specific Business Owner’ victims of crime; n=1,121

How are the victims of crime impacted?
We have already noted the financial impact of fly tipping on ‘Specific Rural Business Owners’
but what are the other impacts of crime on victims in rural areas?
Figure 14. Reactions to crime by sample group Question: Looking at this list what, if any, of these things happened to you as a result of this incident? Base: Victims of crime in a rural area in last 12 months; n=3,615 Figure 14 above shows how victims in our 4 sample groups suffer a variety of different impacts. Yes, crime is an inconvenience that costs victims financially, but it also has other impacts, not least the erosion of trust in society. Beneath these broader impacts also lie a range of other more hidden impacts that are felt by many victims. Impacts such as damage to personal confidence, impact on health, social avoidance and time off work). While these types of impact are less likely for them, they are still felt by a significant number of business victims. Figure 15 below shows that these more hidden, below the surface impacts are more likely to be experienced by certain types of people. Those most vulnerable appear to be younger people, those bringing up families, low socio-economic groups women and those living alone. So many of the same people who are most likely to be victimised are also the ones who are most likely to suffer the most as a consequence.
Figure 15. Hidden reactions to crime by victim demographic

Base: Victims of crime in a rural area in last 12 months; n=4,308

The survey also focused in on the emotional response to the crime and Figure 16 below
shows the range of emotions that result from being a victim of crime. The emotional impact
of crime is clear to see. Anger and annoyance are felt my most people but shock, fear,
anxiety and depression are felt by significant numbers of victims. More so for non-business
victims of crime but still significantly for business owners.

Based on this evidence we should never assume that rural crime is not as impactful as urban
crime.
Figure 16. Emotional reaction to crime by sample group

Question: Many people have emotional reactions after incidents in which they are victims of crime. Looking at
this list, which of these reactions did you personally have?
Base: Victims of crime in a rural area in last 12 months; n=3,670

This question also allows us to compare our findings with those from the Crime Survey of
England & Wales. We have looked specifically at data from burglary victims and compared
the two sets of data in Figure 17 below. The first thing we notice is that the pattern of
emotional response is similar from both surveys which we believe gives additional credibility
to our approach. The second thing we notice is where the two data sets differ. Anger is very
much higher amongst our sample, but more revealing is that as a rural victim of burglary you
are highly likely to be left feeling vulnerable after a burglary. This suggests that some crimes
can actually have more of an impact in rural areas than other areas of the country.
Figure 17. Emotional reaction to burglary as measured by this survey and the CSEW

                                          Anger                                 47
                                                                                              78
                                    Annoyance                              40
                                                                                     53
                                          Shock                            39
                                                                             43
                                           Fear                       32
                                                                         38
                            Difficulty sleeping                      30
                                                                       34
     Loss of confidence or feeling vulnerable                        29
                                                                                45
                      Anxiety or panic attacks                  22
                                                           15                             CSEW (n=525)
                                    Depression            14
                                                         11
                                  Crying/tears            14                              NRCN (n=345)
                                                         12
                                          Other     12

Base: Emotional impact of incidents of burglary, year ending March 2017 CSEW (urban and rural victims); Rural
Dweller Burglary victims from NRCN 2018

To underline this point, it is useful to explore the impact of rural crime in a slightly different
way. When we look at how safe victims of different crimes feel in their own home,
particularly after dark, we notice that a number of what might be considered rural specific
crimes victims appearing at the top of the list of those who feel unsafe. Albeit not proven to
be directly causative there is a relationship that suggests that certain types of rural specific
crime can be highly impactful on feelings of security. Figure 18 below shows the proportion
of each victim type who feel unsafe in their own home with specific rural crimes highlighted
in blue.
Figure 18. Proportion of each victim type who feel unsafe in their own home after dark Question: How safe do you feel in your own home after dark (% a bit unsafe/very unsafe) Base: Victims of crime in a rural area in last 12 months; n=3,634 The emotional impact of crime in rural areas often doesn’t just disappear within a few weeks but there is an emotional legacy that needs to be considered. Figure 19 below shows the types of emotions that dominate and persist. Frustration, anger and disgust, particularly for rural business owners, are the feelings that the majority of victims are left with and this is partly due to the response from the Police (which we will look at later). Beyond that, fear is the legacy for a significant number of victims, whether general population or business victims.
Figure 19. Emotional legacy of rural crime amongst victims by sample group

Question: Which of these words best describes how you feel now about what happened?
Base: Victims of crime in a rural area in last 12 months; n=3,634

There is also a financial burden to bear for many victims of crime and this certainly underpins
some of those emotional impacts we have just been talking about, particularly feelings of
anger and frustration. Figures 20 and 21 below show the scale of the financial impact on
rural victims as well as the source of that financial impact – it is not just the cost of
replacement that has to be considered here but repairs, loss of earnings and upgrading of
security. Around 40 – 50% incur some kind of financial cost. Despite this, claims against
insurance are low at around one quarter. Average re-imbursement on a claim is two thirds
for ‘Rural dwellers’ and even less for business owners who again appear to shoulder the
greater burden when it comes to rural crime.

                                 Figure 20. Financial impact of crime on victims
                                  Rural Dweller          Rural Visitor       Specific Rural    Other Business
                                                                            Business Owner        Owner
 Proportion of victims
                                       48%                   40%                  57%              54%
 impacted financially
 Average cost                         £3,200                £800                 £4,800           £4,500
 (per victim impacted)           (29% up on 2015)      (No comparison       (13% up on 2015)
                                                          with 2015)
 Proportion making an
                                       22%                   23%                  28%              18%
 insurance claim
 Average reimbursement
                                       66%                   38%                  52%              48%
 on claim
Question: What if any financial costs did you incur as a result of this crime?
Base: Victims of crime in a rural area in last 12 months; n=4,376
Figure 21. Financial impact of crime on victims split by source of costs
Question: What if any financial costs did you incur as a result of this crime?
Base: Victims of crime in a rural area in last 12 months incurring a cost; n=1,326
Under Reporting of Crime
Around one third of crimes against our survey participants were not reported to the Police
(and over half of those who were victimised whilst visiting a rural area).
Figure 22. proportion of victims not reporting rural crimes
Question: Was this crime reported to the Police by you or any other person?
Base: Victims of crime in a rural area in last 12 months; n=4,462
Most notable for our research is that our figures for non-reporting have increased by a third
since 2015 for ‘Rural Dwellers’ and by two thirds for businesses.Figure 23. Reasons for not reporting to the Police Question: Why didn’t you report the crime to the Police? Pre-coded list Base: Victims of crime in a rural area not reporting to the police; n=1,678 There are many well researched reasons as to why people don’t always report crimes to the Police. The reasons are no different for rural victims than they are for urban victim. The pattern of reasons uncovered in our survey is similar to that collected by the CSEW. Figure 23 above shows these reasons by our different sample groups. Although not specifically evidenced by this research, we would suggest that the reporting of a crime needs to deliver some positive benefit to the victim, whether that be financial, the delivery of justice or a sense of public duty. However, if the victim does not perceive there to be a chance of any of these then they are unlikely to report. Hence the ‘waste of time’ or ‘police couldn’t do anything’ response. These reasons for not reporting show a consistent pattern across all types of demographic. We also find no evidence to suggest that reporting of crime is influenced by perceptions of the police or previous experience with the Police i.e. even if you have had a poor experience of reporting a crime previously you are no less likely to report a crime again. In terms of likelihood to not report a crime it is older people and men who appear least likely (see figure 24 below).
Figure 24. Non-reporting by demographic

Base: Victims of crime in a rural area in last 12 months; n=4,462

Whether a crime gets reported is very much associated with what the crime is. Figure 25
below shows reporting rates for different types of crime. Most notable is the non-reporting
of fly tipping which is a crime that is ever increasing across the country and ranges from
small vans dumping rubbish to organised dumping of waste on an industrial scale.

It is worth noting that a quarter of those not reporting fly tipping to the police do still report
to the local authority.

                                    Figure 25. Non-reporting by crime type

Base: Victims of crime in a rural area in last 12 months; n=4,462
Perceptions of who the Criminals are
We hypothesised at the outset of this research that the nature of the perpetrators of crime
would have an impact on whether a victim would report the crime or not e.g. perhaps if the
perception that the perpetrator were local or part of an organised gang then there would be
a fear of reprisals. This hypothesis has not been borne out in these results however the
perceptions of the victims are still of interest as in some cases they run counter to what we
have been hearing anecdotally. That is that the criminals are mostly from outside of the area
and working in organised gangs.
Figure 26 below shows that on balance, the perception is that most perpetrators are part of
an organised group i.e. they are not working alone. This is particularly the case for ‘Rural
Specific Business Owners’ who we know anecdotally are feeling increasingly victimised by
organised crime gangs. However contrary to anecdotal evidence the perception is that the
criminals are more likely local than from outside of the area.
The perception across all sample groups is that they have been specifically targeted by the
perpetrator. This feeling of being targeted increases the more remote the victim is in terms
of geographical location (53% of those living in villages and hamlets felt they had been
specifically targeted).
Figure 26. Perceptions of who the perpetrator was
Questions: Do you think (or know if) the perpetrator was local or from outside the area?
Do you think (or know if) they were working alone or were they part of an organised group?
Do you think the crime was opportunistic or were you specifically targeted?
Base: Victims of relevant crimes (burglary, theft and fraud) in rural area in last year; n=3509Figure 27 below shows how perceptions differ by crime type. Most notable is the proportion
of victims of significant rural specific crimes who believe that the perpetrators are local.
Crimes such as ‘theft of agricultural machinery, theft of livestock, and theft of agricultural
materials.
Figure 27. Perceptions of who the perpetrator was by crime type
80
Proportion who believe they were from outside
Being deceived out of money or
property, 54
70
Online Harassment, 78 Wildlife crime or hare coursing on
your land, 55
60
Theft from your vehicle, 38 Theft of your vehicle, 72
50 Burglary, 61
the area
Theft of possessions from your Theft of fuel, 67
40 Theft of your bike, 66 Theft of
person, 28
Theft from an agricultural
Harassment, 75 outbuilding, machinery or
30 51 equipment, 75
Theft of personal Theft of horse tack/equipment, 70
possessions, 9 Shoplifting, 33
20 Fly tipping …
Theft of
Robbery, 78 Theft of livestock, 76
agricultural
10 Criminal damage, Vandalism/ materials, 62
Arson, 40
0
20 30 40 50 60 70 80 90 100
Proportion who believed they were an organised gang
Key: Bubble size and numbers reflect the proportion who believe they were specifically targetedThe Impact of Crime and Disorder on the Wider Community
Not everyone in rural communities is affected personally by crime or ASB but most (around
three quarters) are aware of criminal activity that is happening; whether through friends and
family, general hearsay or through seeing the evidence of criminal activity around them. All
of this (alongside the influence of the media) feeds into people’s perceptions of crime and
feelings of safety. We must also consider those crimes against society that, although don’t
have specific victims, do feed into these perceptions of crime and feelings of safety: drug
crime, fly tipping and road related crime such as speeding.
This section will highlight how crime and ASB are impacting communities and who the most
vulnerable members of these communities are.
Perceptions of Crime Rates
Figure 28. Perceptions of crime in Britain and local area
Question: How much of a problem do you think crime is in…..?
Base: All rural dwellers including business owners; n=11,683
It is fairly typical for people to believe that crime rates are higher in the country as a whole
than in the area where they live. This phenomenon is borne out by the findings of our survey
when we look at the data as a whole. However, if you ask one of our’ Specific Rural Business
Owners’ then they are likely to tell you that crime rates are just as high where they live/work
as the rest of the country (See Figure 29 below).Figure 29. Perceptions of crime in local area by sample group (%fairly/very big problem)
Base: All rural dwellers including business owners; n=11,683
Those ‘Rural Dwellers’ most likely to perceive crime to be a big problem in the area where
they live are those from lower socio-economic groups and the family life stage (see Figure 30
below).
Figure 30. Perceptions of crime in local area of ‘Rural Dwellers’ by demographic (%fairly/very big
problem)
Base: All rural dwellers excluding business owners; n=9,215
In terms of geographical area (Figure 31 below), it is those living in rural towns in less sparse
areas whom are most likely to see crime as a big problem in their area.
Figure 31. Perceptions of crime in local area of ‘Rural Dwellers’ by geography (%fairly/very big problem
Base: All rural dwellers excluding business owners; n=9,215
We also found that 70% of ‘Rural Dwellers’ and 80% of ‘Specific Rural Business Owners’
believe crime is going up in their local area.At this point in the report it is worth noting the emergence of two vulnerable groups from this
research. Firstly ‘Specific Rural Business Owners’ (mainly farmers) and secondly families from
lower socio-economic groups – ‘Hard Working and Struggling Families’. These two groups will
emerge again and again as we look at other indicators around crime and feelings of safety.
Quality of Life Impacts
Ultimately it is people’s quality of life that is the priority for us as an organisation (NRCN) and
for society as a whole. There are a number of indicators used to measure this and in this sub
section we are looking at 3 such indicators; the impact of crime, fear of crime and feelings of
safety.
Overall around a third of people (Figures 32a and 32b below) feel that crime (and fear of
crime) have a moderate or great impact on their lives. This is most evident amongst ‘Specific
Rural Business Owners’, half of whom indicate that crime, and fear of crime, has a moderate
or great impact on their lives.
Figure 32a. Impact of crime on quality of life by sample group
Question: How much is your own quality of life affected by crime on a scale from 1 to 10, where 1 is no effect
and 10 is a total effect on your quality of life? (1-3=minimal; 4-7= moderate; 8-10=great)
Base: All rural dwellers; n=11,201
Figure 32b. Impact of fear of crime on quality of life by sample group
Question: How much is your own quality of life affected by fear of crime on a scale from 1 to 10, where 1 is no
effect and 10 is a total effect on your quality of life? (1-3=minimal; 4-7= moderate; 8-10=great)
Base: All rural dwellers; n=11,202
The profile of those who feel most impacted is shown in Figures 33 and 34 below.Here again we see the impacts being greater amongst those in lower socio-economic groups
and the family life stage as well as younger people in general. Also, amongst those living in
rural towns (less sparse) and hamlets (less sparse).
Figure 33. Impact of crime on quality of life by demographic
Base: All rural dwellers; n=11,201
Figure 34. Impact of crime on quality of life by rural geography
Base: All rural dwellers; n=11,201
As we can see in Figure 35 below, ‘Specific Rural Business Owners’ feel the most worried
about becoming a victim of crime (60% fairly or very) and there is some evidence to say that
the level of worry has increased since 2015, when we ran the last survey. It represents an
increase of 4 percentage points based on a weighted comparison between the 2 surveys. No
change in fear of crime has been observed amongst general ‘Rural Dwellers’.You can also read