LIVING PLANET REPORT CANADA - 2020 WILDLIFE AT RISK - WWF ...
←
→
Page content transcription
If your browser does not render page correctly, please read the page content below

CANADA

         LIVING PLANET
         REPORT CANADA
         2020 • WILDLIFE AT RISK
WWF-Canada’s Living Planet Report Canada
2020: Wildlife At Risk could not have been
developed without the expertise, analytical skills
and contributions of several individuals.

Jessica Currie, James Snider and Emily Giles led
the analysis as part of WWF-Canada’s Science,
Knowledge and Innovation (SKI) team. Core
principles and conceptual design of the Living
Planet Index (LPI) were originally developed
by the Zoological Society of London and World
Wildlife Fund International.

Special thanks for contributions from Eli Enns,
Danika Littlechild, George Russell Jr. and
Paul Okalik.

Special thanks for review and support to: Karen
Beazley (Dalhousie University), Valentina
Marconi (Zoological Society of London), Louise
McRae (Zoological Society of London), Sarah
Otto (University of British Columbia), Risa Smith
(IUCN, WCPA), Eric B. Taylor (University of
British Columbia) and Stephen Woodley (IUCN).

WWF-Canada. 2020. Living Planet Report
Canada: Wildlife At Risk. Currie J. Snider J.
Giles E. World Wildlife Fund Canada. Toronto,
Canada.

WWF-Canada
4th Floor, 410 Adelaide Street West
Toronto, Ontario M5V 1S8

© 1986 Panda symbol WWF-World Wide Fund
for Nature (also known as World Wildlife Fund).

® “WWF” is a WWF Registered Trademark.

WWF-Canada is a federally registered charity
(No. 11930 4954 RR0001), and an official
national organization of World Wildlife Fund for
Nature, headquartered in Gland, Switzerland.
WWF is known as World Wildlife Fund in Canada
and the U.S. Published (September 2020) by
WWF-Canada, Toronto, Ontario, Canada. Any
reproduction in full or in part of this publication
must mention the title and credit the above-
mentioned publisher as the copyright owner.
© Living Planet Report Canada: Wildlife At Risk
(2020) WWF-Canada. No photographs from
this production may be reproduced. All rights
reserved. wwf.ca

Living Planet Report® and Living Planet Index®
are registered trademarks of WWF International.

Cover photo: © Shutterstock

Living Planet Report Canada is
generously supported by the

                                                      © Brad Josephs
CONTENTS
CHAPTER 1: REVERSING WILDLIFE LOSS IN CANADA                                           9
   What is the Living Planet Index?                                                   11
   What is in the Canadian Living Planet Index?                                       12
         Where do the data come from?                                                 12
         Treatment of data                                                            14
         Analytical updates for the 2020 Canadian Living Planet Index                 14
         Embracing different knowledge systems                                        15

CHAPTER 2: CANADIAN LIVING PLANET INDEX                                               19
   Understanding the national trend                                                   24
   Shifting baselines                                                                 27
   A focus on at-risk species                                                         28

CHAPTER 3: NATIONALLY ASSESSED AT-RISK SPECIES                                        31
   Canadian LPI for nationally assessed at-risk species                               32

CHAPTER 4: IDENTIFICATION OF THREATS                                                  35
   Interacting drivers of decline                                                     36
   Overexploitation                                                                   39
   Land use and land-use change                                                       46
   Sea use and sea-use change                                                         48

CHAPTER 5: GLOBALLY ASSESSED AT-RISK SPECIES                                          51
   Canadian-LPI for globally assessed at-risk species living in Canada                52

CHAPTER 6: SOLUTIONS THAT ADDRESS MULTIPLE THREATS                                    63
   Nature-based climate solutions                                                     64
   Protection and management of habitats and carbon stores                            65
         Protected areas                                                              66
         Indigenous protected and conserved areas                                     70
         Stewarding protected and conserved areas                                     72
   Ecological restoration of degraded ecosystems                                      74
   Moving forward                                                                     78

REFERENCES                                                                            80

                                      LIVING PLANET REPORT CANADA 2020 — WILDLIFE AT RISK   1
MESSAGE FROM MEGAN LE
When it comes to nature, Canada is considered a land of plenty
— plenty of ocean coastline and boreal forest; plenty of sea ice
and grasslands; and plenty of winding rivers, sparkling lakes and
expansive wetlands. While it’s true that we have a lot of intact
ecosystems throughout our vast and beautiful country — the second-
largest amount remaining in the world, in fact — plenty is a relative
term. Plenty has not proven to be enough for all wildlife to thrive.

Our Living Planet Report Canada (LPRC) 2020                    management are proven to help species recover.
reveals that since 1970, populations of Canadian               And nature-based climate solutions not only
species assessed as at risk have plunged by an                 mitigate the effects of a warming world — they also
average of 59 per cent and species assessed                    safeguard wildlife at the same time by providing
as globally at risk have seen their Canadian                   the habitat they need to thrive.
populations fall by an average of 42 per cent.
                                                               Here at WWF-Canada, we’re committing our
Past solutions have addressed one problem at a                 resources, re-organizing our activities and re-
time, and we know now that this hasn’t been enough             aligning our operations as part of a 10-year
— as our new report shows, at-risk species now face            concentrated effort to achieve greater sustainability
multiple threats. We need new approaches to                    of wildlife populations and healthy ecosystems for
address them simultaneously. Industrial pressures              both nature and people.
and overexploitation, for example, are threatening
                                                               But we can’t accomplish this alone. It’s easy to get
wildlife across our lands and waters. The climate
                                                               discouraged by bad news about the environment,
crisis is wreaking ever more havoc, with fires and
                                                               especially with COVID-19 putting the world into
floods raging regularly across the south as the Arctic
                                                               even more of a tailspin. But post-pandemic green
melts and the seas rise. And the resulting habitat
                                                               recovery plans can provide a rare opportunity to
loss and degradation are driving both species
                                                               not just imagine the future we want to live in, but
declines and land-based emissions.
                                                               also to fund it. And when we all come together
It’s no easy feat to tackle all of this at once. But           — as individuals, organizations, communities,
nature can inherently help us fight this dual crisis           governments and businesses — we can effect real
of climate change and biodiversity loss. Our                   change with innovative and inspiring solutions.
ecosystems can sequester carbon and safeguard                  Through the LPRC 2020, we’ve shown that we
species — all we have to do is protect and restore             have the knowledge and expertise required to reach
these areas and let them do their jobs.                        these goals. By joining forces, we will achieve them.

And we already know how to do it. Indigenous                   Megan Leslie
knowledge systems and leadership are effective                 President and CEO
and just keys to successful conservation.                      World Wildlife Fund Canada
Protected areas, ecosystem restoration and sound
2        LIVING PLANET REPORT CANADA 2020 — WILDLIFE AT RISK
ESLIE
                                                                      © Shutterstock

        A DIFFERENT APPROACH TO CONSERVATION IS
        NEEDED: ONE THAT CAN MORE EFFECTIVELY
        ADDRESS MULTIPLE THREATS TO BIODIVERSITY
        AND CANADA’S ECOSYSTEMS, INCLUDING THE
        ACCELERATING CLIMATE CRISIS

                     LIVING PLANET REPORT CANADA 2020 — WILDLIFE AT RISK          3
MESSAGE FROM
JAMES SNIDER
We are at a pivotal moment in time. Over just the past year, we’ve
seen wildfires raging through the Amazonian rainforest and all
across Australia, while the Arctic’s sea ice melts and permafrost
thaws. Climate change is not some far-off problem for the
future. The consequences are here — now — and already having
frightening impacts.

We’ve also seen a series of publications from the
scientific community on the astonishing magnitude
of the challenge ahead of us. UN scientific panel
reports have shown as many as one million
species are at risk of future extinction and that
the destruction and degradation of nature is a key
driver of climate change, causing as much as 30
per cent of current greenhouse gas emissions.

As this Living Planet Report Canada 2020 shows,
we are confronting these staggering challenges
here as well. The Canadian Living Planet Index
reveals that populations of our at-risk species are
in dramatic decline due to multiple threats to their
survival. The results clearly indicate we need to be
doing much more to address these threats — and
we need to be doing it now.

We’re also seeing our world transformed by the
catastrophic consequences of the COVID-19
pandemic, which at its roots has deep connections
to the degradation of habitat and increased risk of
transference of zoonotic diseases that pass from
wildlife to humans.

4        LIVING PLANET REPORT CANADA 2020 — WILDLIFE AT RISK
THE RESULTS CLEARLY INDICATE WE NEED TO
                                BE DOING MUCH MORE TO ADDRESS THESE
                                THREATS – AND WE NEED TO BE DOING IT NOW

In a world in crisis, we must reconsider our       restoration of degraded habitats, both of which
relationship with nature and invest in solutions   sequester carbon — can be implemented in a
that simultaneously tackle the deeply interwoven   just and equitable way through Indigenous-led
threats of climate change and biodiversity loss.   conservation. This will help us build a stronger,
                                                   more resilient future for wildlife, climate and
There is an urgent need for Canada to embrace
                                                   people.
this opportunity. We have a responsibility to
demonstrate global leadership. We can show         James Snider
the world how nature-based climate solutions       Vice-president, Science, Knowledge and Innovation
— like protecting intact nature and broad-scale    World Wildlife Fund Canada

                                                                                                      © Shutterstock

                                                     LIVING PLANET REPORT CANADA 2020 — WILDLIFE AT RISK          5
KEY FINDINGS
  -42                  %%

                                   Populations of Canadian species assessed as at risk

        -59            %%
                                   nationally by the Committee on the Status of Endangered
                                   Wildlife in Canada (COSEWIC) have declined by 59 per cent,
                                   on average, from 1970–2016.

                                   At-risk species in Canada face an average of five threats,

                 5
                                   including the accelerating threat of climate change.

              THREATS
             THREATS

                                   Populations of species of global conservation concern

      -42
                                   — assessed as threatened on the IUCN Red List — also
                        %          have declined in Canada by 42 per cent, on average,

      +40              %%          from 1970–2016.

         -59            %

6   LIVING PLANET REPORT CANADA 2020 — WILDLIFE AT RISK
© Andrew S. Wright / WWF-Canada

                                                         Conservation efforts targeting single threats are unlikely to
                                                         be successful, so new approaches tackling multiple threats
                                                         are needed to stop wildlife loss in Canada.

                        ONE
                        ONE                              Nature-based climate solutions — like protected areas and
NNAATTUU RRISISISIS

                      SOLUTION
                                 CCLLIMIM CCRRISISISIS

                      SOLUTION                           restoration — can help to stop this wildlife loss by addressing
       RREE CC

                                        AATTEE

                                                         multiple threats to biodiversity while reducing climate change
                                                         by sequestering and storing carbon in natural ecosystems.

                                                                               LIVING PLANET REPORT CANADA 2020 — WILDLIFE AT RISK         7
© Shutterstock

8           LIVING PLANET REPORT CANADA 2020 — WILDLIFE AT RISK
CHAPTER 1

REVERSING WILDLIFE LOSS
IN CANADA: A NEW WAY
FORWARD
Canada is widely renowned for its rich, abundant
ecosystems. These forests, tundra, sea ice, watersheds,
grasslands and marine and coastal zones provide
habitat for approximately 1,800 native species of
vertebrate animals1.

Recently, Canada was identified as                continue. The WWF-Canada Living Planet
being second in the world (behind only            Report Canada (LPRC) 2020 has analyzed
Russia) when it comes to remaining intact         wildlife population trends and found that
natural landscapes2 (particularly boreal          populations of Canadian vertebrate
forests and tundra)3 and seascapes.4              species currently assessed as at risk
Canada, therefore, has a disproportionate         nationally by the Committee on the
opportunity and responsibility to protect         Status of Endangered Wildlife in
these land and seascapes — providing              Canada (COSEWIC) have seen their
important habitat for wildlife, including         numbers plummet by 59 per cent,
endemic, native and migratory species.            on average, from 1970 to 2016. While
                                                  some of these species were assessed as at
And yet…
                                                  risk due to declining population sizes, in
Canada is now home to hundreds of                 aggregate, this trend clearly indicates that
at-risk species. Without meaningful               efforts to protect and recover vulnerable
conservation action, their decline will           wildlife at local, provincial and national

                                          LIVING PLANET REPORT CANADA 2020 — WILDLIFE AT RISK    9
scales are not nearly enough. including the accelerating climate crisis.
Nature-based climate solutions are one example.
Wildlife in Canada are threatened by multiple,
Through the protection, stewardship and
interacting drivers of decline, including
restoration of ecosystems with large amounts of
overexploitation of resources and the accelerating
stored carbon or high carbon sequestration rates,
threat of climate change. In fact, species
we can support critical natural carbon sinks while
currently assessed as at risk in Canada by
simultaneously conserving wildlife of national and
COSEWIC face an average of five threats.
global conservation concern.
Conservation actions that target only single drivers
of wildlife and habitat decline will be insufficient WWF-Canada’s LPRC 2020 findings demonstrate
to reverse biodiversity loss. Increasingly, the need for immediate action and heightened
conservation strategies need to embrace systematic ambition. The next decade will be critical in
and multifaceted approaches that tackle multiple reversing catastrophic wildlife loss and climate
environmental crises at the same time. breakdown. Canada can — and must — provide
global leadership by strengthening its goals and
Canada is not only home to wildlife of national
commitments at home and showing the world the
conservation concern — it also hosts species
way forward for nature and people.
of global conservation importance. In our
study, populations of vertebrate species
currently assessed as at risk globally by the
International Union for Conservation of
Nature (IUCN) have declined, on average, © Jeremy Allouche on Unsplash
by 42 per cent in Canada from 1970 to 2016.
These declines of species of global conservation
concern in Canada magnify our international
responsibility for their recovery.
Canada’s ecosystems — habitats for globally and
nationally threatened wildlife — also provide key
goods and services that we — humans — rely on,
such as food, medicines, and clean air and water.
They even capture and store greenhouse gases
that affect our climate. In fact, significant amounts
of the world’s carbon are sequestered and stored
in Canada’s wetlands, peatlands, coastal areas
and forests. Yet with the continued degradation INTERPRETING THE
of nature, Canada’s ecosystems have lost stored
carbon since the 1990s, and Canada’s significance
LIVING PLANET INDEX
as a carbon sink, particularly in forests, has been The C-LPI is an indicator of wildlife abundance
declining.5 It’s clear that Canada also bears a over time and does not reflect species
global responsibility to prevent the release of these extinctions. In addition, an average of
carbon stores into the atmosphere and enhance the population trends is not synonymous with
ecosystems’ absorption capacities to help address an average of total numbers of animals lost.
the accelerating threat of climate change. For instance, a loss of 20 to 10 individuals in a
population would have the same proportional
This is why a different approach to
loss as a decline of 10,000 to 5,000 but the total
conservation is needed: one that can more
number of animals lost differs substantially.
effectively address multiple threats to
biodiversity and Canada’s ecosystems,
10 LIVING PLANET REPORT CANADA 2020 — WILDLIFE AT RISKWHAT IS THE LIVING
PLANET INDEX?
The Living Planet Index is a biodiversity indicator
used to track the state of wildlife at global,
national or local scales. It is used to measure
KEY TERMS
ecological performance by tracking patterns in BIODIVERSITY (short for “biological
vertebrate abundance (population size) over time. diversity”): The variability among living
The Living Planet Index is based on one of the organisms, from plants to animals, and the
largest repositories of vertebrate abundance data terrestrial, marine and freshwater ecosystems
over time. It was adopted by the Convention on in which they live. Biodiversity includes diversity
Biological Diversity (CBD) as an indicator to track within the same species (genetic diversity),
progress towards its targets aimed at addressing between different species and between
biodiversity loss.6 ecosystems.
Canadian invertebrates are not included within LIVING PLANET INDEX (LPI): An indicator of
the Canadian Living Planet Index (C-LPI) as biodiversity that tracks patterns of vertebrate
only a small fraction of invertebrate species have abundance over time. Trends in abundance
consistent long-term monitoring data available for indicate how well nature is doing overall.
analysis. Consequently, the gap in representation
POPULATIONS (short for “monitored
would inaccurately reflect the state of invertebrate
populations”): Refers to the wildlife population
species across the country. In contrast, vertebrates
data included in the Canadian Living Planet
are comparatively well monitored and 50 per
Index Database. A single species may be made
cent of native vertebrate species are currently
up of many different monitored populations
represented in the C-LPI.
that all contribute to the average trend for
Globally, the Living Planet Index was first that species. For example, wood turtles are
published in 1998 and has been updated biennially found in Ontario, Quebec, New Brunswick
to track average population abundance of and Nova Scotia and the population trends in
monitored vertebrate species over time.7 The C-LPI these various locations all contribute to the
was first released by World Wildlife Fund (WWF) species’ national trend. In this report, monitored
Canada in 2007,8 with a single, yet substantial populations and populations are used
update published in 2017.9 In 2017, both WWF- interchangeably.
Canada and Environment and Climate Change
TAXONOMIC GROUPS: In biology, species are
Canada (ECCC)10 adopted modified versions of the
grouped together into taxonomic groups based
global Living Planet Index to monitor aggregate
on shared characteristics. For the Canadian
trends in vertebrate abundance. These modified
Living Planet Index, species are grouped into
versions, titled the C-LPI and the Canadian Species
the four different vertebrate groups: birds,
Index (CSI) respectively, showcasing similar
mammals, fish, and amphibians and reptiles.
national and realm-level results.
LIVING PLANET REPORT CANADA 2020 — WILDLIFE AT RISK 11WHAT IS IN THE CANADIAN
LIVING PLANET INDEX?
WHERE DO THE DATA COME FROM?
Data on trends in species populations were • Data sources must be referenced and traceable;
obtained from over 300 sources and included in
the calculation of the 2020 Canadian Living Planet • Species must be native to Canada and have
Index (C-LPI). Data were retrieved from peer- applicable conservation status rank according
reviewed scientific literature, public databases and to Canada’s Wild Species Report16 (i.e., exotic
government assessments (for example Fisheries species, hybrids and accidental species under
and Oceans Canada Research Vessel Trawl the NatureServe rank of “not applicable” were
Surveys and North American Bird Conservation excluded); and
Initiative — Canada’s State of Canada’s Birds11).
Approximately half of Canada’s native vertebrate • Population data must be available for at least
species (883 species) were included within the three years between 1970 and 2016 (previously,
C-LPI, and the data quality, spatial coverage and only two years of data were required).
number of populations differed by species and
taxonomic group. The data had broad spatial
coverage across the country (Figure 1), particularly
for marine fish and birds.
• Criteria for the inclusion of species population
data in the index followed the approach of
previous iterations of the Living Planet Index as
developed by the Zoological Society of London,12
WWF-Canada13 and ECCC,14 15 with slight
MAMMALS
modifications for the C-LPI:
• Populations must have been consistently
monitored in the same location, using the same
method over time;
• Data must be numerical (i.e., a population
count or another reliable population-size proxy
such as population estimates, spawning stock
biomass, density, etc.);
© Jeremy Harrison / WWF-Canada
12 LIVING PLANET REPORT CANADA 2020 — WILDLIFE AT RISKTaxonomic Count of
Group Population
Time Series
1–5
6–27
28–67
68–118
119–191
Figure 1. Distribution of the 3,415 population trends from the Canadian Living Planet Index. Point locations — which include some
provincial-level data points — provide a rough indication of the distribution of the data. A point location may correspond to several
monitored populations and/or species. Note that 366 population trends corresponding to nation-wide bird trends are not shown on this
map as they lack spatial specificity.
AMPHIBIANS & REPTILES BIRDS FISH
© Shutterstock © Avia5 from Pixabay © Shutterstock
LIVING PLANET REPORT CANADA 2020 — WILDLIFE AT RISK 13TREATMENT OF DATA
In cases where there was spatial overlap of In calculating the C-LPI, population counts of
population time series for a given species, only zero — where a species was not observed in a given
one of the overlapping populations was retained year — were treated as missing values, as they are
to reduce geographic sampling bias. Priority for more likely missing observations than representing
inclusion was given to higher quality data, which local population extirpations.17 Critically, none of
encompasses time series length, fullness, and the population time series included in the C-LPI
credibility of the data source. had a zero (or trailing zeroes) recorded as the
final numeric data point for the trend and were
therefore not reflective of a true extinction.
ANALYTICAL UPDATES FOR THE 2020
CANADIAN LIVING PLANET INDEX
DETAILED CHANGES INCLUDE:
In the 2020 report, we have strengthened our
analysis by requiring higher standards for
data quality and by collecting additional data, • The addition of new data spanning various time
including more recent data records. Notably, a periods between 1970 and 2016;
large portion of new data came from Fisheries
and Oceans Canada in Newfoundland, and Parks • An extension of the index from 2014 to 2016;
Canada (where increases in wildlife populations and
are anticipated). Due to these methodological and
database changes, the C-LPI should be viewed as • Changes in the criteria for inclusion in the
the best possible snapshot of trends in Canadian analysis, requiring data of greater quality (time
wildlife populations at a given time and should series fullness) to produce a more accurate
not be directly compared to previous iterations of picture of the state of wildlife in Canada.
the index. Population data must be available for at least
three years between 1970 and 2016 (only two
years of data were previously required).
See WWF-Canada’s C-LPI Technical Supplement
for additional details.
14 LIVING PLANET REPORT CANADA 2020 — WILDLIFE AT RISKEMBRACING DIFFERENT KNOWLEDGE
SYSTEMS
© Andrew S. Wright / WWF-Canada
Embracing Indigenous-led conservation is of a scientific knowledge system that relies on a
vital to advancing reconciliation and renewing specific form of quantitative data.
relationships with Indigenous Peoples. First
To expand our consideration of other vital ways
Nations, Métis and Inuit have been stewarding
of knowing in the LPRC 2020, we have included a
these lands and waters for millennia. Supporting
series of species stories to further explore trends
Indigenous knowledge, governance, sovereignty
in wildlife in Canada told from the perspective of
and leadership is essential to advancing
both Indigenous and non-Indigenous knowledge
reconciliation and conservation across the country.
systems. This is one step towards WWF-Canada’s
For conservation in Canada to be equitable and journey toward embracing “two-eyed seeing” —
just, we need to increasingly recognize different which includes learning to see and embrace the
knowledge systems — both Indigenous and strengths of Indigenous knowledges from one eye,
non-Indigenous — and how they can contribute and the strengths of scientific knowledge from the
to the understanding of nature and our human other.18
relationship with nature. The C-LPI itself is part
LIVING PLANET REPORT CANADA 2020 — WILDLIFE AT RISK 15ETHICAL SPACE AND
BIODIVERSITY CONSERVATION
BY: DANIKA LITTLECHILD, ASSISTANT PROFESSOR, LAW AND LEGAL STUDIES,
CARLETON UNIVERSITY, ERMINESKIN CREE NATION, MASKACIS, TREATY NO. 6 TERRITORY,
CO-CHAIR, INDIGENOUS CIRCLE OF EXPERTS
I grew up on the reserve and from an early age was everyone out of that default mode and elevate
hyper aware of what we would now call biodiversity Indigenous systems to a position of equity with
and its connection to Cree knowledge systems and non-Indigenous systems, and have Indigenous
culture. Peoples be recognized as experts of their own
knowledge systems. We didn’t want a scenario
From a young age, one of my uncles would
where we needed non-Indigenous scientists or
come and pick me up and take me out into the
experts to “translate” what we would say to make it
bush behind our house to walk to my grandma’s
legitimate somehow.
place. On the way, he would show me traditional
medicines and different plants until I was probably This allows both systems to function on their own
about nine or 10. and with their own integrity without having to alter
themselves. Conservation issues go through these
Around that time, things changed quite
respective systems and are brought into ethical
drastically — the First Nation that I lived in started
space for “cross-validation.”
giving out leases to non-Indigenous farmers who
cleared the land near our house. They also started As we move toward important biodiversity targets,
using herbicides and pesticides that would have an it’s a lot easier to meet a rapidly approaching target
impact on our local biodiversity and our ability to using well-established organizations as opposed
harvest traditional food. At the same time, there to working with First Nations that have limited
was a huge amount of oil and gas extraction also capacity. But we need to provide as much support
happening on the reserve. as we can to those Indigenous nations who wish to
take a different approach within their territories.
Today, when I take the same path behind my
We should be flexible in terms of understanding
family home, it’s all crabgrass. We used to have
the different iterations that can happen around a
a slew of plants there. They’re totally gone. We
protected and conserved area led by Indigenous
used to be able to pick berries very close to our
people.
house. All of that has gone away. There’s really no
biodiversity left. And finally, it’s important to recognize and pause
and celebrate when we do make progress together.
Before I served on the Indigenous Circle of Experts
The ICE report is a good example of this. All our
(ICE), I worked with other experts on the concept
actions add up to something because they open up
of ethical space. Ethical space is about elevating
new avenues of thought and new ideas of how to
Indigenous systems to a position of equity. There
approach things and they have a ripple effect for
is a common refrain that conservationists would
relationships and how we communicate.
use when they would talk about Indigenous
Peoples in protected areas, or their rights and
roles in conservation. With ICE, we wanted to shift
16 LIVING PLANET REPORT CANADA 2020 — WILDLIFE AT RISK© Shutterstock
“ETHICAL SPACE IS ABOUT
ELEVATING INDIGENOUS
SYSTEMS TO A POSITION
OF EQUITY”
Is there an image to go with
Danika Littlechild’s article?
- DANIKA LITTLECHILD
LIVING PLANET REPORT CANADA 2020 — WILDLIFE AT RISK 17© Jachan Devol 18 LIVING PLANET REPORT CANADA 2020 — WILDLIFE AT RISK
CHAPTER 2

CANADIAN LIVING PLANET
INDEX
The Canadian Living Planet Index (C-LPI) examines the
average trend in population abundance for 883 native
vertebrate species in Canada — about half of Canada’s
vertebrate species19 — and shows a near-stable trend
of six per cent from 1970–2016 (from 1.0 in 1970 to
1.06 in 2016; Figure 2a). The confidence intervals overlap
the baseline.

                                           HOW TO READ THE INDEX
Birds and fish are the primary taxonomic
groups in the C-LPI, accounting for 44
per cent and 41 per cent of species in     The Living Planet Index was assigned a
the analysis, respectively (Figure 2b).    benchmark value of 1.0 in 1970. An increase
The relative proportion of mammals (11     in the index represents an increase in wildlife
per cent) and amphibians and reptiles      population abundances and would be
(four per cent) is smaller (Figure 2b).    presented as an upward trend in the index
This is expected, given that there are     value over time. The magnitude of the change
comparatively fewer species in these       in the Living Planet Index can be reported as a
taxonomic groups in Canada (Table          percentage — if the index value increases from
2). Taxonomic biases also exist in the     1 to 1.2, that’s an increase of 20 per cent. The
broader context of conservation research   opposite is true for decreases in abundance:
with fish, amphibians and reptiles often   a decrease from 1 to 0.8 is a decrease of 20
underrepresented relative to the number    per cent. Any finding within five per cent of the
of species in these groups.20              baseline is considered stable.

                                           LIVING PLANET REPORT CANADA 2020 — WILDLIFE AT RISK   19
National
2
1.8
1.6
1.4
Index Value
1.2
1
0.8
0.6
0.4
0.2
0
1970
1972
1974
1976
1978
1980
1982
1984
1986
1988
1990
1992
1994
1996
1998
2000
2002
2004
2006
2008
2010
2012
2014
2016
Year
Figure 2a. The Canadian LPI shows an average near-stable trend of six per cent (confidence interval range: -5 to 19 per cent) between
1970 and 2016. Trend in population abundance for 3,781 population time-series of 883 native vertebrate species.
National
0% 10% 20% 30% 40% 50% 60% 70% 80% 90% 100%
Birds Fish Ma mmals Amphibians & Reptiles
Figure 2b. Relative proportion of taxonomic groups included in the analysis (883 species).
COSEWIC
Taxonomic Group Number in C-LPI Number in Canada Percentage Included
389 452 86%
0% 10% 20% 30% 357
40% 50% 60%1,04370% 80% 34%
90% 100%
Birds Fish Ma mmals Amphibians & Reptiles
100 196 51%
37 87 43%
Total 883 IUCN 1,778 50%
Table 2. Representation of native vertebrate species considered of conservation interest according to Canada’s Wild Species Report21
(exotic species, hybrids and accidental species are excluded) included in the analysis.
0% 10% 20% 30% 40% 50% 60% 70% 80% 90% 100%
Birds Fish Ma mmals Amphibians & Reptiles
20 LIVING PLANET REPORT CANADA 2020 — WILDLIFE AT RISK
Conservation Effort© Shutterstock
THE LIVING PLANET INDEX IS BASED ON ONE OF
THE LARGEST GLOBAL REPOSITORIES OF DATA
ON VERTEBRATE ABUNDANCE OVER TIME
LIVING PLANET REPORT CANADA 2020 — WILDLIFE AT RISK 21SHORTNOSE STURGEON
© Bob Michelson
(Acipenser brevirostrum)
COSEWIC Status: Special Concern
IUCN Red List Status: Vulnerable
Shortnose sturgeon are a prehistoric-looking fish extending from their mouths. They are long-lived —
species that have been around for millions of years. the oldest female ever recorded in the Saint John River
In Canada, they are only found in the Saint John River was 67 years old — and females are reproductively
system in New Brunswick. The small range of the mature when they are 18 years old, typically spawning
Canadian shortnose sturgeon population makes it once every three years.23 The shortnose sturgeon is
vulnerable to potential threats within the Saint John one of only five sturgeon species in Canada. Although
River system. They occupy estuarine (where marine a population size estimate for the whole river has not
meets freshwater) habitats.22 been completed since 1979, the population at the
only confirmed overwintering site has been stable
Shortnose sturgeon are heavily armoured — they have
over the last ten years.24
large bony plates covering the lengths of their bodies
and barbels (feelers that look much like whiskers)
22 LIVING PLANET REPORT CANADA 2020 — WILDLIFE AT RISKPEREGRINE FALCON
© Shutterstock
(Falco peregrinus anatum/tundris)
COSEWIC Status: Not at Risk
IUCN Red List Status: Least Concern
Peregrine falcons tell a success
story about how conservation
efforts can have astounding effects
on wildlife. But it wasn’t always this way.
Like many other birds of prey, peregrine
falcon populations plummeted in the mid-
20th century following the introduction
of the pervasive pesticide known as DDT
(dichlorodiphenyltrichloroethane). For many
birds, the pesticide caused their eggshells to
thin, ultimately lowering their reproductive
success.25
In response to environmental and human health
concerns, most uses of DDT were restricted in
North America in the mid-1970s, and the chemical
was entirely phased out by 1990.26 But by then, the
population of peregrines had become so depleted,
the birds needed additional species-specific
conservation actions to aid in their recovery —
specifically, captive breeding and reintroduction.27 As
a result, peregrine falcons (Falco peregrinus anatum/
tundris) dramatically increased in abundance since
the 1970s. They’re now considered Not at Risk by
COSEWIC.28
LIVING PLANET REPORT CANADA 2020 — WILDLIFE AT RISK 23UNDERSTANDING THE
NATIONAL TREND
The Canadian Living Planet Index is an average natural equilibrium of
of trends in abundance for monitored vertebrate ecosystems, resulting
populations over time. Importantly, the aggregated in a catastrophic loss
overall trend is a composite of both increasing of species and in some
and decreasing trends in vertebrate populations cases, significant
of varying magnitude and frequency. For increases. Some wildlife
example, wolverines in southern and eastern populations have
Canada have generally declined in abundance, reported declining
yet they’ve exhibited more stable trends in the trends of nearly
© Erwin Hesry
territories and may even be increasing in central 100 per cent (e.g.,
Canada (northern Ontario and Manitoba). 29 Northern bobwhite
Nonetheless, wolverines in Canada have been and little brown bat),
collectively assessed as Special Concern, as they are while others have increased by similar or greater
particularly sensitive to human disturbance, and proportions (e.g., trumpeter swan). It’s important
increasingly threatened by habitat fragmentation, to note that a species can only decline by 100 per
harvest pressure and climate change.30 cent but can increase boundlessly. For instance,
geese have increased by 360 per cent in Canada.31
Closer examination of the C-LPI data reveals that
Some species whose populations are increasing
415 of the 883 (47 per cent) vertebrate species
were the focus of large-scale policy changes, such
included in the analysis declined in abundance
as harvest bans (e.g., humpback whale), protected
from 1970 to 2016 (Figure 2c). By contrast, 48
area establishment (e.g., whooping crane) and
per cent (427 of 883) of species have increasing
elimination of persistent organic pollutants
trends on average, and five per cent (41 of 883)
(e.g., peregrine falcon); others, such as raccoons,
are considered stable (within five per cent of the
striped skunks and coyotes, simply fare well in
baseline) (Figure 2c). The equal split of increasing
human-built environments; and further species
and declining trends is anticipated to some degree,
benefited from more targeted conservation action
showcasing some form of equilibrium for the
at local scales (for example captive breeding and
diverse set of ecosystems within Canada. Still,
reintroduction as well as habitat restoration).
anthropogenic activity has considerably shiftedNational
the
0% 20% 40% 60% 80% 100% 0
Decrease Increase Stable
Figure 2c. Relative proportion of species with decreasing, increasing and stable trends.
COSEWIC
24 LIVING PLANET REPORT CANADA 2020 — WILDLIFE AT RISKHUMAN ACTIVITY
HAS SHIFTED
THE NATURAL
EQUILIBRIUM OF
ECOSYSTEMS
© Vincent Van Zalinge
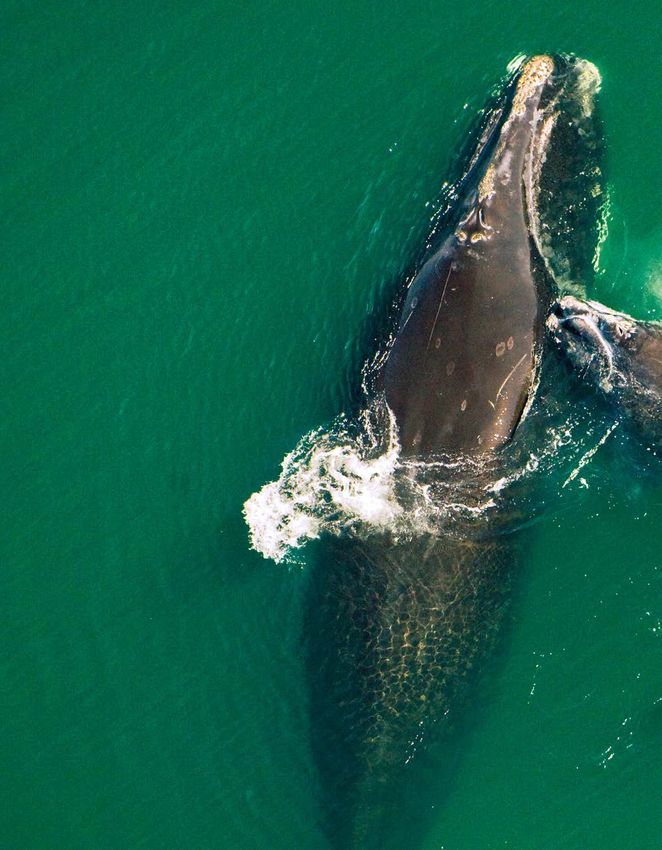
LIVING PLANET REPORT CANADA 2020 — WILDLIFE AT RISK 25HUMPBACK WHALE
© Vivek Kumar
(Megaptera novaeangliae)
COSEWIC Status: Not at Risk/Special Concern
IUCN Red List Status: Least Concern
Commercial whaling depleted humpback whale These international efforts and national protection
populations, which were prized for their blubber, in measures in both Canada and the US have helped
the early 20th century. To deal with overharvesting to reverse the decline of humpback populations.
while accounting for migratory behaviour and global While humpbacks still face several threats, including
distribution, the humpback whale became legally vessel strikes, entanglement in fishing gear and
protected under two international conventions. noise pollution,33 the introduction of legislation and
Commercial harvesting of humpbacks was banned international cooperation helped to save the species
in 1955 in the North Atlantic and in 1966 in the from the brink of extinction in the mid-20th century.
North Pacific.32
26 LIVING PLANET REPORT CANADA 2020 — WILDLIFE AT RISK© Shutterstock
SHIFTING BASELINES
The “shifting baseline syndrome” coined by Daniel a period of especially low population numbers —
Pauly34 notes that the baseline by which we judge an increase from 1970, then, doesn’t necessarily
and determine population trends affects our mean the population has reached its historical
perception of the state of ecosystems. We perceive level. For instance, swift foxes were declared
a loss relative to the standard that we set, and extirpated (locally extinct) in Canada in the 1970s,
consequently lose the knowledge of a less disturbed but through dedicated captive breeding and
historical state — meaning that we’re adjusting reintroduction programs the swift fox population
baselines to new levels dependent upon the current had grown to 647 by 2009. Yet, despite an increase
state of wildlife, but are unable to recall how our in abundance since 1970, the species is still
ecosystems flourished historically. considered Threatened due to its small population
size and highly restricted distribution.35 The use
In the C-LPI, we use a benchmark year of 1970
of 1970 as a baseline year, then, may not fully
as the basis of our analysis of trends in wildlife
represent the complete picture of wildlife trends
populations. This is largely due to limited data
in Canada. The consideration of historical trends
availability before that date. In interpreting
(i.e., a baseline prior to 1970) is likely to reflect a
the results of the C-LPI, the timeframe of 1970
greater loss of wildlife in Canada — consistent with
to 2016 represents a comparatively small and
the growing evidence that biodiversity, globally, is
recent analysis of the trends in Canada’s wildlife
declining faster than at any other time in human
populations. For some of the species included in
history.36
the C-LPI, the baseline year of 1970 may capture
LIVING PLANET REPORT CANADA 2020 — WILDLIFE AT RISK 27A FOCUS ON AT-RISK SPECIES
Biodiversity is important for the health and are a greater number of populations experiencing
resiliency of ecosystems and the critical planetary more substantial rates of decline than those with
services they provide. The loss of a single, keystone more moderate and incremental declines. (For
species — one that has a disproportionately large more information on this analysis, please refer
effect on the natural environment — can have to WWF-Canada’s C-LPI Technical Supplement.)
detrimental effects throughout the ecosystem. Understanding the magnitude and rate of
At WWF-Canada, it’s our responsibility as a decline of these species is crucial for evaluating
conservation organization to focus on those species the impact of wildlife threats, identifying the
that are in decline — an approach that’s needed necessary conservation actions for their recovery
to prevent the imminent loss of species in Canada and tracking progress against international
(either local extirpation or global extinction). biodiversity goals.
According to the data underlying the C-LPI, there
© Kevin Schafer/WWF
28 LIVING PLANET REPORT CANADA 2020 — WILDLIFE AT RISK© Shutterstock
WE ARE IN A
GLOBAL BIODIVERSITY CRISIS.
IN RESPONSE, THIS REPORT FOCUSES
ON SPECIES AT RISK OF EXTINCTION TO
BETTER UNDERSTAND THEIR POPULATION
TRENDS AND THE INCREASING THREATS
THEY FACE IN CANADA
LIVING PLANET REPORT CANADA 2020 — WILDLIFE AT RISK 29© Shutterstock 30 LIVING PLANET REPORT CANADA 2020 — WILDLIFE AT RISK
CHAPTER 3

NATIONALLY ASSESSED
AT-RISK SPECIES
The 2017 LPRC focused on species legally listed under Canada’s
federal Species at Risk Act (SARA), and found continued declines
in these wildlife populations during the period of 2002–2014,
despite protections under the Act.37 In this 2020 report, we take
a broader look at species of conservation concern in Canada by
examining trends in wildlife populations that are scientifically
assessed as being at risk by the Committee on the Status of
Endangered Wildlife in Canada (COSEWIC).

COSEWIC is an independent advisory panel to        population size, spatial distribution and threats.38
the Minister of the Environment and Climate        Species categorized as Special Concern, Threatened
Change Canada. It has been operating since         and Endangered are considered to be at risk of
1977 but was legally established as an advisory    extinction.39
body under SARA in 2003. The committee uses
                                                   There is a crucial difference between COSEWIC-
the best available scientific and Indigenous
                                                   assessed and SARA-designated species: while
knowledge to assess species against the criteria
                                                   some species may be scientifically identified as
for the following statuses: Extinct, Extirpated,
                                                   meeting the criteria of being imperiled or in need
Endangered, Threatened, Special Concern,
                                                   of dedicated conservation efforts for recovery, only
Not at Risk or Data Deficient. COSEWIC meets
                                                   a subset of those species are officially recognized
biannually to evaluate the status of candidate
                                                   and assigned protections by the federal legislation.
species — Canadian plants and animals — based
                                                   In some cases, the difference between these two
on expert advice. Evaluations consider several
                                                   groups of at-risk species can be attributed to the
biodiversity elements including trends in

                                                     LIVING PLANET REPORT CANADA 2020 — WILDLIFE AT RISK   31
SARA listing process itself, which has often seen While it is anticipated that the LPI for this group significant delays between scientific assessments of species is likely to exhibit a declining trend, it is and species receiving legal protections under important to gain insight into the magnitude of the the Act. However, the pace of SARA listing decline. An understanding of the extent of declines of COSEWIC-assessed at-risk species has in this broader group of COSEWIC-assessed considerably improved over the last four years.40 at-risk species is key to determining appropriate In addition, differences between these two groups conservation efforts, rather than focusing solely on of at-risk species can be attributed to systemic those that have received legal protections to date biases in the SARA listing process — particularly under SARA. for fish species threatened with overexploitation, which often do not receive protections under the federal Act.41 CANADIAN LPI FOR NATIONALLY ASSESSED AT-RISK SPECIES The Canadian Living Planet Index (C-LPI) for nationally assessed at-risk species in Canada shows that populations have declined, on average, by 59 per cent between 1970 and 2016 (from 1.0 in 1970 to 0.41 in 2016; Figure 3a). The index includes 629 populations of 139 COSEWIC-assessed at-risk vertebrate species — representing just over half of at-risk vertebrate species in Canada. Results suggest that the decline is consistent across species groups (birds, fish, mammals, and amphibians and reptiles) (Figure 3b). The average trend includes species that are both increasing (30 per cent) and decreasing (68 per cent) in abundance (Figure 3c). The index is reflective of species currently assessed as at risk and does not include species that have improved in population size to the point where they are no longer considered at risk (
COSEWIC
2
1.8
1.6
1.4
Index Value
1.2
1
0.8
0.6
0.4
National
0.2
0
1970
1972
1974
1976
1978
1980
1982
1984
1986
1988
1990
1992
1994
1996
1998
2000
2002
2004
2006
2008
2010
2012
2014
2016
0% 0% 10% 20% 30% 40% 50% 60% 70% 80% 90% 100%
Birds Fish Ma Year
mmals Amphibians & Reptiles
Figure 3a. The C-LPI of COSEWIC-assessed at-risk species in Canada shows an average decline of 59 per cent (confidence interval
range: -70 to -44 per cent) between 1970 and 2016. Trend in population abundance for 629 population time-series of 139 native
vertebrate species. The Species at Risk Act was enacted in 2002. National
COSEWIC
0% 20% 40% 60% 80% 100%
0% 0% 10% 20% 30% 40% 50% 60%Stable 70% 80% 90% 100%
Decrease Increase
Birds Fish Ma mmals Amphibians & Reptiles
Figure 3b. Relative proportion of taxonomic groups included in the analysis (139 species).
COSEWIC
IUCN
0% 20% 40% 60% 80% 100%
0% 0% 10% 20% 30% 40% 50% 60%Stable 70% 80% 90% 100%
Decrease Increase
Figure 3c. Relative proportion ofBirds Fish
species with decreasing, Ma mmals
increasing Amphibians
and stable trends. & Reptiles
In addition to creating a C-LPI specific to IUCN as Not at Risk have increased by 82 per cent on
nationally assessed at-risk species, Conservation
a C-LPI Effort
average from 1970 to 2016 (see WWF-Canada’s
was created for species that had been assessed C-LPI Technical Supplement).
by COSEWIC but were not considered at risk.
Species
0% assessed as Not
20%at Risk by COSEWIC 40% were 60% 80% 100%
evaluated and found not to be at risk of extinction
0% 0% 10% 20% 30% Decrease 40% 50%
Increase 60%Stable 70% 80% 90% 100%
given current trends in population abundance
and distribution. Populations
Birdsof species
Fish classified
Ma mmals Amphibians & Reptiles
Conservation Effort
LIVING PLANET REPORT CANADA 2020 — WILDLIFE AT RISK 33UNDERSTANDING THE DRIVERS OF
EXTINCTION RISK IS KEY TO
DETERMINING APPROPRIATE
CONSERVATION EFFORTS
© Andrew DuBois
34 LIVING PLANET REPORT CANADA 2020 — WILDLIFE AT RISKCHAPTER 4
IDENTIFICATION OF THREATS
Successful recovery of at-risk species is dependent on
the effective mitigation of threats — the factors that
are responsible for population declines.42 Despite our
knowledge of the major drivers of species decline, many of
them remain pervasive and have accelerated since 1970.43 44
Identifying and quantifying these threats can help guide
conservation actions that maximize species recovery.
In 2008, IUCN released a Threats
Classification Scheme (Version 3.2) to
systematically identify the direct drivers of
QUANTIFYING THREATS
species declines.45 The Threat Classification The IUCN Threats Classification Scheme
Scheme identifies the stressors — namely (Version 3.2) was used to categorize
the industries (e.g., agriculture, forestry, threats to COSEWIC-assessed at-risk
fisheries, mining) and human infrastructural species based on information from their
developments (e.g, roads, cities, dams) — respective COSEWIC Status Reports.
that contribute to a given overarching threat The identified threats are specific to the
(e.g., habitat loss and fragmentation) so that Canadian context.
action may be directed accordingly. Threats
that affect population trends can differ in
their severity and may be historical, ongoing
or emerging.
LIVING PLANET REPORT CANADA 2020 — WILDLIFE AT RISK 35INTERACTING DRIVERS
OF DECLINE
COSEWIC-assessed at-risk species are affected the complexity of interacting drivers of population
by multiple, cumulative pressures. These species trends, recognizing that feedback loops may
have been impacted by five threats on average, exist.48 For instance, the western tiger salamander
with some variation among the taxonomic groups (prairie/boreal population) is most acutely affected
(Figure 4a). Generally, amphibians and reptiles by dams and water management, but is also
were the most threatened taxonomic group, with impacted by other anthropogenic threats including
many species in the group exposed to several pollution, invasive species, road mortality, climate
different threat types — seven on average. Eighty- change and agricultural activity.49 The cumulative
seven per cent of species were impacted by more and cascading effects of these threats may be more
than one threat. Recent research suggests that detrimental than the individual threats — if a
threats to species — particularly pollution — may population is already facing habitat loss, this can
be under-reported in COSEWIC reports46 and be compounded by the effects of climate change,
therefore the threats analysis may represent a which may further restrict its range. Conservation
conservative evaluation of threats to wildlife in actions that target only a single threat are unlikely
Canada. to successfully stop and reverse wildlife declines
as threats to species are often cumulative or
Given that most populations, especially those
synergistic and can have cascading effects.50
designated as at risk of extinction, are affected by
multiple stressors,47 it is important to understand
12
10
8
Threats (Count)
6
4
2
0
Figure 4a. Number of threats impacting COSEWIC-assessed at-risk species in Canada. Lines represent median values, and Xs represent
average values. While the LPI includes 139 species, threat data were only available for 132 of these species.
36 LIVING PLANET REPORT CANADA 2020 — WILDLIFE AT RISKWOOD TURTLE
© Shutterstock
(Glyptemys insculpta)
COSEWIC Status: Threatened
IUCN Red List Status: Endangered
Wood turtles are semiaquatic freshwater turtles that corridors, both of which cause habitat loss and direct
inhabit both riparian (along the banks of rivers) and mortality. Wood turtles prefer habitats with short
terrestrial habitats. As a long-lived species with a late vegetation (early successional habitat) for foraging
sexual maturity, they are vulnerable to population and nesting, but may experience increased risks of
changes. As a result, any adult mortality above the mortality if these habitats are scarce and require
natural rate can dramatically cause population travelling longer distances to find these habitats. As
declines. vegetation grows taller over time, wood turtles are
forced to find areas with shorter vegetation and may
The species is impacted by several threats that
risk more road crossings (which may lead to collisions
have cumulatively led to an overall decline in
with cars) or instead nest in agricultural fields (which
abundance. In fact, the population faces nine of
may lead to collisions with tractors).52 They are also
the eleven threat categories listed in its COSEWIC
subject to illegal collection for the pet trade, forest
Status Report.51 While some of the listed threats are
harvesting, changes in stream flow, problematic native
considered to have an overall low impact, together
species and floods.53
they have resulted in an overall high threat level for
the wood turtle within Canada. Wood turtles are most
acutely affected by agriculture and transportation
LIVING PLANET REPORT CANADA 2020 — WILDLIFE AT RISK 37THREATS
OVEREXPLOITATION TRANSPORT (TR):
(OE): Exploitation of biological Transportation and service
resources at unsustainable corridors and the vehicles that
levels, including both deliberate use them, including roads and
and unintentional harvesting railroads, utility and service
effects (e.g., bycatch). Includes lines, shipping lands and flight
unsustainable fishing, hunting, paths.
gathering and collecting, in
HUMAN DISTURBANCE
addition to logging and wood
(HD): Human activities
harvesting.
that result in habitat loss
INVASION AND DISEASE and degradation including
(ID): Invasive and other recreational activities and
problematic species, genes and military exercises.
diseases.
AGRICULTURAL ACTIVITY
POLLUTION (PO): Threats (AG): Agricultural expansion
from the introduction of and intensification due to
materials or energy from both farming, ranching, silviculture,
point and non-point sources, mariculture, aquaculture, and
including domestic and urban annual and perennial crops.
wastewater, industrial and
ENERGY PRODUCTION
military effluents, agricultural
(EP): Exploration, development
and forestry effluents, garbage
and production of minerals and
and solid waste, air-borne
rocks (mining and quarrying),
pollutants, and excess energy
petroleum and other liquid
(e.g., light, noise, etc.).
hydrocarbons (oil and gas
CLIMATE CHANGE (CC): drilling), and renewable energy.
Linked to global warming and
SYSTEM MODIFICATION
other severe climatic events
(SM): Modification of natural
including droughts, floods, sea-
systems including fire and
level rise and tundra thawing.
fire suppression, dams and
URBAN DEVELOPMENT water management, and other
(UD): Human settlements (e.g., modifications to improve human
housing, offices, schools, etc.), welfare.
factories and other commercial
GEOLOGICAL EVENTS
centers, and tourism and
(GE): Catastrophic geological
recreational sites.
events including volcanoes,
earthquakes, tsunamis,
avalanches and mudslides.
*Based on the IUCN Threats Classification 3.2
38 LIVING PLANET REPORT CANADA 2020 — WILDLIFE AT RISKOVEREXPLOITATION
The most frequent threat facing COSEWIC- for commercial or subsistence value56 57 58 such as
assessed at-risk species was overexploitation fish or northern mammals — are frequently denied
(Figure 4b) — this is particularly true for fish legal protection under the Species at Risk Act.
(Figure 4c), which is anticipated given that The irony is that the greatest threat to Canadian
monitored fish populations included in the C-LPI wildlife — direct or in-direct harvest — is also
are primarily those of commercial interest, and frequently the rationale for not affording legal
are thus far more likely to be overexploited. protections to ensure the long-term persistence of
Overexploitation is the deliberate and/or species. This bias in the SARA listing process has
unintentional harvesting of biological resources not improved over time.59
(flora and fauna) at unsustainable levels —
To reiterate, the IUCN Threat Classification
activities such as logging, fishing and hunting.
Scheme identifies industries and human
Unintentional or indirect overexploitation includes
infrastructural developments that contribute to
things like bycatch, where species (like turtles or
an overarching threat so that action can be more
sea birds) are unintentionally caught in a fishing
appropriately directed. To that end, habitat loss
net. Research suggests that overexploitation is
caused by land use and land-use change (or sea use
also the most prevalent threat facing many at-risk
and sea-use change) is also a predominant driver
species in Canada54 and around the world (it is
of biodiversity loss that is embedded within most
considered a “Big Killer”).55
of the 11 threat categories.
Many species that have been assessed as at risk by
COSEWIC — particularly those that are harvested
GE
AG
OE
HD
EP ID
UD
PO
SM
TR CC
Figure 4b: Types of threats as a per cent of all threats faced by COSEWIC-assessed at-risk species in Canada. While the LPI includes 139
species, threat data were only available for 132 of these species.
LIVING PLANET REPORT CANADA 2020 — WILDLIFE AT RISK 39Birds Fish
UD UD
CC AG CC AG
GE EP GE EP
PO TR PO TR
ID OE ID OE
SM HD SM HD
Amphibians & Reptiles Mammals
UD UD
CC AG CC AG
GE EP GE EP
PO TR PO TR
ID OE ID OE
SM HD SM HD
Figure 4c. Proportion of COSEWIC-assessed at-risk species exposed to each of the 11 threat categories, organized by taxonomic group.
A large surface area indicates that a taxonomic group is exposed to many threats. The closer a polygon is to a particular threat, the
more species in the group are exposed to that threat. While the LPI includes 139 species, threat data were only available for 132 of
these species.
40 LIVING PLANET REPORT CANADA 2020 — WILDLIFE AT RISKYou can also read