Local impact, global leadership - The impact of wind energy on jobs and the EU economy - WindEurope
←
→
Page content transcription
If your browser does not render page correctly, please read the page content below
Local impact,
       global leadership
The impact of wind energy on jobs and the EU economy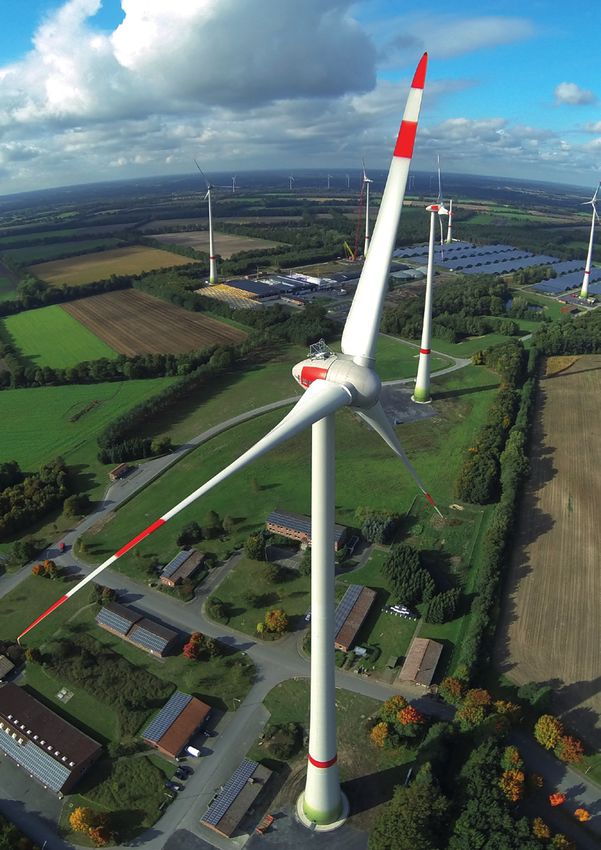
Local impact, global leadership
   The impact of wind energy on jobs and the EU economy

                       November 2017

                     windeurope.org
The socio-economic impact evaluation of Wind Energy on
the European Union has been carried out using the SNA93
methodology (System of National Accounts adopted in 1993
by the United Nations Statistical Commission) and Deloitte´s
approaches, which evaluate the effects of renewable energies
in the economy.

Deloitte accepts no responsibility or liability towards any third
party that would have access to the present document and
could consequently take harmful decisions or actions without
Deloitte´s knowledge.

Deloitte refers to one or more of Deloitte Touche Tohmatsu
Limited, a UK private company limited by guarantee (“DTTL”), its
network of member firms, and their related entities. DTTL and
each of its member firms are legally separate and independent
entities. DTTL (also referred to as “Deloitte Global”) does not
provide services to clients. Please see www.deloitte.com/about
for a more detailed description of DTTL and its member firms.

© 2017 Deloitte Advisory, S.L.

WindEurope has joined a climate neutral printing program.
It makes choices as to what it prints, and how, based on
environmental criteria. The CO2 emissions of the printing
process are then calculated and compensated by green emission
allowances purchased from a sustainable project.

DATA AND ANALYSIS:
Enrique Doheijo, Deloitte Advisory, S.L.
Jesús Rubio Conde, Deloitte Advisory, S.L.

MAIN AUTHORS:
Ariola Mbistrova, WindEurope
Ivan Pineda, WindEurope

REVISION:
Pierre Tardieu, WindEurope
Colin Walsh, WindEurope
DIRECTION:
Ivan Pineda, WindEurope
DESIGN:
Lin Van de Velde, drukvorm.be

INFOGRAPHICS:
Wembo Vereeken, WindEurope
PHOTO COVER:
Vestas

MORE INFORMATION:
policy@windeurope.org
+32 2 213 18 11
CONTENTS....................................................................................................................................... 3
CONTENTS
           EXECUTIVE SUMMARY.............................................................................................................. 4
           1     INTRODUCTION..................................................................................................................... 11
           2     WIND ENERGY TODAY AND FUTURE GROWTH................................................... 13
           3     THE IMPACT OF THE WIND ENERGY INDUSTRY ON THE EU ECONOMY.... 17
                 3.1       Direct impact of the wind energy industry on EU GDP............................... 21
                 3.2 Direct impact of wind energy sub-sectors on EU GDP............................... 22
                           3.2.1       Wind energy developers ................................................................................ 24

                           3.2.2       Wind turbine manufacturers ........................................................................ 27

                           3.2.3       Component manufacturers ........................................................................... 29

                           3.2.4       Service providers............................................................................................. 31

                           3.2.5       Offshore wind energy substructures............................................................ 32

                 3.3 Indirect contribution to GDP.................................................................................. 33
           4     WIND ENERGY EXPORTS AND IMPORTS................................................................. 37
           5     IMPACT OF THE EU WIND ENERGY INDUSTRY ON JOBS............................... 44
           6 INVESTMENT IN R&D ACTIVITIES................................................................................. 49
                 6.1. EU wind energy sector R&D investment ............................................................. 49
                 6.2. EU wind energy sector patents ............................................................................. 50
           7     AVOIDING CO2 EMISSIONS AND REDUCING FOSSIL FUEL IMPORTS....... 52
           8 TAX BALANCE........................................................................................................................ 55
           9 WIND ENERGY'S CONTRIBUTION TO THE EU ECONOMY
             IN 2020 AND 2030.............................................................................................................. 57
           INDEX OF FIGURES..................................................................................................................... 63
           ANNEXES.......................................................................................................................................... 65
                 Data sources............................................................................................................................ 65
                 Methodology............................................................................................................................ 66
                 Direct contribution to GDP................................................................................................. 67
                 Indirect contribution to GDP.............................................................................................. 69
                 GDP contribution of the wind industry in real and current prices ................... 72
                 Legal establishments of EU companies abroad....................................................... 73
EXECUTIVE
    SUMMARY

    Wind energy has transitioned in the last decade from a                 The significant international competition, alongside local
    niche technology to an industrial sector that provides                 content requirements and supply chain constraints, have
    Europe with clean, competitive and reliable energy. In the             limited the growth potential of European wind turbine
    process Europe has built up a world-beating wind energy                and component manufacturers in markets outside the EU.
    industry with turbine manufacturers that lead the global
    market, developers with an international footprint and                 As the wind energy supply chain shifts to markets outside
    unmatched research and innovation capability.                          the EU, Europe risks losing the existing jobs and positive
                                                                           trade balance that wind energy has brought. European
    This remarkable development has yielded considerable                   governments should respond with policies that will revive
    benefits to the European economy, generating revenue                   the local market and preserve the economic benefits. For
    to local communities, creating tens of thousands of high-              Europe to cement its domestic leadership in wind energy
    skilled jobs and reducing Europe’s fuel import dependency.             there needs to be a strong domestic market.

    However, international competition in wind energy has                  This report details the economic footprint of the wind
    intensified in recent years. The growth of wind globally has           sector from 2011 to 2016 to inform the discussions
    not translated into more exports for EU manufacturers.                 on Europe’s energy future as part of the Clean Energy
    The share of EU content in global installed capacity has               Package1. It also recommends the policy and other
    fallen by 30% since 2011.                                              measures that are needed to ensure Europe gets the most
                                                                           out of wind energy.

      1.   For economic indicators from 2007 to 2011 see the Green Growth report
           (available at http://www.ewea.org/fileadmin/files/library/publications/reports/Green_Growth.pdf)

4   Local impact, global leadership. The impact of wind energy on jobs and the EU economy
    WindEurope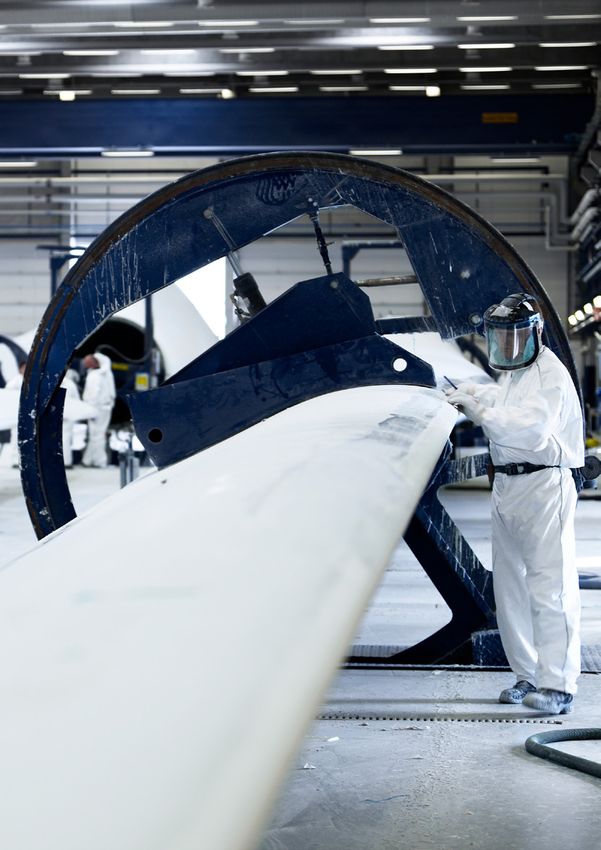
Executive summary

                                                                            R&D spending has consistently represented around
Boosting the European economy                                               5% of the industry’s GDP, well above the economy-
                                                                            wide average of 2%. It is also considerably higher than
• The wind energy industry contributed (directly and                        the EU’s objective of 3% of GDP being invested in R&D.
   indirectly) €36.1bn to the EU's Gross Domestic Product
   (GDP) in 2016. That is 0.26% of the overall EU GDP.
                                                                     Reducing energy dependency and cutting CO2 emissions
• The direct contribution was €22.3bn in 2016, up from
   €16.7bn in 2011. This 33% growth was four times                    • Wind energy displaces electricity generated by fossil
   higher than the EU's GDP growth over the period.                         fuels. This not only reduces CO2 emissions but also
                                                                            avoids the cost of buying those fuels.
• The indirect contribution of wind energy to the EU
   GDP was €13.8bn in 2016. Every €1,000 of revenue in                • In 2016 wind energy avoided 34,578 ktoe (kilotonne
   wind energy creates €250 of economic activity in other                   of oil equivalent) fossil fuel imports in the EU, and a
   industrial sectors, including electrical equipment and                   total of 171,951 ktoe for the period 2011-2016. This
   machinery, metals, construction and engineering.                         translates to €32bn in cost savings over the period.

Cementing global leadership                                          Contributing with taxes

• In 2016 the European wind energy industry exported                  • The wind energy industry contributed €4.9bn in taxes
   €7.8bn and imported €5.4bn worth of products and                         to the EU economy in 2016. These include mostly
   services.                                                                corporate and income taxes, but also regional, local
                                                                            and property taxes. Taxes paid by the wind energy
• While the industry remains a global net exporter                          sector have grown by 46% between 2011 and 2016.
   with a €2.4bn positive trade balance, imported wind
   energy inputs have increased from 13% of total
   industry expenditure in 2011 to 16% in 2016.                      Capitalising on global leadership while delivering on
                                                                     Europe's 2030 Climate and Energy objectives
• Over 80% of European wind energy companies have a
   commercial presence and manufacturing sites outside                • The wind energy industry will continue to be a driver
   of Europe in more than 80 countries. Of the 10 biggest                   for economic growth over the coming years.
   wind turbine manufacturers in the world, five are EU-
   based.                                                             • By 2030 the wind industry’s contribution to the EU's
                                                                            GDP could double and the sector could generate
                                                                            0.51% of the EU’s GDP whilst potentially doubling
Creating jobs in Europe                                                     employment under the Central Scenario3.

• Wind energy has created jobs, not only in turbine
   manufacturing and electricity production, but also in
   many other industries and economic sectors. In 2016
   the wind energy industry accounted – both directly
   and indirectly – for 262,712 jobs in the EU.

An innovation hub for Europe2

• The wind energy industry spent 4.9% of its GDP on
   research and development (R&D) activities in 2016.

  2.   Modified on April 2018
  3.   See WindEurope's report "Wind Energy in Europe: Scenarios to 2030"

                                               Local impact, global leadership. The impact of wind energy on jobs and the EU economy   5
                                                                                                                          WindEurope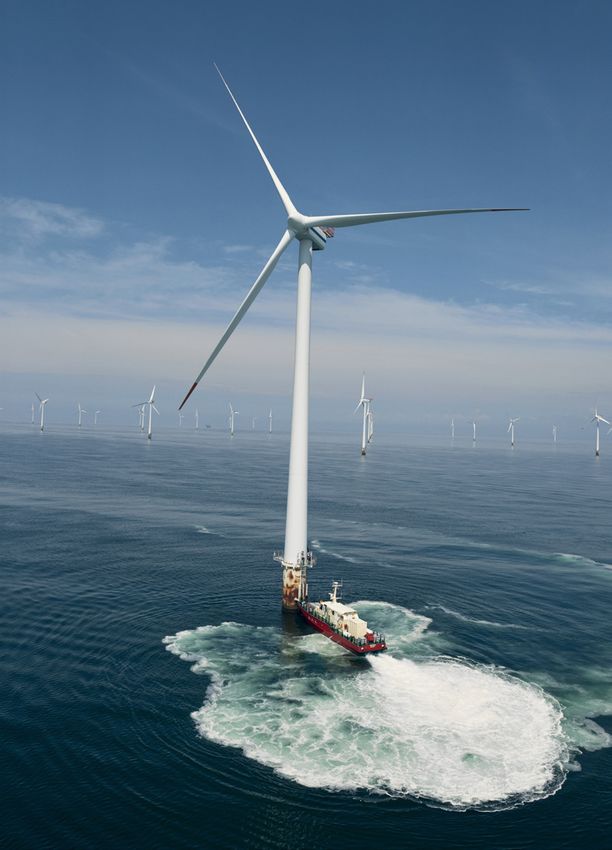
Executive summary

                              POLICY RECOMMENDATIONS
        Ensuring a cost effective energy transition while maintaining Europe’s global leadership in wind energy will require
        a comprehensive and ambitious EU Clean Energy Package. The EU must also make a clear choice in favour of
        the renewables-based electrification of heating, cooling and transport, while ensuring its trade, industrialisation,
        research and innovation policies underpin its Climate and Energy ambitions.

         • The EU should raise its 2030 renewable energy                 • Member States should stop capacity payments
             target to at least 35% of the final energy demand              to polluting power plants through the adoption
             by 2030.                                                       of an Emissions Performance Standard of
                                                                            550 g CO2/kWh.
         • EU Member States should adopt early National
             Energy and Climate Action Plans based on                    • Europe should realign the Emissions Trading
             a binding template that provides clarity to                    System to deliver the Paris Climate Agreement.
             investors on the post-2020 market volumes,
             including repowering and lifetime extension.                • The next EU Multiannual Financial Framework
                                                                            should ensure that research and innovation
         • The post-2020 Renewable Energy Directive                         policy and other funding instruments, in
             should mandate Member States to set a forward                  particular for energy and transport infrastructure,
             schedule for renewable energy support with at                  drive the transition to a decarbonised energy
             least three years' visibility.                                 system.

         • The post-2020 Renewable Energy Directive                      • Europe’s trade policy should tackle export barriers,
             should set clear design rules for renewable energy             in particular local content requirements, which
             support mechanisms, including technology-                      undermine the cost-effectiveness of the wind
             specific tenders.                                              industry’s supply chain and its competitiveness
                                                                            vis-à-vis conventional energy.
         • In order to support existing investments in wind
             energy and other renewables, market design                  • The EU's industrial policy should continue
             rules should maintain prority dispatch for                     to focus on innovation, digitalisation and
             existing wind power plants and ensure new                      decarbonisation.
             ones are curtailed last with a market-based
             approach.

6   Local impact, global leadership. The impact of wind energy on jobs and the economy
    WindEurope
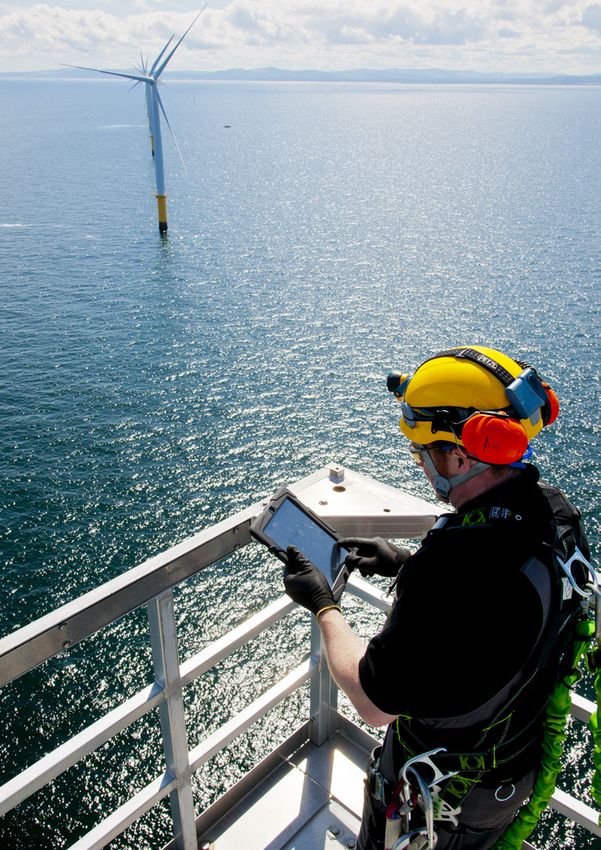
Photo: Siemens Gamesa Renewable Energy
THE IMPACT OF WIND ENERGY                                                                                                                                                    FIGURE 1

                    ON JOBS AND THE EU ECONOMY                                                                                   BOOSTING
                                                                                                                          THE EUROPEAN ECONOMY
                                            CREATING JOBS                                                                           2016: €     36.1bn
                                      2016:    262,712 jobs                                                                              GDP contribution

                                                                                                                                              €
                         A NET EXPORTER                                                                                                         AN INNOVATION HUB
                           2016:    €2.4bn                                                                                               2016:   4.9% of industry’s GDP                 4

                                                                                                                                                    goes to R&D activities

                                                                                                                       REDUCING FUEL DEPENDENCY
                                               REDUCING CO2 EMISSIONS
                                                                                                                                   2016: €    5bn
                                                     2016:    166 Mt CO2                                                         Cost savings to the EU

                                                                                         4.   Modified on April 2018

8   Local impact, global leadership. The impact of wind energy on jobs and the economy                                   Local impact, global leadership. The impact of wind energy on jobs and the economy   9
    WindEurope                                                                                                                                                                                  WindEurope
Photo: Vestas
1.
INTRODUCTION
Europe installed 160 GW of wind power capacity during • The indirect contribution to other GDP sectors:
the last 20 years thanks to the emergence of a quickly metallurgy, electronic equipment providers, chemical
maturing industry. 31% of the global installed wind industry, financial services, professional services and
capacity is in Europe. 46% of the global installed wind so on;
capacity is manufactured by European companies.
• Comparison of the wind energy sector’s contribution
This industrialisation has brought wind energy costs to GDP with that of other economic sectors;
down at a remarkable pace. Onshore wind energy is the
cheapest source of new power capacity in many places • Direct and indirect contribution to job creation in the
in Europe today. Offshore wind is not far behind: auction different wind industry sub-sectors, as well as related
prices in 2016-2017 fell significantly below the industry's economic sectors;
cost reduction target of €80/MWh.
• Impact on the European Union trade balance: exports
The wind energy industry is contributing to a fundamental and imports;
transformation of the European energy sector. It also
represents a growing industrial sector supporting 262,712 • Research and development (R&D) effort in the wind
jobs and making a notable direct and indirect contribution energy industry compared to the rest of the EU
to the European economy. economy;
This report analyses wind energy’s contribution to the • Impact on reducing greenhouse gas emissions, fossil
EU economy over the period between 2011 and 2016. fuel consumption and energy dependency in the EU;
This contribution is measured across six indicators:
Gross Domestic Product (GDP), employment, exports, • Tax balance assessment: corporate, local and regional
tax revenues, innovation and energy dependency. These taxes.
indicators are split between onshore and offshore wind.
Between March and September of 2017 Deloitte surveyed The report also covers the socio-economic benefits of
more than 400 companies working in wind energy to WindEurope's wind energy deployment scenarios to 2030.
analyse the following: This includes direct and indirect contribution to the EU's
GDP, job creation as well as its impact on greenhouse gas
• The direct contribution of the sector and its sub- emissions and energy independence. Chapter 9 illustrates
sectors to the EU’s GDP, estimated through three the stark differences between the economic activity
different approaches: estimation of demand, associated with ambitious wind energy policies and the
production of value added to the economy and potential outcome of an unambitious set of policies at EU
estimation of income; and national level.
Local impact, global leadership. The impact of wind energy on jobs and the EU economy 11
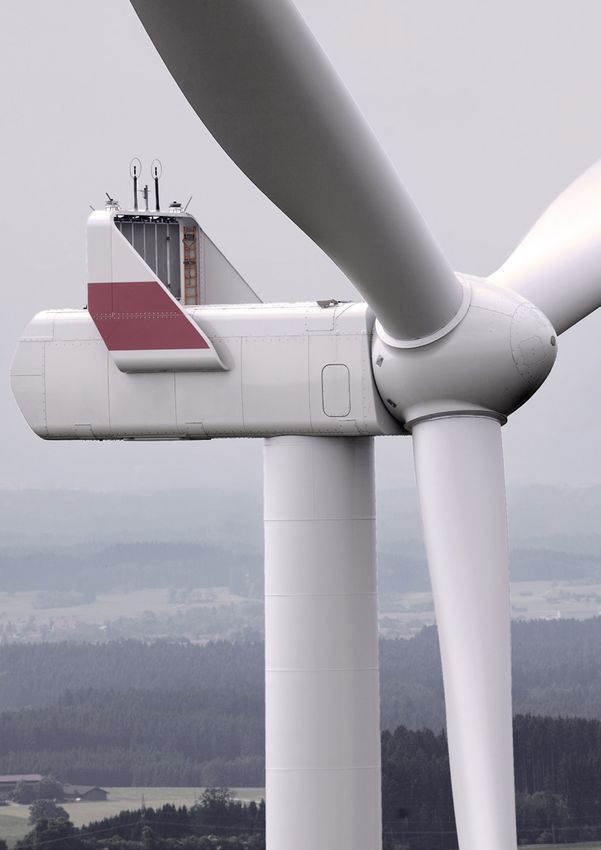
WindEuropePhoto: ENERCON
2.
WIND ENERGY
TODAY AND
FUTURE
GROWTH

With 160 GW of installed capacity at the end of June           Germany represents a third of the installed capacity in the
2017, wind energy plays a significant role in the European     EU, with 32.5%. Spain and the UK follow with 15% and
power sector. Installed capacity has grown by an average       9.5% respectively. 70% of all the wind power capacity
11 GW over the last decade. Technology costs have fallen       installed in the EU at the end of June 2017 comes from
significantly.                                                 five countries: Germany, Spain, the UK, France and Italy.
                                                               Four other countries (Sweden, Denmark, Poland, and
This deployment has been underpinned by the                    Portugal) have more than 5 GW installed. Seven other
development of an industrial base making Europe the            countries have over 1 GW of installed capacity: Austria,
global leader in wind energy. Today the EU represents 32%      Belgium, Finland, Greece, Ireland, the Netherlands and
of global onshore wind energy capacity and 86% of global       Romania.
offshore wind energy capacity. The UK alone accounts for
36% of the offshore wind capacity installed globally.          The operational wind capacity in the EU at the end of
                                                               2016 generated an average of 298 TWh of electricity,
However, growth in Europe has been uneven, leading to          enough to power 10.4% of the EU’s gross final electricity
market concentration over the years.                           consumption.

                                          Local impact, global leadership. The impact of wind energy on jobs and the EU economy   13
                                                                                                                     WindEurope
Wind energy today and future growth
WindEurope forecasts wind power capacity in the next It also assumes:
four year period to 2020 to grow at an average annual rate • Sustained progress on system integration to allow
of 12.6 GW. Installed wind capacity in the EU is expected for a higher penetration of wind energy and other
to reach 204 GW by 2020. Wind energy could be the renewables;
largest source of renewable electricity generation in 2020
and produce enough power to meet 16.5% of Europe’s • Sufficient grid infrastructure to meet the EU’s 15%
electricity needs. interconnection target;
In the long term, policy ambition and regulatory certainty • Clear policy commitments on electrification to drive
will be crucial to setting the growth rate of the European demand for renewable power;
wind energy market. Based on different levels of policy
ambition, WindEurope has developed three different • Onshore wind cost reductions to continue;
growth pathways for wind energy by 2030.
• Offshore wind cost reduction objectives to 2025 are
In the WindEurope Central Scenario wind energy could met as a result of governments providing a visible
see a doubling of onshore wind capacity and a fivefold pipeline of projects between 2020 and 2030.
increase in offshore wind capacity. Cumulative installed
wind power capacity could reach 323 GW by 2030: 253 A more ambitious High Scenario assumes favourable
GW onshore and 70 GW offshore. Wind energy could market and policy conditions including renewable energy
produce 888 TWh of electricity, meeting 30% of the EU’s deployment going beyond a 35% renewable energy
power demand. target. If this ambition were realised, a total of 397 GW
of wind energy capacity would be installed in the EU by
To achieve this, the Central Scenario assumes that the 2030, 298.5 GW onshore and 99 GW offshore. Wind
EU goes well beyond a 27% renewable energy target in energy could produce 1,129 TWh of electricity, meeting
2030 through the adoption of the Clean Energy Package 38% of the EU’s power demand.
proposals presented by the European Commission
in 2016. It relies on the implementation of a clear In contrast, a Low Scenario for wind energy sees only 256
Governance for the Energy Union with detailed National GW of wind capacity in 2030, 207 GW onshore and 49 GW
Energy and Climate Plans delivering the EU binding targets offshore. This would lead to 20% less capacity than in the
and effective regional cooperation. Central Scenario, producing only 21.6% of the EU’s power
demand in 2030 as a result.
14 Local impact, global leadership. The impact of wind energy on jobs and the EU economy
WindEuropeWind energy today and future growth
FIGURE 2
Cumulative wind power capacity in the EU: 2017 to date, 2020 forecasts and possible scenarios to 2030
400 High
scenario
350 Central
scenario
300 Low
scenario
250
200
GW
150
100
50
-
2008
2028
2009
2026
2020
2029
2030
2022
2023
2024
2025
2007
2027
2018
2016
2019
2010
2021
2012
2013
2014
2015
2017
2011
Onshore Central Offshore Central Low High
Source: WindEurope
FIGURE 3
Wind energy generation between 2007 and 2016, 2020 forecasts and possible scenarios to 2030 (TWh)
1,200
High
scenario
1,000
Central
scenario
800 Low
scenario
TWh
600
400
200
0
2008
2028
2009
2026
2020
2029
2030
2022
2023
2024
2025
2007
2027
2018
2016
2019
2010
2021
2012
2013
2014
2015
2017
2011
Onshore Central Offshore Central Low High
Source: WindEurope
Local impact, global leadership. The impact of wind energy on jobs and the EU economy 15
WindEuropePhoto: Vattenfall
3.
THE IMPACT OF
THE WIND ENERGY
INDUSTRY ON THE
EU ECONOMY

In 2016 the wind energy industry and the activities related               The deployment of wind energy also requires goods and
to it added €36.1bn to EU GDP5 in total. €22.3bn of this was              services from other economic sectors. The interaction
a direct result of activity within the wind energy industry:              of the wind energy industry with these other economic
onshore and offshore wind energy developers, turbine                      sectors generated an additional €13.8bn of indirect
manufacturers, component manufacturers, service                           economic activity.
providers, and offshore wind energy substructures.

  5.   Real prices, constant 2010 (i.e adjusted for inflation in order to enable comparisons as if prices had not changed. Changes in real terms
       exclude the effects of inflation)

                                                  Local impact, global leadership. The impact of wind energy on jobs and the EU economy            17
                                                                                                                             WindEurope
The impact of wind energy industry in the EU economy
FIGURE 4
Distribution of the EU added value generated by the wind energy industry in 2016: €bn, real prices (base 2010)
€
12.7 4.0 16.6 7.8
ONSHORE WIND ENERGY OFFSHORE WIND ENERGY WIND TURBINE
MANUFACTURERS GROSS EXPORTS
DEVELOPERS DEVELOPERS
COMPONENT MANUFACTURERS
6.3 4.8 3.4
COMPONENTS SERVICE PROVIDERS OFFSHORE WIND ENERGY
MANUFACTURERS SUBSTRUCTURES
(€bn) WIND ENERGY
TOTAL REVENUES 55.6
22.3 1.0
DIRECT EU GDP TAXES NOT LINKED TO
CONTRIBUTION CORPORATE PROFITS
€
€
€
€
€
€
15.8 6.5 5.4 26.9
GROSS OPERATING COMPENSATION PAYMENT TO NON-EU PAYMENT TO EU
SURPLUS OF EMPLOYEES SUPPLIERS SUPPLIERS
2.0 13.8 13.8
FINANCING: INDIRECT EU GDP
CORPORATE TAX
DEBT AND EQUITY CONTRIBUTION
36.1
TOTAL EU GDP
CONTRIBUTION
18 Local impact, global leadership. The impact of wind energy on jobs and the EU economy
WindEuropeThe impact of wind energy industry in the EU economy
FIGURE 5
Direct and indirect contribution of wind energy to EU GDP (real prices, constant 2010)6
40
35 14.4 13.8
13.9
15.3
30 15.2 13.4
€bn, constant prices 2010
25
22.4 22.3
20
20.1
18.4
17.7
15 16.7
10
5
0
2011 2012 2013 2014 2015 2016
Direct contribution to GDP Indirect contribution to GDP
Source: Deloitte for WindEurope
The wind industry's contribution to GDP – both direct and • Sufficient grid infrastructure to meet the EU’s 15%
indirect – has grown by 13.2% in real terms between 2011 interconnection target;
and 2016. This contribution varies with the level of new
deployment of new wind power capacity. For instance, • Clear policy commitments on electrification to drive
contribution was highest in 2015 because 2015 was a demand for renewable power;
record year for wind energy deployment.
• Onshore wind cost reductions to continue;
Having a robust European wind energy market in the
coming years will underpin a sustained contribution from • Offshore wind cost reduction objectives to 2025 are
the sector to EU GDP. A robust market requires: met as a result of governments providing a visible
pipeline of projects between 2020 and 2030.
• Ambitious Clean Energy Package;
A robust market also needs sustained, consistent, and
• Clear governance for the Energy Union with detailed visible planning to further buildout.
National Energy and Climate Plans;
Though relatively small in size, wind energy has made an
• Sustained progress on system integration to allow important contribution to the EU economy, in particular
for a higher penetration of wind energy and other during challenging economic times. The €36.1bn
renewables; generated by wind energy in 2016 could cover a quarter
of the EU's Budget that same year.
6. Current prices included in Annex 5
Local impact, global leadership. The impact of wind energy on jobs and the EU economy 19
WindEuropeThe impact of wind energy industry in the EU economy
FIGURE 6
Wind energy sector’s share of total EU GDP
60 0.27%
0.26% 0.26% 0.26%
0.26%
€bn (real prices, constant 2010)
0.25% 0.25% 0.25%
50
0.21%
40
37 36
0.18% 34
30 32 32 32 33 32
26
24
20
10
0
2007 2008 2009 2010 2011 2012 2013 2014 2015 2016
GDP Contribution Wind energy sector as a % of overall EU GDP
Source: Deloitte for WindEurope
The wind energy industry accounted for 0.26% of the By way of comparison, the basic metals industry accounts
total value of goods and services produced in the EU in for 0.48% of the EU GDP, and the chemicals industry
2016. The industry is still young, but its GDP contribution accounts for 0.94%.
is similar in size to that of entire countries, such as Croatia,
Slovenia or Lithuania.
FIGURE 7
Share of GDP of leading EU economic sectors in 2016
4.76%
1.45%
1.13%
0.94%
0.48%
0.26% 0.23%
Construction Motor Rubber, Chemicals Basic Wind energy Water
vehicles plastic metals sector collection,
products (direct + treatment
indirect) and supply
Source: Deloitte for WindEurope
20 Local impact, global leadership. The impact of wind energy on jobs and the EU economy
WindEuropeThe impact of wind energy industry in the EU economy
3.1 DIRECT IMPACT OF THE WIND ENERGY INDUSTRY
ON EU GDP
FIGURE 8
EU wind energy sector's direct contribution to EU GDP in real prices (constant 2010) and % of EU GDP from 2011 to 2016
28
0.163% 0.162%
0.154%
24 0.145%
0.138%
€bn (real prices, constant 2010)
0.130%
22.4 22.3
20
20.1
18.4
16 17.7
16.7
12
8
4
0
2011 2012 2013 2014 2015 2016
Direct contribution (real prices, €bn) % of overall EU GDP
Source: Deloitte for WindEurope
The direct contribution of the wind energy sector to the to 0.13% in 2011, and less than 0.1% in 2007, illustrating
EU's GDP was €22.3bn7 in 2016 in real prices, or €24bn in the rapid emergence of a fully-fledged industrial sector.
current prices.
The growth of the wind indutry’s contribution to GDP has
Over the last six years, the wind sector has increased its been positive for the EU economy, in particular in periods
direct contribution to GDP by 33.2% in real terms, at an of slow growth.
average annual growth rate of 6.6%.
In 2015 the wind industry's contribution to EU GDP grew
In 2016, the wind industry’s direct contribution to GDP by 11.2% on the year before, five times higher than the
was more than 0.16% of the EU’s total GDP. This compares growth of the EU’s GDP itself that year.
7. Real prices, base 2010.
Local impact, global leadership. The impact of wind energy on jobs and the EU economy 21
WindEuropeThe impact of wind energy industry in the EU economy
FIGURE 9
Growth of the wind energy industry's direct contribution to GDP indexed to 2010 (in %)
30% 27.1% 26.5%
25%
20%
14.3%
15%
10% 7.0% 7.3%
4.7%
5% 1.9%
0.4% 0.2%
-0.5%
0%
0.4%
-5.0%
5%-
10%-
2011 2012 2013 2014 2015 2016
EU GDP growth Growth of wind energy's contribution to EU GDP
Source: Deloitte for WindEurope
3.2 DIRECT IMPACT OF WIND ENERGY SUB-SECTORS
ON EU GDP
The wind energy value chain can be divided into seven offshore wind turbine manufacturers, component
sub-sectors, each representing different activities: manufacturers, services providers and offshore wind
onshore wind energy developers, offshore wind energy energy susbstructure providers.
developers, onshore wind turbine manufacturers,
FIGURE 10
Wind energy value chain
COMPONENT MANUFACTURERS
ONSHORE WIND ENERGY
DEVELOPERS
WIND TURBINE MANUFACTURERS
OFFSHORE WIND ENERGY OFFSHORE WIND ENERGY
SUBSTRUCTURES DEVELOPERS
SERVICE PROVIDERS
Source: WindEurope
22 Local impact, global leadership. The impact of wind energy on jobs and the EU economy
WindEuropeThe impact of wind energy industry in the EU economy
Different variable affect these sub-sectors in such a way Despite international competition and rapid cost
that growth of the industry across the value chain can reductions, growth has been solid for both onshore and
be uneven. The figure below shows the evolution of the offshore wind turbine manufacturers.
different sub-sectors' weight within the industry’s GDP.
In contrast, component manufacturers and service
Wind energy developers have maintained a stable weight providers have been impacted by the industrialisation of
within the industry’s GDP. While the weight of offshore the sector and the development of a global supply chain.
wind developers has increased within the industry, The economic activity in these sub-sectors, and therefore
onshore wind developers have seen their economic their weight within the industry’s and the EU GDP, has
activity fall as a share of the total sector from 41.4% in considerably declined in recent years.
2011 to 36.1% in 2016.
FIGURE 11
Relative weight of the wind industry’s sub-sectors in terms of GDP
22 100%
Offshore
wind energy
20 substructures 90%
18 Service 80%
providers
16
70%
Component
manufacturers
% within the industry's GDP
14
60%
12 Offshore
wind turbine 50%
€bn
manufacturers
10
40%
Onshore
8 wind turbine
manufacturers
30%
6
Offshore
wind energy
20%
4 developers
2 Onshore 10%
wind energy
developers
0 0%
2011 2012 2013 2014 2015 2016 2011 2012 2013 2014 2015 2016
Source: Deloitte for WindEurope
Local impact, global leadership. The impact of wind energy on jobs and the EU economy 23
WindEuropeThe impact of wind energy industry in the EU economy
3.2.1 WIND ENERGY OFFSHORE WIND ENERGY
DEVELOPERS DEVELOPERS
The activity of wind energy developers may have a direct Growth within the developers’ sub-sector came mainly
impact on other sub-sectors , notably the wind turbine from offshore wind developers, whose contribution
manufacturers, component manufacturers and service increased by almost four times between 2011 and 2016. In
providers. 2016 offshore wind produced 1.2% of the total electricity
generated in the EU and €2.4bn in the EU’s GDP.
To avoid double counting, the money that wind energy
developers pay towards these suppliers is counted as part Technological innovations and sector maturity have made
of these other sub-sectors' contribution to GDP. it possible for the offshore wind industry to deliver – and
exceed – its cost reduction commitments. Figure 14 shows
In 2016 wind energy developers represented 47% of that between 2011 and 2016, offshore wind developers’
the industry’s total contribution to GDP, up from 45% in revenue per unit of energy generated has declined by
2011 (Figure 12). Their revenues increased over the last 10%. But their GDP impact increased four fold over the
six years, as operational wind capacity – and therefore same period.
electricity produced and sold – increased from 95 GW in
2011 to 154 GW in 2016. This is an extremely positive development for the sector,
which strives to compete with conventional technologies.
ONSHORE WIND ENERGY Ultimately lower energy costs contribute to the com-
DEVELOPERS petitiveness of the European economy.
Among all sub-sectors, onshore wind energy developers
provide the largest share of industry revenues. In 2016
onshore wind produced 7.9% of the total electricity FIGURE 12
generated in Europe and contributed €8bn to EU GDP. Wind energy developers’ contribution to EU GDP in 2011
Their contribution to the EU’s GDP increased by 16.2% and 2016
from 2011, even though their revenues were subject to
high volatility.
Figure 13 shows that wind energy direct revenue per TWh
has actually declined by more than 30% in the last six
years. This is largely due to cost reductions and the shift 2016 GDP Contribution
from Feed-in-Tariffs to auctions in combination with Feed- €10.5bn
in-Premiums resulting from the 2014 European State aid 47% of industry's
guidelines. total contribution
2011 GDP Contribution
However, the increase in generating capacity over the €7.6bn
period has offset the loss of revenue from declining prices, 45% of industry's
increasing developers’ overall revenue and therefore their total contribution
contribution to EU GDP.
Source: Deloitte for WindEurope
24 Local impact, global leadership. The impact of wind energy on jobs and the EU economy
WindEuropeThe impact of wind energy industry in the EU economy
FIGURE 13
Contribution of onshore wind developers to EU GDP and total revenues per TWh of energy generated
8,400 80
73
8,123
66 8,049 70
€m (real prices, constant 2010)
8,000 61
55 60
7,580 51
7,600 50
50
€m/TWh
7,280
7,209
7,200 40
6,925
30
6,800
20
6,400
10
6,000 -
2011 2012 2013 2014 2015 2016
Total revenues/generation Direct GDP impact
(€m/TWh) (€m, real prices, base 2010)
Source: Deloitte for WindEurope
FIGURE 14
Contribution of offshore wind energy developers to EU GDP and total revenues per TWh of energy generated
3,500 140
117
€m (real prices, constant 2010)
3,000 114 113 112
120
106
103
2,500 100
2,254 2,432
€m/TWh
2,000 80
1,767
1,500 60
1,163
1,000 905 40
638
500 20
0 -
2011 2012 2013 2014 2015 2016
Total revenues/generation Direct GDP impact
(€m/TWh) (€m, real prices, base 2010)
Source: Deloitte for WindEurope
Local impact, global leadership. The impact of wind energy on jobs and the EU economy 25
WindEuropeThe impact of wind energy industry in the EU economy
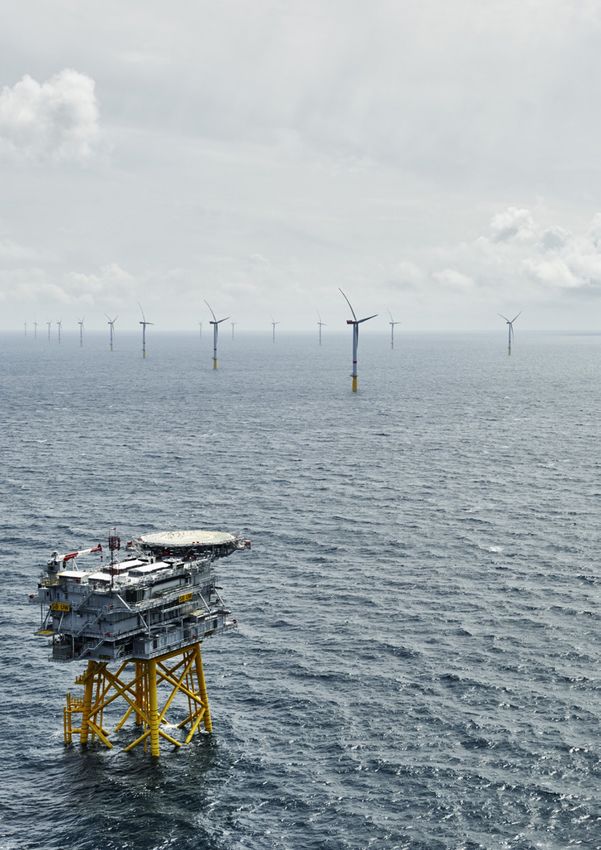
EGMOND AAN ZEE OFFSHORE WIND FARM
VATTENFALL
Egmond aan Zee is the first large scale offshore wind Besides job creation, the wind farm has generated
farm to be built off the Dutch coast. It is jointly owned significant economic activity, in particular through the
by Nuon, a subsidiary of Vattenfall, and Shell, who use of local sub-contractors for the procurement of
also serves as an off-taker through a power purchase goods and services. Local infrastructure has also been
agreement for the entire production of the wind farm. upgraded, with investments in roads and ports to
facilitate the transportation of wind turbines on land
The wind farm had a total investment cost of over as well as at sea.
€200m and has been operational since 2006. With
a total capacity of 108 MW, its 36 turbines generate In addition, a service centre has been opened close to
enough electricity to power 100,000 households. the wind farm, in the region of Ijmuiden. The service
centre performs routine checks, maintenance of
Significant employment was created during the electrical and mechanical systems, and replacement
construction phase, with over 350 full time equivalent of components for the wind turbines.
technicians, engineers, supervisors and administration
staff employed to build the wind farm. Today, Egmond As one of the first offshore wind farms in the country,
aan Zee employs up to 20 full time equivalent Egmond aan Zee has contributed to building and
employees, depending on operational activity during improving the local knowledge of offshore wind farms
the year. on marine ecology.
Photo: Vattenfall
26 Local impact, global leadership. The impact of wind energy on jobs and the EU economy
WindEuropeThe impact of wind energy industry in the EU economy
3.2.2 WIND TURBINE ONSHORE WIND TURBINE
MANUFACTURERS MANUFACTURERS
A significant part of the revenue generated by wind Onshore wind turbine manufacturers more than doubled
turbine manufacturers comes from exports to countries their contribution to the EU's GDP, from €2.4bn in 2011
outside the EU. to €5.1bn in 2016. This activity includes new capacity
additions in the EU as well as exports in non-EU countries.
However, due to local content requirements and
transportation constraints, some manufacturing also The rapid growth and expansion of wind power in
takes place in non-EU countries. Over 339 EU wind energy Europe has resulted in increased competition, pushing
players have developed activities through subsidiaries turbine prices down. Increased operational efficiency
outside of the European Union and they span in more and improved supply chain integration have been crucial
than 80 countries8. to keeping up with international competition in recent
years. As a result, onshore wind turbine manufacturers
have maintained stable revenues during this period, while
FIGURE 15 increasing their GDP impact. In 2011 the GDP contribution
Wind turbine manufacturers’ contribution to EU GDP in of the sub-sector was equivalent to 15% of the sub-sector
2011 and 2016 revenues. In 2016 their contribution amounted to 32% of
the sub-sector’s income.
OFFSHORE WIND TURBINE
MANUFACTURERS
2016 GDP Contribution
€6bn European offshore wind turbine manufacturers lead the
27% of industry's industry worldwide in terms of technology, market share
total contribution and quality of turbines. The industry has grown from 3
GW of installed capacity in 2010 to 12.6 GW in 2016.
2011 GDP Contribution
Today, Europe accounts for 88% of the global offshore
€2.8bn
wind installed capacity.
17% of industry's
total contribution
As a result, the contribution of offshore wind turbine
manufacturers to the EU's GDP has almost doubled over
the period, from €0.5bn in 2011 to €0.9bn in 2016. This
translates into a total contribution of over €4.3bn between
2011 and 2016. Overall, the GDP impact of offshore wind
Source: Deloitte for WindEurope turbine manufacturers is equivalent to a quarter of the
sub-sector’s income.
With the growth in installed capacity, wind turbine
manufacturers – both onshore and offshore – more than Technological developments and cost reductions across
doubled their contribution to the EU's GDP from €2.8bn in the industry’s supply chain have also impacted the activity
2011 to €6bn in 2016. of offshore wind turbine manufacturers. Investment costs
for an offshore wind turbine in 2016 are around half their
Their share in the industry's GDP contribution went up cost in 2010. This downward trend in costs has positioned
from 17% in 2011 to 27% in 2016. Growth rates started offshore wind as one of the key technologies to deliver
to slow in 2013 due to global competition, lower turbine on the EU’s 2030 Climate and Energy objectives. A robust
prices and cost reduction strategies across the value chain. pipeline of projects of 4 to 7 GW per year will enable this
drive towards competitiveness to continue.
8. This activity cannot be counted as part of the EU’s GDP. A list of the companies with active operations outside of the EU has been
included in Annex IV of this report.
Local impact, global leadership. The impact of wind energy on jobs and the EU economy 27
WindEuropeThe impact of wind energy industry in the EU economy
FIGURE 16
Onshore wind turbine manufacturers’ GDP contribution as a percentage of sub-sector income (real prices, constant 2010)
7 35%
32%
29% 30%
6 30%
€bn (real prices, constant 2010)
25%
5 25%
5.1 5.1
4.7
4 20%
15% 3.6
3 14%
15%
2 2.4
2.2 10%
1 5%
0 0%
2011 2012 2013 2014 2015 2016
GDP Contribution GDP contribution as a % of sub-sector income
Source: Deloitte for WindEurope
FIGURE 17
Offshore wind turbine manufacturers’ GDP contribution as a percentage of sub-sector income (real prices, constant 2010)
1.4 30%
26% 25%
25%
1.2 24% 25%
€bn (real prices, constant 2010)
22% 23%
1.0
20%
0.9
0.9
0.8
0.7 15%
0.7
0.6
0.6
10%
0.4 0.5
0.2 5%
0%
2011 2012 2013 2014 2015 2016
GDP Contribution GDP contribution as a % of sub-sector income
Source: Deloitte for WindEurope
28 Local impact, global leadership. The impact of wind energy on jobs and the EU economy
WindEuropeThe impact of wind energy industry in the EU economy
3.2.3 COMPONENT MANUFACTURERS
Many companies today produce both components and So, it is important to define the boundaries between wind
complete wind turbines. Some companies produce which turbine manufacturing and component manufacturing.
are also relevant to other industries.
FIGURE 18
Main wind turbine components
1.
2.
3. 4. 5.
1. Blades and rotor hub
2. Nacelle
3. Gearbox
4. Generator
6. 5. Electrical equipment
6. Elevator
7. Tower
8. Foundation
9. Software & control systems
7.
9.
8.
Source: WindEurope
Local impact, global leadership. The impact of wind energy on jobs and the EU economy 29
WindEuropeThe impact of wind energy industry in the EU economy
For the purpose of this report, the component The European wind supply chain is increasingly exposed
manufacturing sub-sector includes companies producing to international competition in a context of rapid cost
goods other than turbines which are specific for the wind reductions. The industrialisation of the sector means it
industry turbines. More specifically, the sector includes is increasingly drawing on a global supply chain for wind
the following components as part of its direct GDP energy components.
contribution:
• Towers
• Brakes FIGURE 19
• Blades and rotor hubs Component manufacturers’ contribution to EU GDP in
• Elevators 2011 and 2016
• Generators
• Electrical equipment
• Control and IT equipment
• Software manufacturers
• Other 2016 GDP Contribution
€1.9bn
Other components and raw materials for these families 9% of industry's
of products are also taken into account. However, they total contribution
are included in the indirect GDP contribution of the wind 2011 GDP Contribution
energy sector. €2.3bn
14% of industry's
total contribution
The activity of the component manufacturing sub-sector
depends on investments in new installed onshore and
offshore capacity, market evolution, production costs and
exports to countries outside of the EU.
Component manufacturers contributed €1.9bn to the Source: Deloitte for WindEurope
EU’s GDP in 2016, down 17% from €2.3bn in 2011.
They generated 9% of the industry’s GDP in 2016. This
compares to 14% in 2011.
FIGURE 20
Contribution of the component manufacturing sub-sector to EU GDP (real prices, constant 2010)
4.0 25%
22% 22%
3.5
€bn (real prices, constant 2010)
20%
18% 18% 18%
20%
3.0
2.5 15%
2.3
2.0 2.2
2
1.9
1.5 1.7 1.7 10%
1.0
5%
0.5
0.0 0%
2011 2012 2013 2014 2015 2016
GDP Contribution GDP contribution as a % of sub-sector income
Source: Deloitte for WindEurope
30 Local impact, global leadership. The impact of wind energy on jobs and the EU economy
WindEuropeThe impact of wind energy industry in the EU economy
This has resulted in a 28% decline in the component FIGURE 21
manufacturers sub-sector revenues between 2011 and Services providers' contribution to EU GDP in 2011 and
2016. But overall the share of revenues contributing to 2016
GDP remained steady over this period. In 2016, the GDP
impact of component manufacturers was 21.8% of the
sub-sector income, compared to 18.4% in 2011.
Having a robust market in Europe and sustained 2016 GDP Contribution
investments in research and innovation will be critical to €2.8bn
ensuring players in the European supply chain maintain 12% of industry's
total contribution
their competitive edge. This is all the more relevant as
wind supply chains in the US and China benefit from 2011 GDP Contribution
great investor certainty resulting from robust and clearer €3.5bn
21% of industry's
regulatory frameworks compared to the EU.
total contribution
3.2.4 SERVICE PROVIDERS
The service providers sub-sector covers specialised
services provided by or to the other sub-sectors. Source: Deloitte for WindEurope
Specifically, these include:
• transport of wind energy equipment; and the experience acquired over two decades of growth.
• maintenance services; The second one is the vertical integration ongoing in the
• monitoring and control equipment; wind energy industry.
• wind energy engineering;
• consulting companies (resource assessment, location In 2016 service providers generated 12% of the wind
evaluation and so on); energy industry’s GDP. Their impact was much higher
• information providers; in 2011, when they generated 21% of the wind energy
• R&D agents; industry’s GDP.
• training providers;
• specialised insurance services and sector associations. While their GDP contribution has decreased between
2011 and 2016, the share of their income that goes
The services sub-sector's share of the industry's GDP towards their GDP contribution has remained steady
reflects two main trends. The first one is sector maturity throughout the period at 45-48% (figure 22).
FIGURE 22
Contribution of the service providers to EU GDP (real prices, constant 2010)
€bn (real prices, constant 2010)
48% 48% 48% 48% 50%
4 45% 45%
3.5 3.5 40%
3 3
2.9 2.8 2.8
30%
2
20%
1
10%
0 0%
2011 2012 2013 2014 2015 2016
GDP Contribution GDP contribution as a % of sub-sector income
Source: Deloitte for WindEurope
Local impact, global leadership. The impact of wind energy on jobs and the EU economy 31
WindEuropeThe impact of wind energy industry in the EU economy
3.2.5 OFFSHORE WIND FIGURE 23
Offshore wind energy substructures' contribution to EU
ENERGY SUBSTRUCTURES GDP in 2011 and 2016
The "offshore wind energy substructures" sub-sector
covers the manufacturing of specific equipment, such as
foundations, offshore substations, as well as moorings
and anchoring systems for floating offshore wind.
2016 GDP Contribution
With the growth of the offshore wind industry, related €1.1bn
infrastructures have also experienced significant increases 5% of industry's
in activity. total contribution
2011 GDP Contribution
This sector’s evolution is linked to the overall growth in €0.6bn
offshore wind. Its revenues have doubled during the 3% of industry's
period, bringing the GDP contribution to €1bn in 2016. total contribution
Source: Deloitte for WindEurope
FIGURE 24
Contribution of the offshore wind energy substructure providers to EU GDP (real prices base 2010)
32%
35%
31% 31% 31% 31% 32%
1.4
€bn (real prices, constant 2010)
30%
1.2
1.2
25%
1.0 1.1 1.1
1.0 20%
0.8
0.8
15%
0.6
0.6
0.4 10%
0.2 5%
- 0%
2011 2012 2013 2014 2015 2016
GDP contribution GDP contribution as a % of sub-sector income
Source: Deloitte for WindEurope
32 Local impact, global leadership. The impact of wind energy on jobs and the EU economy
WindEuropeThe impact of wind energy industry in the EU economy
3.3 INDIRECT IMPACT OF THE WIND ENERGY INDUSTRY
ON EU GDP
The wind energy industry interacts with and has an impact The indirect GDP contribution of wind energy depends
on numerous other economic sectors. The relationship on the level of interaction between the wind industry and
between the different economic sectors can be calculated different economic sectors. As the industry grows, there is
by using an input-output model, such as those used by the a higher need for specialised wind industry products and
EU’s statistics office, Eurostat. Based on a survey of wind services. As such, there is a shift of activities from indirect
industry players, the data was adapted to single out that impact to direct impact on the EU’s GDP. This decline,
activity that can specifically be identified as wind9. therefore, reflects the sector's maturity.
The sector’s indirect contribution to the economy is
significant. Increased deployment of wind energy has
created strong industrial activities around Europe and in
numerous sub-sectors. In 2016 the wind energy industry
EVERY €1,000
IN WIND ENERGY
added €13.8bn to the EU economy as indirect value
created by the wind energy industry, an 8.9% decrease on GENERATES €250 REVENUE IN OTHER
2011. ECONOMIC SECTORS
FIGURE 25
Indirect impact of the EU wind energy industry (in real prices and % of industry's GDP)
25 50%
48%
46%
20 42%
41%
39%
38% 40%
15
15.2 15.3
14.4
€bn
13.4 13.9 13.8
10
30%
5
- 20%
2011 2012 2013 2014 2015 2016
GDP contribution % of industry's GDP contribution
Source: Deloitte for WindEurope
9. Please refer to the methodology in the Annexes for more information.
Local impact, global leadership. The impact of wind energy on jobs and the EU economy 33
WindEuropeThe impact of wind energy industry in the EU economy
The electrical equipment sector benefits the most from a result of wind energy deployment. Basic metals and
investments in the wind energy sector. Wind energy engineering services follow with €2bn and €0.9bn
created a total of €2.9bn in economic activity in the respectively of economic activity in 2016.
electrical equipment sector in 2016. Every € spent in the
wind energy sector generates € 0.121 in this sector. Overall, for every €1,000 of revenue in the wind energy
sector, there is €250 worth of economic activity generated
The second biggest beneficiary is the machinery and in other industrial sectors. Figure 26 shows the indirect
equipment sector, which in 2016 received €2.1bn as value of wind energy to different sectors of the economy.
FIGURE 26
Indirect value added to the economy by the wind industry in 2016: impact of €1,000 on the rest of the economy
Electrical equipment €52
Machinery and equipment €38
Basic metals €36
Construction €31
Engineering
€17
services
Rubber and
€15
plastic products
Other sectors €61
Euros
Source: Deloitte for WindEurope
34 Local impact, global leadership. The impact of wind energy on jobs and the EU economy
WindEuropeThe impact of wind energy industry in the EU economy
HULL BLADE FACTORY
SIEMENS GAMESA RENEWABLE ENERGY
Siemens Gamesa Renewable Energy was created Since the first day of operation 1,000 direct jobs have
in April 2017, following the merger of Gamesa been created at the manufacturing site. Almost all
Corporación Tecnológica and Siemens Wind Power. these employees (97%) were directly recruited from
the region of Hull or within a 30 mile radius. In the
The new company employs 27,000 employees first phases of the development of the plant, the initial
globally. It has a combined installed capacity of 80 GW workforce reached 650 employees, after more than
in more than 90 countries, across five continents. The 23,000 professionals had applied for a post. Significant
company ranks second in global installations, second employment has also been created indirectly through
in global onshore wind, and first in offshore wind with the procurement of goods and services from local sub-
8.7 GW installed across Europe. contractors.
In January 2015 the company started the construction Besides boosting the economy and jobs in the
of a blade manufacturing plant in Hull (Yorkshire and region, the company engages in a range of social
the Humber) in the UK. The plant became operational initiatives to support the local community. Siemens
in 2016. The location was a strategic choice given the Gamesa Renewable Energy collaborates with the Ron
importance of the UK in offshore wind, in particular Dearing University Technical College, which teaches
the region of Humber and Alexandra Docks. 14-19-year-old students through practical lectures.
Pathway Plus is another charitable initiative the
The centre covers 540,000 square meters, with the company actively participates in to help people with
blade manufacturing plant alone occupying 40,000 learning disabilities to live independently and find a
square meters. The factory had an investment cost job.
of £310m (€400m). Siemens provided £160m, the
remaining £150m was provided by Associated British It is estimated that the use of the turbines produced
Ports (ABP). by Siemens Gamesa Renewable Energy in Hull’s blade
manufacturing plant can cut CO2 emissions by over 1
The manufacturing site produces 75-metre turbine million tonnes per year.
blades. All production at the plant during the first two
years of operation will serve the domestic market in
the UK. In the future, the company expects to export
part of the production to supply new projects in the
North Sea region as well as international markets.
Local impact, global leadership. The impact of wind energy on jobs and the EU economy 35
WindEuropePhoto: Siemens Gamesa
Photo:
Renewable
ENEL Green
Energy
Power4.
WIND ENERGY
EXPORTS AND
IMPORTS
The export activity of European wind energy companies the European wind industry at the centre of worldwide
has also been important in powering wind energy growth value creation. Today, Europe is a global net exporter with
in global markets. Decades of experience, as well as the a positive trade balance of €2.4bn.
offering of top quality products and services, have placed
FIGURE 27
Gross exports and imports of the wind energy industry (real prices, constant 2010)
9
8.1
7.6 7.6 7.8
8 7.5 7.1
7
6
5
5.5 5.4
4 4.8 4.8 4.9
4.6
€bn
3
2
1
0
2011 2012 2013 2014 2015 2016
Net Exports (Gross Exports - Imports) Gross exports Imports
Source: Deloitte for WindEurope
Local impact, global leadership. The impact of wind energy on jobs and the EU economy 37
WindEuropeWind sector exports and imports
Over the last six years the European wind industry has Wind turbine manufacturers are responsible for the
exported goods and services worth €45.7bn. largest share of exports, ranging from 42% to 45%.
Component manufacturers generate the second largest
share, with their weight varying from 28% to 32%.
FIGURE 28
EU wind industry exports in absolute terms and their weight within the sector (in constant prices 2010 and percentage)
9
8 5,1%
5,2% 6,6%
17,7% 5,9% 6,7%
7 19,1% 6,4% 17,5%
21,2% 18,1%
€bn (real prices, constant 2010)
19,3%
6 31,6%
30,3% 33,4%
32,6%
29,9%
5 28,7%
4
45,6%
3 45,4%
43,0% 45,6% 42,6% 42,5%
2
1
0
2011 2012 2013 2014 2015 2016
Main specific equipment Services
Main specific components Others10
Source: Deloitte for WindEurope
On average the EU has consistently exported between wind power installed capacity outside of the EU in a given
€7bn and €8bn of wind energy goods and services year.
between 2011 and 2016. Over 75% of these exports are
specifically for wind energy components and equipment Figure 29 shows that in 2011 there was approximately
and in 2016 this equated to €5.9bn (Figure 29). €200,000 of EU content in every MW of installed capacity
outside of the EU. But in 2016 this number was down to
Export revenues of the industry have been stable, €140,000, mainly due to local content requirements and
but the European content in the installed wind power supply chain constraints. As a result EU wind turbine and
capacity outside of the EU has declined. This trend can component manufacturers have been unable to fully tap
be calculated by dividing the amount of exports for wind the growth potential in markets outside of the EU.
energy components and equipment with the amount of
10. Wind energy electricity exports have been included in Other exports
38 Local impact, global leadership. The impact of wind energy on jobs and the EU economy
WindEuropeYou can also read