Long-Term Outcome of Potential Celiac Disease in Genetically at-Risk Children: The Prospective CELIPREV Cohort Study
←
→
Page content transcription
If your browser does not render page correctly, please read the page content below
Journal of
           Clinical Medicine

Article
Long-Term Outcome of Potential Celiac Disease in
Genetically at-Risk Children: The Prospective
CELIPREV Cohort Study
Elena Lionetti 1, * , Stefania Castellaneta 2 , Ruggiero Francavilla 3 , Alfredo Pulvirenti 4 ,
Giulia Naspi Catassi 1 , Carlo Catassi 1,5
and The SIGENP Working Group of Weaning and CD Risk
 1    Department of Pediatrics, Marche Polytechnic University, 60123 Ancona, Italy;
      giulia.catassi@gmail.com (G.N.C.); c.catassi@univpm.it (C.C.)
 2    Department of Pediatrics, San Paolo Hospital, 70127 Bari, Italy; scastellaneta@libero.it
 3    Interdisciplinary Department of Medicine, Paediatric Section, University of Bari, 70126 Bari, Italy;
      ruggiero.francavilla@uniba.it
 4    Department of Clinical and Molecular Biomedicine, University of Catania, 95123 Catania, Italy;
      apulvirenti@dmi.unict.it
 5    Center for Celiac Research, Mass General Hospital for Children, Boston, MA 02114, USA
 *    Correspondence: m.e.lionetti@univpm.it.com; Tel.: +39-0715962360

 Received: 9 January 2019; Accepted: 31 January 2019; Published: 5 February 2019

 Abstract: Background: The long-term outcome of potential celiac disease (CD) is still a debated issue.
 We aimed to evaluate the progression of potential CD versus overt CD after 10-years of follow-up in
 a cohort of children genetically predisposed to CD. Methods: The CELIPREV study is prospectively
 following from birth 553 children with CD-predisposing HLA genes. Children with a diagnosis
 of potential CD continued to receive a normal diet and repeated the serological screening for CD
 every year. An intestinal biopsy was taken in presence of persistent positive serology. Results:
 Overall, 26 (4.7%) children received a diagnosis of potential CD (50% females, median age 24 months).
 All children were symptom-free. Twenty-three children continued a gluten-containing diet; at 10 years
 from the first biopsy, three children developed overt CD (13%), 19 (83%) became antibodies negative
 at 1 year from the first biopsy and remained negative up to 10 years of follow-up and one subject (4%)
 had fluctuating antibody course with transiently negative values and persistently negative biopsy.
 Conclusions: In children genetically predisposed to CD with a diagnosis of potential CD the risk of
 progression to overt CD while on a gluten-containing diet is very low in the long-term.

 Keywords: celiac disease; potential celiac disease; natural history

1. Introduction
     Celiac disease (CD) is a systemic immune-mediated disorder caused by the ingestion of
gluten-containing grains in genetically susceptible persons [1]. The phenotypic expression of the
disease has changed over time with a marked decrease of classical cases and a striking increase of
the atypical and subclinical phenotype [1]. Recent cohort studies in infants genetically at-risk of
CD, periodically screened for CD autoimmunity, have shown a significant proportion of children
affected with potential CD [2–6]. According to current definitions, potential CD is characterized by the
presence of anti-transglutaminase (TGA2) and anti-endomysium (EMA) antibodies, with compatible
HLA and without duodenal villous atrophy [7]. These patients may or may not have symptoms
and signs of the disease and may or may not develop an overt CD with villous atrophy later on.
Therefore, the need to start a gluten-free-diet (GFD), especially in asymptomatic patients, is still a

J. Clin. Med. 2019, 8, 186; doi:10.3390/jcm8020186                                      www.mdpi.com/journal/jcm
J. Clin. Med. 2019, 8, 186 2 of 9
debated issue [7]. The European Society of Paediatric Gastroenterology, Hepatology and Nutrition
guidelines suggest that a seropositive, asymptomatic at-risk person, who does not show clear evidence
of small intestinal mucosal damage, should be followed-up on a normal gluten-containing diet and
re-evaluated at regular intervals [7]. Long-term prospective studies are needed to clarify the natural
history of potential CD and its progression to overt CD.
The Risk of Celiac Disease and Age at Gluten Introduction (CELIPREV) study is a multicentre,
prospective study investigating the interplay between environmental and genetic factors on the
development of CD in a cohort of infants with a family risk of CD, followed on from birth [2,3,8]. We
have previously reported that in the CELIPREV study, the rate of progression of potential CD to overt
CD by 2 years of follow-up was only 5% [3]. However, the long-term natural history of potential CD is
still unclear. Here we report up to 10-years follow-up in CELIPREV children originally diagnosed as
potential CD.
2. Methods
The CELIPREV is a prospective, multicentre, nationwide intervention trial that was primarily
aimed to evaluate the role of age at gluten introduction on CD development, in a large cohort of
children at family risk of CD, that were followed from birth [2,3,8]. Family risk was defined by
having at least one first-degree relative affected with CD. Newborns were recruited in 20 centres
scattered throughout Italy between October 2003 and January 2009. Infants were assigned to introduce
gluten-containing food at either 6 (group A) or 12 months of age (group B) by block randomization
and then followed-up regularly. The study design and the characteristics of the CELIPREV cohort
have been described previously [2,3].
For the purpose of the present study, we focused on the sub-group of children with a diagnosis of
potential CD defined in the presence of: (a) a CD compatible HLA genotype (standard or high risk,
see below); (b) a Marsh 0–1 lesion at the biopsy; and c) IgA TGA2 and EMA positivity or IgG TGA2
positivity in presence of IgA deficiency (IgA < 5 mg per decilitre). Children with potential CD were
left on a normal diet unless symptomatic. Every 6 months for the first year and every year thereafter,
antibodies and clinical conditions were checked and a small bowel biopsy was taken every 2 years
in presence of persistent serological positivity or earlier if symptoms developed. A thorough dietary
survey was performed by a dietician at each control visit to verify the intake of gluten.
The Institutional review board of each participating centre approved the study protocol, registered
on ClinicalTrials.gov CELIPREV, number, NCT00639444. Written informed consent was obtained from
the parents or guardians of the children.
2.1. HLA Genotype
The detection of HLA alleles was performed by the DQ-CD Typing Plus kit (BioDiagene, Palermo,
Italy), as previously described [2]. On the basis of HLA determination, children were classified as
having no risk of CD (the absence of HLA-DQ2 and HLADQ8), a standard risk of CD (a single or
double copy of the DQB1*02 allele associated with DQA1 alleles different from the DQA1*05 or a
single DQ2 (DQA1*05-DQB1*02) or DQ8 (DQA1*03-DQB1*0302/ 0305) haplotypes or a high risk of
CD (homozygosity for DQA1*05-DQB1*02 or DQA1*05-DQB1*02-DQA1*0201-DQB1*02) [2,9].
2.2. Serologic Assay
Serum TGA2 was measured by means of an enzyme-linked immunosorbent assay with the use
of a commercial kit (Menarini Diagnostics, Florence, Italy). More than 20 arbitrary units indicated a
positive result. Results are expressed as multiple of the upper normal limit (UNL). EMA were detected
by means of indirect immunofluorescence, with the use of monkey oesophagus as substrate (a titre of
1:10 or higher that resulted in a positive reaction was considered to be positive). Total serum IgA was
measured by means of nephelometry.J. Clin. Med. 2019, 8, 186 3 of 9
2.3. Small-Bowel Biopsies
Small-bowel biopsies were performed by means of upper endoscopy and at least 4 specimens
were obtained from the bulb and the descending part of the duodenum. Lesions in the small intestine
were graded at the coordinating centre in Ancona, Italy, according to the Marsh classification [10].
2.4. Outcome Measures
The primary outcome measure was the risk of overt CD at 10 years of follow-up after the diagnosis
of potential CD. Secondary outcomes were: a) the natural history of CD-related antibodies in children
with potential CD left on a normal diet; and b) to identify any possible discriminating factor between
children with potential CD who developed overt CD from those who remained potential.
2.5. Statistical Analyses
The dataset reflects follow-up of the cohort as of June, 2018. Data are expressed as mean ± SD.
Proportions were compared with the use of the χ2 test with Yate correction for continuity or Fisher
exact test as appropriate; comparison of continuous variables was performed with the use of Student
t test. Survival analysis was performed to observe the occurrence of the event (overt CD) over long
periods of time. Kaplan–Meier curves were plotted for the primary end point (i.e., the risk of overt
CD according to age). All differences were considered to be statistically significant at a 5% probability
level and all reported P values were 2- sided. Statistical analysis was performed with the use of tools
for survival analysis and recursive partitioning analysis within the R system.
3. Results
3.1. Patients
After exclusion of 125 patients who dropped out, the cohort included 707 infants. Of them, 154
were negative for HLA-DQ2 and HLA-DQ8 and were excluded from further follow-up. The final
study group included 553 children who were positive for HLA-DQ2, HLA-DQ8 or both. Among them,
26 (4.7%) children received a diagnosis of potential CD. They were 13 (50%) females, with a median
age of 12 years (range, 11.3 to 13.7) in June 2018, when the follow-up was stopped. The median age at
diagnosis of potential CD was 24 months (range, 15 to 60). By the end of the study, all children had
at least 10 years of follow-up after the diagnosis of potential CD. Of these 26 children, all were IgA
TGA2 and EMA positive, except one with IgA deficiency who was positive for TGA2 of IgG class.
Fifteen children had a Marsh score 0 (58%) and 11 (42%) had a Marsh score 1. HLA was at high risk of
CD in 7 (27%) children and at standard risk in the remaining 19 (73%). The mean TGA2 value was
5.2 UNL. All children were symptom-free, had normal nutritional parameters and none had other
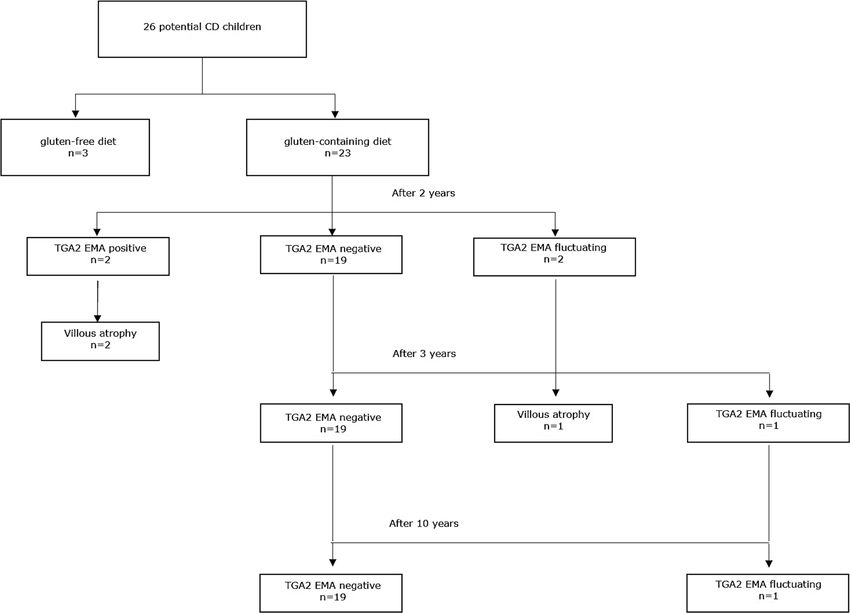
autoimmune disorder. Figure 1 shows the flow diagram of the 26 children with potential CD. Three
patients started a GFD because of parents’ choice. Twenty-three children continued a gluten-containing
diet. During follow-up, the amount of daily gluten intake was normal (at least 15 g per day) in all cases.
We obtained serological data at 10 years of follow-up of all 23 children on gluten-containing diet.J. Clin. Med. 2019, 8, 186 4 of 9
J. Clin. Med. 2019, 8, 186 4 of 9
J. Clin. Med. 2019, 8, 186 4 of 9
Figure 1. Flow diagram of potential celiac disease (CD) children.
Figure1.1.Flow
Figure Flowdiagram
diagram of
of potential celiac disease
potential celiac disease(CD)
(CD)children.
children.
3.2.
3.2.3.2. Study
Study Outcomes
Outcomes
Study Outcomes
Overall,
Overall,
Overall, 10
1010 yearsafter
years
years after
after the
the
the first
first
first biopsy,
biopsy, onlyonly
only three
outout
three
three out
of ofof
23 2323children
children withwith
children potential
with
potential CD
potential
CD on on
CDgluten-
gluten- on
containing
gluten-containing diet developed
diet developed
containing diet developed overt
overt CD CD
overt (13%).
CDFigure
(13%). Figure 2
(13%).2 showsshows the proportion
Figurethe2 proportion of
shows the ofproportion children developing
of children
children developing
overtCD,
developing
overt CD,overt
according
according toage.
age.OfOf
CD,toaccording thethe
to three
age.
three Ofpatients
the that
patients that
three developed
patients
developed thatovert
overt CD, CD,
two two
developed had persistent
hadovert CD, two
persistent TGA2 TGA2
had
and EMA positive at each time of follow-up and showed villous atrophy two years after the first first
and
persistentEMA TGA2 positive
and at
EMA each time
positive of
at follow-up
each time and
of showed
follow-up villous
and showedatrophy two
villous years
atrophy after
two the
years
biopsy
after
biopsy atatage
the first age 55years;
biopsy years;
at age
thethe third
5third
years; child
the
child had
third
had fluctuating
child EMAandand
had fluctuating
fluctuating EMA EMA
TGA2 TGA2andtitre
titre TGA2
with with
titretransiently
with negative
transiently negative
transiently
valuesvalues
negative
values duringduring
during follow-up
follow-up andandshowed
follow-up showed
and showed villous
villous atrophy
villous
atrophy 3 years
atrophy
3 years 3afterafter
years the the
after
the first first biopsy
first
biopsy at theatage
biopsy thethe
at ofage
8ageof 8
years.
of 8years.
years.
Figure 2. Kaplan–Meier Estimates of Overt Celiac Disease in Children with Potential Celiac Disease
Figure
Figure
According2. Kaplan–Meier
2. Kaplan–Meier
to Age. Dashed Estimates
Estimates of Overt
of Overt
lines represent Celiac
Celiac
95% Disease
Disease
confidence in Children
in Children
intervals. with
with Potential
Potential Celiac
Celiac Disease
Disease
According
According to Age.
to Age. Dashed
Dashed lineslines represent
represent 95%95% confidence
confidence intervals.
intervals.
Out of the other 20 children, 19 (95%) became TGA2 and EMA negative at 1 year from the first
OutOut
biopsy of
andthe other
ofremained
the 20negative
other children,
up19to(95%)
20 children, became
1910(95%)
years becameTGA2
TGA2
of follow-up.and EMA
and
One EMAnegative
subject at 1at
negative
(5%) had year from
1 year thethe
from
fluctuating TGA2 firstfirst
biopsy andand
biopsy remained negative
remained up up
negative to 10
to years of follow-up.
10 years One
of follow-up. subject
One (5%)
subject hadhad
(5%) fluctuating TGA2
fluctuating TGA2J. Clin. Med. 2019, 8, 186 5 of 9
course with transiently negative values. In this case the intestinal biopsies performed after 2 and 4
years of follow-up still showed a Marsh score 0. All 20 children were still symptom-free and did not
developed any autoimmune disease at the 10 years follow-up.
Of note, out of the three children that started a gluten-free diet because of parents’ choice, one
developed an autoimmune thyroiditis.
The demographical, clinical, serological and genetic characteristics of this study-group are shown
in Table 1. There was no significant difference between children developing CD and the others for
all the investigated variables. Only the serological outcome had a discriminating power; indeed, the
persistent positivity was present in 2 children both developing overt CD as compared to none of the
other children (p < 0.001); a serological remission was observed in 19 out 20 (95%) that did not develop
CD compared to none of those developing overt CD (p < 0.001).
Table 1. Demographical, clinical, serological and genetic characteristics of children that developed
overt celiac disease and children that remained potential.
Not-Developing Overt CD Developing Overt CD
(n = 20) (n = 3)
Median age at diagnosis, mo 24 36
Female sex, no. (%) 10 (50) 2 (66.7)
First-degree relative with CD, no. (%)
Type of relative
Father 1 (5) 2 (66.7)
Mother 9 (45) 0
Brother 2 (10) 0
Sister 8 (40) 1 (33.3)
Breastfed, no. (%) 16 (80) 1 (33.3)
Duration of breastfeeding, mo 6.3 ± 5.8 9 ± 15.6
Introduction of gluten, no. (%)
At 6 mo, Group A 13 (65) 1 (33.3)
At 12 mo, Group B 7 (35) 2 (66.7)
TGA2 level at diagnosis, xUNL 5.0 ± 4.6 4.7 ± 4.3
Caesarean delivery, no. (%) 7 (35) 2 (66.7)
HLA genotype, no. (%)
Standard risk 14 (70) 1 (33.3)
High risk 6 (30) 2 (66.7)
Marsh score at first biopsy, no. (%)
Marsh 0 13 (65) 1 (33.3)
Marsh 1 7 (35) 2 (66.7)
Serology outcome (TGA2 and EMA), no. (%)
Persistent positivity * 0 2 (66.7)
Fluctuation 1 (5%) 1 (33.3)
Spontaneous remission * 19 (95%) 0
Plus-minus values are expressed as means ±standard deviation. UNL denotes upper normal limit. CD: celiac
disease; TGA2: anti-transglutaminase antibodies; EMA: endomysium antibodies. * p < 0.001 for the comparison of
both persistent positivity and spontaneous remission between the groups.
4. Discussion
The present study shows that in children genetically at-risk for CD with a diagnosis of potential
CD the risk of progression to overt CD while on a gluten-containing diet is very low in the long-term.J. Clin. Med. 2019, 8, 186 6 of 9
The results from this longitudinal study provide unique data on the natural history of potential
CD evaluated from the onset of the disease and have several implications for clinical practice. Potential
CD is, indeed, an emerging condition, with a still unclear pathogenesis in comparison to overt CD.
According to the recent ESPGHAN guidelines, children with a CD-affected first-degree relative should
be screened by HLA testing and TGA2 test [7]. We previously showed that in this group of children the
prevalence of potential CD is high [2,3] and its management is still controversial: (a) the observation
that CD autoimmunity may spontaneously normalize in children with potential CD while on a
gluten-containing diet would suggest caution before starting a GFD for life without a conclusive proof
of a gluten-induced disease [3,11]; (b) potential CD may be the first step of the disease, that would
be overly manifested later in time and starting a GFD as soon as possible may prevent the risk of an
underling disease in the long run [12]. Very few studies have analysed long term risks related to a
gluten containing diet in these patients.
In 2010, Kurppa et al. [12] found that 7 out of 8 children with potential CD developed overt
CD after 2 years of a gluten containing diet. In the Finnish study all children were symptomatic,
aged between 4 and 17 years, referred from primary health care because of suspicion of celiac
disease [12]. In 2014, Auricchio et al. [11] reported the 9-year follow-up of a large cohort of children
with potential CD showing that 32% of those on a gluten-containing diet progressed to villous atrophy.
The study cohort included either genetically at-risk children diagnosed by screening early in life or
older children tested for CD for other reasons. A recent study evaluating the effect of GFD in a cohort
of 65 symptomatic children with potential CD showed that symptoms after GFD improve in only about
half of the cases [13]. Therefore, the authors suggested caution before starting a GFD in this condition.
In adults, Biagi et al. [14] retrospectively evaluated 47 patients with potential CD. Of them,
24 patients followed a gluten-containing diet and 5 (24%) developed a flat mucosa, while the
others maintained a normal duodenal mucosa for many years and their symptoms spontaneously
improved [14]. Volta et al. [15] described the natural history of 77 adults diagnosed with potential
celiac disease; gluten withdrawal led to significant clinical improvement in all 61 symptomatic patients.
The 16 asymptomatic patients continued on gluten-containing diet and only 1 (6%) developed mucosal
flattening [15].
We firstly described the natural history of potential CD in young asymptomatic children screened
for family risk of CD, showing that only 5% of them developed overt CD after 2 years of follow-up [3].
A prolonged follow-up was, however, required to exclude that further changes in gluten tolerance
might take place over time in these patients. Now we show that in the same well-defined cohort
of children with potential CD, only 13% developed villous atrophy after 10 years of follow-up,
therefore confirming that the finding of CD autoimmunity only rarely predicts progression to overt
CD. Worth noting, children with potential CD left on a gluten-containing diet did not develop any
other autoimmune disease during the 10-year follow-up, while an autoimmune thyroiditis developed
in one of the few patients put on a GFD due to parental choice, a finding that does not support the
hypothesis that a GFD is a safer choice than a regular diet in children with potential CD.
Our finding of a lower percentage of progression of potential to overt CD as compared to previous
studies may be explained by: (a) the age of our study-group; indeed, this is the first study including
only young children, who may have a transient antibodies positivity in the first years of life more
frequently than older children; (b) the study design; in our cohort study per protocol children at family
risk were periodically screened for CD autoimmunity, thus allowing to detect transient antibody
positivities that would not be seen in real life.
With the aim to identify any possible indicator of progression from potential to overt CD, we
found that the persistence positivity of TGA2 and EMA during follow-up was the only factor that
significantly predicted the development of overt CD in our cohort. On the other hand, the spontaneous
loss of serum CD autoimmunity (TGA2 and EMA) was the most frequent outcome in children who did
not develop CD, while the possibility of fluctuating antibodies was observed in both groups. These
results are consistent with several previous studies showing transient CD autoimmunity in childrenJ. Clin. Med. 2019, 8, 186 7 of 9
with serial testing [3,6,11,16–20]. Our study definitively shows that in these subjects with spontaneous
loss of TGA2 and EMA, CD autoimmunity truly abates and tolerance persists over time. On the
contrary, the presence of persistent positivity needs more attention because the risk of developing
overt CD is very high in these cases.
The finding of CD related autoantibodies in patients bearing the HLA predisposing genes without
mucosal damage suggests that these children developed an adaptive anti-gluten immune response but
they possibly lacked the innate activation of epithelial cells eventually leading to villous atrophy [21].
It is possible to speculate that in children with transient TGA2, Tregs cells have gained the upper
hand [22]. A lower level of pro-inflammatory adaptive anti-gluten immunity might also be responsible
for lack of villous atrophy [21].
We know that a prolonged follow-up of this cohort is still needed and further studies are required
to better explore which factors may influence the balance between tolerance and immune-response to
gluten finally leading to the progression to overt CD.
5. Conclusions
Our study has three important implications: (1) in children with a family risk of CD there may be
a state of temporary positivity of celiac serology, thus it is always mandatory to back up a positive
serology with a small-intestine biopsy; (2) in the absence of the histological confirmation of the
disease, a gluten containing diet can be safely recommended, with a clear indication to attend a careful
serological follow-up; (3) in presence of persistent serological positivity a further biopsy is strongly
required; in case of spontaneous serological remission, overt CD is unlike to develop.
The demonstration of a self-limiting flare-up of CD serology raises an intriguing question: how
does this spontaneous remission occur? If nature can, can we? Future research will now design
experiments addressing this question.
Author Contributions: Conceptualization, C.C. and E.L.; methodology, E.L.; software, A.P.; formal analysis, A.P.;
investigation, E.L., S.C., R.F., G.N.C.; data curation, E.L.; writing—original draft preparation, E.L.; writing—review
and editing, C.C., E.L., S.C., R.F., A.P., G.N.C.; visualization, C.C.; supervision, C.C.; project administration, C.C.;
funding acquisition, C.C.
Funding: The study was funded by the Fondazione Celiachia of the Italian Society for Celiac Disease (AIC); AIC
also facilitated the enrolment of participants but had no involvement in the collection, analysis and interpretation
of data, in the writing of the report and the decision to submit the manuscript for publication.
Acknowledgments: We thank all the member of the SIGENP (Italian Society for Paediatric Gastroenterology,
Hepatology and Nutrition) Working group of Weaning and CD Risk that participated to the CELIPREV study,
including: Sergio Amarri 1 , Maria Barbato 2 , Cristiana Barbera 3 , Graziano Barera 4 , Antonella Bellantoni 5 ,
Emanuela Castellano 6 , Graziella Guariso 7 , Maria Giovanna Limongelli 8 , Salvatore Pellegrino 9 , Carlo Polloni 10 ,
Claudio Ughi 11 , Giovanna Zuin 12 .
1 Department of Pediatrics, AO-IRCCS Santa Maria Nuova Hospital, Reggio Emilia, Italy
2 Department of Pediatrics, “La Sapienza” University, Roma, Italy
3 Department of Pediatrics, University of Torino, Italy
4 Department of Pediatrics, San Raffaele Hospital, Milano, Italy
5 Department of Pediatrics, Bianchi-Melacrino Morelli Hospital, Reggio Calabria, Italy
6 Paediatric Gastroenterology Unit, G. Gaslini Institute, Genova, Italy
7 Department of Pediatrics, University of Padova, Italy
8 Department of Pediatrics, “Federico II” University of Naples, Napoli, Italy
9 Cystic Fibrosis and Paediatric Gastroenterology Unit, University Hospital ’G. Martino’, Messina, Italy
10 Department of Pediatrics, Rovereto Hospital, Rovereto (TN), Italy
11 Department of Pediatrics, University of Pisa, Italy
12 Department of Pediatrics, Buzzi Children Hospital, Milano, Italy
Conflicts of Interest: Carlo Catassi served as consultant for Schär, Burgstall (BZ) Italy and NOOS S.r.l., Rome,
Italy. The other authors have no conflict of interest to disclose.J. Clin. Med. 2019, 8, 186 8 of 9
References
1. Fasano, A.; Catassi, C. Celiac disease. N. Engl. J. Med. 2012, 367, 2419–2426. [CrossRef] [PubMed]
2. Lionetti, E.; Castellaneta, S.; Francavilla, R.; Pulvirenti, A.; Tonutti, E.; Amarri, S.; Barbato, M.; Barbera, C.;
Barera, G.; Bellantoni, A.; et al. Introduction of gluten, HLA status and the risk of celiac disease in children.
N. Engl. J. Med. 2014, 371, 1295–1303. [CrossRef] [PubMed]
3. Lionetti, E.; Castellaneta, S.; Pulvirenti, A.; Tonutti, E.; Francavilla, R.; Fasano, A.; Catassi, C.; Italian Working
Group of Weaning and Celiac Disease Risk. Prevalence and natural history of potential celiac disease in at
family-risk infants prospectively investigated from birth. J. Pediatr. 2012, 161, 908–914. [CrossRef] [PubMed]
4. Vriezinga, S.L.; Auricchio, R.; Bravi, E.; Castillejo, G.; Chmielewska, A.; Crespo Escobar, P.; Kolaček, S.;
Koletzko, S.; Korponay-Szabo, I.R.; Mummert, E.; et al. Randomized feeding intervention in infants at high
risk for celiac disease. N. Engl. J. Med. 2014, 371, 1304–1315. [CrossRef] [PubMed]
5. Simell, S.; Hoppu, S.; Hekkala, A.; Simell, T.; Stahlberg, M.R.; Viander, M.; Yrjänäinen, H.; Grönlund, J.;
Markula, P.; Simell, V.; et al. Fate of five celiac disease-associated antibodies during normal diet in genetically
at-risk children observed from birth in a natural history study. Am. J. Gastroenterol. 2007, 102, 2026–2035.
[CrossRef] [PubMed]
6. Liu, E.; Bao, F.; Barriga, K.; Miao, D.; Yu, L.; Erlich, H.A.; Haas, J.E.; Eisenbarth, G.S.; Rewers, M.J.;
Hoffenberg, E.J. Fluctuating transglutaminase autoantibodies are related to histologic features of celiac
disease. Clin. Gastroenterol. Hepatol. 2003, 1, 356–362. [CrossRef]
7. Husby, S.; Koletzko, S.; Korponay-Szabó, I.R.; Mearin, M.L.; Phillips, A.; Shamir, R.; Troncone, R.;
Giersiepen, K.; Branski, D.; Catassi, C.; et al. European society for pediatric gastroenterology, hepatology
and nutrition guidelines for the diagnosis of coeliac disease. J. Pediatr. Gastroenterol. Nutr. 2012, 54, 136–160.
[CrossRef]
8. Lionetti, E.; Castellaneta, S.; Francavilla, R.; Pulvirenti, A.; Catassi, C.; SIGENP Working Group of Weaning
and CD Risk. Mode of Delivery and Risk of Celiac Disease: Risk of Celiac Disease and Age at Gluten
Introduction Cohort Study. J. Pediatr. 2017, 184, 81–86. [CrossRef]
9. Romanos, J.; van Diemen, C.C.; Nolte, I.M.; Trynka, G.; Zhernakova, A.; Fu, J.; Bardella, M.T.; Barisani, D.;
McManus, R.; van Heel, D.A.; et al. Analysis of HLA and non-HLA alleles can identify individuals at high
risk for celiac disease. Gastroenterology 2009, 137, 834–840. [CrossRef]
10. Oberhuber, G.; Granditsch, G.; Vogelsang, H. The histopathology of coeliac disease: Time for a standardized
report scheme for pathologists. Eur. J. Gastroenterol. Hepatol. 1999, 11, 1185–1194. [CrossRef]
11. Auricchio, R.; Tosco, A.; Piccolo, E.; Galatola, M.; Izzo, V.; Maglio, M.; Paparo, F.; Troncone, R.; Greco, L.
Potential celiac children: 9-year follow-up on a gluten-containing diet. Am. J. Gastroenterol. 2014, 109, 913–921.
[CrossRef] [PubMed]
12. Kurppa, K.; Ashorn, M.; Iltanen, S.; Koskinen, L.L.; Saavalainen, P.; Koskinen, O.; Mäki, M.; Kaukinen, K.
Celiac disease without villous atrophy in children: A prospective study. J. Pediatr. 2010, 157, 373–380.
[CrossRef] [PubMed]
13. Mandile, R.; Discepolo, V.; Scapaticci, S.; Del Vecchio, M.R.; Maglio, M.A.; Greco, L.; Troncone, R.;
Auricchio, R. The Effect of Gluten-free Diet on Clinical Symptoms and the Intestinal Mucosa of Patients With
Potential Celiac Disease. J. Pediatr. Gastroenterol. Nutr. 2018, 66, 654–656. [CrossRef] [PubMed]
14. Biagi, F.; Trotta, L.; Alfano, C.; Balduzzi, D.; Staffieri, V.; Bianchi, P.I.; Marchese, A.; Vattiato, C.;
Zilli, A.; Luinetti, O.; et al. Prevalence and natural history of potential celiac disease in adult patients.
Scand. J. Gastroenterol. 2013, 48, 537–542. [CrossRef]
15. Volta, U.; Caio, G.; Giancola, F.; Rhoden, K.J.; Ruggeri, E.; Boschetti, E.; Stanghellini, V.; De Giorgio, R.
Features and Progression of Potential Celiac Disease in Adults. Clin. Gastroenterol. Hepatol. 2016, 14, 686–693.
[CrossRef] [PubMed]
16. Simell, S.; Hoppu, S.; Simell, T.; Ståhlberg, M.R.; Viander, M.; Routi, T.; Simell, V.; Veijola, R.; Ilonen, J.;
Hyöty, H. Age at development of type 1 diabetes- and celiac diseaseassociated antibodies and clinical disease
in genetically susceptible children observed from birth. Diabetes Care. 2010, 33, 774–779. [CrossRef] [PubMed]
17. Bjorck, S.; Brundin, C.; Lorinc, E.; Lynch, K.F.; Agardh, D. Screening detects a high proportion of celiac
disease in young HLA-genotyped children. J. Pediatr. Gastroenterol. Nutr. 2010, 50, 49–53. [CrossRef]
[PubMed]J. Clin. Med. 2019, 8, 186 9 of 9
18. Waisbourd-Zinman, O.; Hojsak, I.; Rosenbach, Y.; Mozer-Glassberg, Y.; Shalitin, S.; Phillip, M.; Shamir, R.
Spontaneous normalization of anti-tissue transglutaminase antibody levels is common in children with type
1 diabetes mellitus. Dig. Dis. Sci. 2012, 57, 1314–1320. [CrossRef] [PubMed]
19. Castellaneta, S.; Piccinno, E.; Oliva, M.; Cristofori, F.; Vendemiale, M.; Ortolani, F.; Papadia, F.; Catassi, C.;
Cavallo, L.; Francavilla, R. High rate of spontaneous normalization of celiac serology in a cohort of 446
children with type 1 diabetes: A prospective study. Diabetes Care. 2015, 38, 760–766. [CrossRef] [PubMed]
20. Liu, E.; Dong, F.; Barón, A.E.; Taki, I.; Norris, J.M.; Frohnert, B.I.; Hoffenberg, E.J.; Rewers, M. High Incidence
of Celiac Disease in a Long-term Study of Adolescents With Susceptibility Genotypes. Gastroenterology
2017, 152, 1329–1336. [CrossRef]
21. Troncone, R.; Jabri, B. Coeliac disease and gluten sensitivity. J. Intern. Med. 2011, 269, 582–590. [CrossRef]
[PubMed]
22. Lundin, K.E. Commentary: Transient coeliac disease back on stage again? Scand. J. Gastroenterol.
2005, 40, 1137–1139. [CrossRef] [PubMed]
© 2019 by the authors. Licensee MDPI, Basel, Switzerland. This article is an open access
article distributed under the terms and conditions of the Creative Commons Attribution
(CC BY) license (http://creativecommons.org/licenses/by/4.0/).You can also read