FINLAND Long-term strategy for mobilising investment in the renovation of the national stock of residential and commercial buildings, both public ...
←
→
Page content transcription
If your browser does not render page correctly, please read the page content below
Long-term strategy for mobilising investment
  in the renovation of the national stock of
    residential and commercial buildings,
           both public and private

               FINLAND
______________________________________
  Notification pursuant to Article 4 of the Energy Efficiency Directive
                              (2012/27/EU)
             to the European Commission on 30 April 2014
1 Name of the report Long-term strategy for mobilising investment in the renovation of the national stock of residential and commercial buildings, both public and private – EED Art 4 Name of the client, contact person and contact details Client’s reference Finnish Ministry of the Environment YM27/612/2013 Jyrki Kauppinen PO Box 35 FI-00023 Government Foreword This report relates to the implementation of Article 4 of the Energy Efficiency Directive in Finland. The report was drawn up by the Finnish Ministry of the Environment and the most important interested parties, with support from a research group comprising research scientists from Oulu University of Applied Sciences, Tampere University of Applied Sciences and VTT Technical Research Centre of Finland. In connection with the transposition of the Energy Performance of Buildings Directive (EPBD), Finland introduced cost-optimal levels of minimum energy performance requirements for renovations, which entered into force in 2013. The Finnish Ministry of the Environment promotes the objectives of the Renewable Energy Sources (RES) Directive with regard to buildings undergoing thorough renovation. Comprehensive requirements have been set for renovating the building stock with regard to energy performance. In fact, Article 4 of the EED is designed, instead of setting requirements, for finding ways to mobilise investment in the energy efficiency of public and private residential and commercial buildings and to implement these in a systematic and timely manner in connection with renovation. Contact details for the research group Oulu University of Applied Sciences: Martti Hekkanen, Lecturer, tel. +358 50 317 4558, martti.hekkanen@oamk.fi, Oulu University of Applied Sciences, Kotkantie 1, FI-90250 Oulu Tampere University of Applied Sciences: Eero Nippala, Project Manager, tel. +358 40 546 0174, eero.nippala@tamk.fi, Tampere University of Applied Sciences, Kuntokatu 3, FI-33520 Tampere VTT Technical Research Centre of Finland: Terttu Vainio, Senior Research Scientist, tel. +358 20 722 3419, terttu.vainio@vtt.fi, VTT Technical Research Centre of Finland; Kari Nissinen, Senior Research Scientist, tel. +358 40 585 7539, kari.nissinen@vtt.fi, Registry, PO Box 1000, FI-02044 VTT
2

Contents

Contents ................................................................................................. 2
1. EU and energy efficiency .................................................................... 4
2. Overview of Finland’s building stock ................................................... 5
    2.1 Types of buildings ........................................................................ 5

    2.2 Energy performance of buildings .................................................. 6

          2.2.1 Finland’s climate ................................................................. 6

          2.2.2 Energy performance of buildings ........................................ 7
3. Cost-effective deep renovations suitable for Finland’s climate .......... 14
    3.1 Definitions of deep renovation and staged deep renovation ....... 14

    3.2 Deep renovations – measures and requirements ....................... 15
          3.2.1 Requirements concerning building components................ 15

          3.2.2 Requirements concerning technical systems .................... 15

          3.2.3 Ensuring the proper functioning of a renovated building ... 15
4. Policies and measures that promote deep renovations ..................... 16
    4.1 Regulations ................................................................................ 16
    4.2 Innovations ................................................................................. 16

    4.3 Financial incentives .................................................................... 17

    4.4 Communications......................................................................... 17

    4.5 Labour force, know-how and education ...................................... 17

5. Decision-making, service provision and financing relating to
   renovations ....................................................................................... 18
    5.1 Decision-making ......................................................................... 18

          5.1.1 Householders (detached houses) ..................................... 18
          5.1.2 Housing associations (terraced houses, apartment blocks)19

          5.1.3 Joint-stock property companies, businesses and the public
                sector (rental properties, commercial and office buildings) 19
3
5.2 Business..................................................................................... 20
5.3 Financing.................................................................................... 20
6. Energy savings, reductions in emissions and other benefits ............. 22
6.1 Energy savings and reductions in emissions .............................. 22
6.2 Societal impacts ......................................................................... 23
6.2.1 Impact on employment...................................................... 25
6.2.2 Impacts on national economy ........................................... 25
7. Conclusion ........................................................................................ 26
References............................................................................................ 29
ANNEX A CLASSIFICATION OF BUILDINGS ........................................ 1
ANNEX B DISTRIBUTION BY REGION.................................................. 14
1. EU and energy efficiency
Energy efficiency is one of the priorities of the EU’s Europe 2020 strategy (EU 2010), which
promotes smart, sustainable and inclusive growth and resource efficiency. The goal is to
improve the security of energy supply, to cut emissions and to tap into the energy potential
that is currently lost due to inefficiency.
In 2014 the European Commission introduced a proposal for EU-level climate and energy
policy goals for 2030. These include a 40% cut in greenhouse gas emissions compared to
1990 levels and achieving at least a 27% share of renewable energy consumption (EU,
2014).
The plan for implementing the Europe 2020 strategy (EU, 2011) focuses, with regard to
buildings, on improving energy performance in connection with renovations. The public
sector is to lead by example by introducing energy saving agreements, by improving the
energy performance of public buildings, by including energy efficiency considerations in
public procurement and by obligating energy suppliers to help their customers to lower
energy consumption.
Article 4 of the Energy Efficiency Directive (EU, 2012), which was adopted in 2012, urges
Member States to take measures to encourage investment in the deep renovation of both
public and private residential and commercial buildings.
Article 4
Building renovation
Member States shall establish a long-term strategy for mobilising investment in the
renovation of the national stock of residential and commercial buildings, both public
and private. This strategy shall encompass:
a) an overview of the national building stock based, as appropriate, on statistical
sampling (2. Overview of Finland’s building stock);
b) identification of cost-effective approaches to renovations relevant to the building type
and climatic zone (3. Cost-effective deep renovations suitable for Finland’s
climate);
c) policies and measures to stimulate cost-effective deep renovations of buildings,
including staged deep renovations (4. Policies and measures that promote deep
renovations);
d) a forward-looking perspective to guide investment decisions of individuals, the
construction industry and financial institutions (5. Decision-making, service provision
and financing related to deep renovations);
e) an evidence-based estimate of expected energy savings and wider benefits (6.
Expected energy savings and other benefits).
A first version of the strategy shall be published by 30 April 2014 and updated every
three years thereafter and submitted to the Commission as part of the National Energy
Efficiency Action Plans.5
2. Overview of Finland’s building stock
2.1 Types of buildings
Article 4 of the EED concerns residential buildings and commercial buildings, which include
shops and offices (Annex A).
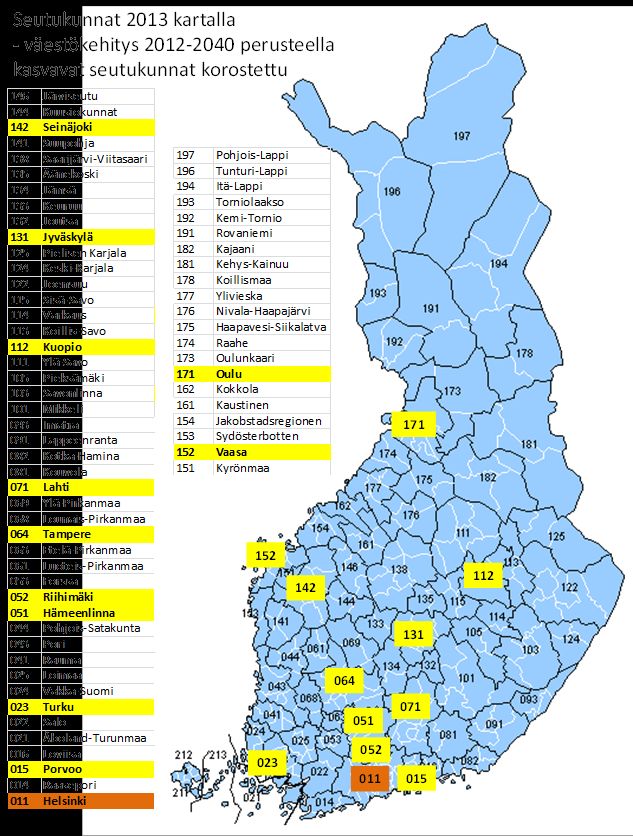
Migration in the last few decades has concentrated Finland’s population and commercial
activity in large urban areas, especially in Southern Finland (Statistics Finland, 2012). As a
result, buildings are left empty in other areas while new buildings are developed and old ones
renovated in the growth areas. This is why the housing stock (Statistics Finland, 2013A) and
building stock (Statistics Finland, 2013B) referred to in Article 4 of the EED are examined as
three separate groups in this report: 1) Helsinki sub-region, 2) other growing sub-regions and
3) sub-regions where population is expected to either decrease or at least not increase
(Annex B).
Table 1. Finland’s land area, population and floor area of residential and commercial
buildings (Statistics Finland, 2012 and Statistics Finland, 2013B)
Commercial
Population in Residential and office
Land area, m2 2012, n buildings, m2 buildings, m2
Helsinki sub-region 5 100 1 445 200 67 447 500 19 434 400
Growing sub-regions 37 000 1 852 700 95 429 200 20 114 000
Other areas 261 800 2 100 400 117 488 200 24 876 000
Total 303 900 5 398 300 280 364 900 64 424 400
A considerable percentage of residential buildings in the Helsinki sub-region are terraced
houses or apartment blocks with multiple housing units. Outside the growing sub-regions, the
majority of residential buildings are detached houses (Diagram 1). Helsinki’s share of
commercial buildings is higher than its share of residential buildings due to the capital’s
sizeable office building stock (Diagram 2).
Asuinrakennukset - sijainti
Erilliset pientalot Rivitalot Kerrostalot
Koko Suomi
Muut sk
Muut kasvu sk
Helsingin sk
0% 20 % 40 % 60 % 80 % 100 %
Lähde: Tilastokeskus
Diagram 1. Distribution of floor area in residential buildings by building type
Finnish English
Asuinrakennukset – sijainti Residential buildings – location
Erilliset pientalot Detached houses
Rivitalot Terraced houses6
Kerrostalot Apartment blocks
Koko Suomi Finland, total
Muut sk Other sub-regions
Muut kasvu sk Other growing sub-regions
Helsingin sk Helsinki sub-region
Lähde: Tilastokeskus Source: Statistics Finland
Liike- ja toimistorakennukset - sijainti
Liike Toimisto Liikenne Kaupan varastot
Koko Suomi
Muut sk
Muut kasvu sk
Helsingin sk
0% 20 % 40 % 60 % 80 % 100 %
Lähde: Tilastokeskus
Diagram 2. Distribution of floor area in commercial and office buildings by building type
Finnish English
Liike- ja toimistorakennukset – sijainti Commercial and office buildings – location
Liike Commercial buildings
Toimisto Office buildings
Liikenne Transport and communications buildings
Kaupan varastot Commercial warehouses
Koko Suomi Finland, total
Muut sk Other sub-regions
Muut kasvu sk Other growing sub-regions
Helsingin sk Helsinki sub-region
Lähde: Tilastokeskus Source: Statistics Finland
2.2 Energy performance of buildings
2.2.1 Finland’s climate
Finland’s climate is a so-called intermediate climate, combining characteristics of both a
maritime and a continental climate. Weather in Finland depends very much on the prevailing
wind direction and on how weather disturbances, i.e. low and high pressures, are situated.
Finland’s mean temperatures are largely determined by its location in the middle latitudes,
mostly between 60° and 70° North. The annual mean temperature varies from more than +5
degrees in southwestern Finland to a couple of degrees below zero in Northern Lapland
(Finland’s Climate Guide).
The warmest time of the year is towards the end of July (Diagram 3). In continental Finland,
the highest summer temperatures outside the long-term averages reach between 32 and 35
degrees. The highest temperature ever recorded in Finland dates back to July 2010: 37.2 °C
at Joensuu airport in Liperi.7
The coldest time of the year is around the end of January / beginning of February. The
lowest winter temperatures in Lapland and Eastern Finland are between -45 and -50
degrees, in other parts of the country usually between -35 and -45 degrees. The lowest
temperature recorded in the 20th century in Finland’s meteorological observing stations was -
51.5 °C in January 1999 (Pokka, Kittilä, 28 January 1999).
Finland has had to invest in energy efficiency because of the cold winters. Controlling
overheating in indoor spaces is a new challenge brought about by the pursuit of energy
efficiency during warm times of the year.
Keskilämpötila Suomessa
20
oC
15
10
5
0
-5 Helsinki
-10 Sodankylä
-15
-20
Tam Hel Maa Huh Tou Kes Hei Elo Syy Lok Mar Jou
Lähde: Ilmatieteen laitos
Diagram 3. Long-term mean temperatures (1981–2010) in Helsinki (Southern Finland) and in
Sodankylä (Northern Finland) (Finland’s Climate Guide)
Finnish English
Keskilämpötila Suomessa Mean temperatures in Finland
Tam Jan
Hel Feb
Maa Mar
Huh Apr
Tou May
Kes June
Hei July
Elo Aug
Syy Sept
Lok Oct
Mar Nov
Jou Dec
Lähde: Ilmatieteen laitos Source: Finnish Meteorological Institute
2.2.2 Energy performance of buildings
Systematic efforts to improve the energy performance of buildings began after the 1970s
energy crises. The first universal U-value requirements were set for building components in
1976 (National Building Code of Finland, C3 Thermal insulation in a building). Approximately8
half of the floor area of Finland’s building stock has been built after the U-value requirements
entered into force.
A regulation concerning renovations that require a permit, changes to the intended use of a
building and replacing technical systems was issued on 27 February 2013. The regulation
obligates builders to improve the energy performance of buildings whenever renovations and
changes are introduced that require a permit. The regulation entered into force in full on
1 September 2013. (Decree No 4/13 of the Finnish Ministry of the Environment)
As shown in Table 2, thermal insulation regulations were tightened the most dramatically in
1978 and 2010. This is why existing building stock and buildings that will be renovated in the
future are examined separately as buildings built before and after 1980.
Table 2. Thermal insulation requirements for new buildings in Finland
U-values of
building C3 1976 C3 1978 C3 1985 C3 2003 C3 2007 C3 2010
components
External walls 0.4 0.29 0.28 0.25 0.24 0.17
Roofs 0.35 0.23 0.22 0.16 0.15 0.09
Floors 0.40 0.40 0.36 0.25 0.24 0.17/0.09
Windows; glass
panes in external 2.1 2.1 2.1
doors 1.4 1.4 1
Solid parts of
0.7 0.7 0.7
external doors
Other baseline values
n50 number 6 6 6 4 4 2
Annual heat
recovery 0 0 0 30% 30% 45%
efficiency
Margin for heat
loss through 0 0 10% 20% 20% 30%
walls and roofs
A clear difference can be seen in the combined specific consumption of heating, hot water,
lighting and other electricity in residential buildings between these two groups of buildings
(Diagram 4). Older detached houses consume a quarter and terraced houses and apartment
blocks a fifth more energy by floor area than newer buildings.9
Energiankulutus - asuinrakennukset
kWh/ 300
Lämmitys ja lämminvesi Sähkö
m2, a
250
200
150
100
50
0
-1980 1980 - -1980 1980 - -1980 1980 -
Erilliset pientalot Rivitalot Kerrostalot
Lähde: Ekorem
Diagram 4. Specific consumption of heating, hot water, lighting and other electricity in
residential buildings by floor area (Heljo et al, 2005, Ekorem)
Finnish English
Energiankulutus – asuinrakennukset Energy consumption – residential buildings
Lämmitys ja lämminvesi Heating and hot water
Sähkö Electricity
Erilliset pientalot Detached houses
Rivitalot Terraced houses
Kerrostalot Apartment blocks
Lähde: Ekorem Source: Ekorem
Detached houses were originally heated with wood, oil and electricity (Statistics Finland,
2013B). Over the years heating systems have been modernised so that electricity has taken
some of the share of both wood and oil (Diagram 5). Geothermal pumps have also been
introduced for heat production.
Asuinrakennusten lämmitys
100 %
80 %
60 %
Puu
40 %
Maalämpö
20 %
Kaukolämpö
0%
Sähkö
Yht. muutettu
Yht. muutettu
Yht. muutettu
1980-
1980-
1980-
-1980
-1980
-1980
Yht. ennen
Yht. ennen
Yht. ennen
Öljy
Erilliset pientalot Rivitalot Kerrostalot
Lähde: Tilastokeskus10 Diagram 5. Original and modernised energy sources in residential buildings (Statistics Finland, 2013B) Finnish English Asuinrakennusten lämmitys Heating systems in residential buildings Puu Wood Maalämpö Geothermal Kaukolämpö District heating Sähkö Electricity Öljy Oil Yht. ennen Original, total Yht. muutettu Modernised, total Erilliset pientalot Detached houses Rivitalot Terraced houses Kerrostalot Apartment blocks Lähde: Tilastokeskus Source: Statistics Finland Terraced houses and apartment blocks have been converted from property-specific heat production to district heating. As Diagram 6 demonstrates, the volume of terraced houses and apartment blocks multiplied by 3.5 between 1970 and 2010 while district heating consumption multiplied by 6.5 (Statistics Finland, 2014). The increase in consumption is the result of old buildings in cities and other built-up areas also having been connected to the district heating network in addition to new buildings.
11

                Kaukolämmityksen yleistyminen
            usean asunnon rakennuksissa 1970-2010
  700

  600
                Kaukolämmön kulutus (GWh)
  500           Rivi- ja kerrostalokanta (m2)

  400

  300

  200

  100

    0
     1970                 1980                  1990           2000              2010
   Lähde: Tilastokeskus

Diagram 6. District heating in buildings with multiple residential units (terraced houses and
apartment blocks) has increased by more than the increase in building stock due to new
development, as buildings built before 1970 have also been connected to the network.
(Statistics Finland, 2014)

Finnish                                                 English
Kaukolämmön yleistyminen usean asunnon                  Popularity of district heating in buildings with
rakennuksissa 1970–2010                                 multiple residential units between 1970 and
                                                        2010
Kaukolämmön kulutus (GWh)                               District heating consumption (GWh)
Rivi- ja kerrostalokanta (m2)                           Terraced houses and apartment blocks (m2)
Lähde: Tilastokeskus                                    Source: Statistics Finland

The specific energy consumption of office buildings built after 1980 is smaller than that of
buildings built before 1980. The specific energy consumption of commercial buildings has
remained unchanged due to an increase in electricity consumption (Diagram 7).
12
Energiankulutus - liike- ja toimistorakennukset
kWh/ 400
m2, a 350 Lämmitys ja lämminvesi Sähkö
300
250
200
150
100
50
0
-1980 1980 - -1980 1980 -
Liikerakennukset Toimistot
Lähde: Ekorem
Diagram 7. Specific consumption of heating, hot water, lighting and other electricity in
commercial and office buildings by floor area (Heljo et al, 2005, Ekorem)
Finnish English
Energiankulutus – liike- ja Energy consumption – commercial and office
toimistorakennukset buildings
Lämmitys ja lämminvesi Heating and hot water
Sähkö Electricity
Liikerakennukset Commercial buildings
Toimistot Office buildings
Lähde: Ekorem Source: Ekorem13
The majority of commercial and office buildings are heated by means of district heating. Old
buildings have been connected to the district heating network, and district heating is now
considerably more widespread than what the statistics drawn up on the basis of the building
register suggest (Diagram 8). This explains the disparity between the development of the
building stock and district heating consumption in Diagram 9 (Statistics Finland, 2014). The
volume of commercial, office and public buildings has tripled while the district heating
consumption of these types of buildings has grown 12-fold.
Liike- ja toimistorakennusten lämmitys
100 %
80 %
Puu
60 %
Maalämpö
40 %
Kaukolämpö
20 % Sähkö
Öljy
0%
-1980 1980- Yht. -1980 1980- Yht.
Liike Toimisto
Lähde: Tilastokeskus
Diagram 8. Original energy sources in commercial and office buildings (Statistics Finland,
2014)
Finnish English
Liike- ja toimistorakennusten lämmitys Heating systems in commercial and office
buildings
Puu Wood
Maalämpö Geothermal
Kaukolämpö District heating
Sähkö Electricity
Öljy Oil
Yht. Total
Liike Commercial buildings
Toimisto Office buildings
Lähde: Tilastokeskus Source: Statistics Finland14
Kaukolämmityksen yleistyminen
liike-, toimisto ja julkisissa rakennuksissa 1970-2010
1300
1200 1970=100
1100 Kaukolämmön kulutus (GWh)
1000
900 Liike-, toimisto- ja julkiset rakennukset (m2)
800
700
600
500
400
300
200
100
0
1970 1980 1990 2000 2010
Lähde: Tilastokeskus
Finnish English
Kaukolämmityksen yleistyminen liike-, Popularity of district heating in commercial,
toimisto ja julkisissa rakennuksissa 1970– office and public buildings between 1970 and
2010 2010
Kaukolämmön kulutus (GWh) District heating consumption (GWh)
Liike-, toimitsto- ja julkiset rakennukset (m2) Commercial, office and public buildings (m2)
Lähde: Tilastokeskus Source: Statistics Finland
Diagram 9. District heating in commercial, office and public buildings has increased by more
than the increase in building stock due to new development, as buildings built before 1970
have also been connected to the network. (Statistics Finland, 2014)
In Finland, three quarters of district heating is produced by cogeneration (CHP) plants.
District heating is mostly produced by means of natural gas (32%), coal (23%) and biofuels
(22%) (Finnish Energy Industries, 2014). There are plans to increase the percentage of
biofuels. Studies show that there is no advantage to be gained from replacing district heating
by property-specific renewable energy systems (Finnish Climate Panel, 2013).
3. Cost-effective deep renovations suitable for Finland’s climate
3.1 Definitions of deep renovation and staged deep renovation
Finland’s building regulations (Decree No 4/13 of the Finnish Ministry of the Environment),
which entered into force in 2013, introduce cost-optimal levels of minimum energy
performance requirements for renovations (Finnish Ministry of the Environment, 2013).
These levels double as Finland’s deep renovation / staged deep renovation levels.
Property owners have the discretion to decide how extensively to renovate their properties
and what the best ways are to improve energy performance within the regulations and in
accordance with the principles of systematic property management in each case. The
national requirements for improving the energy performance of buildings can be waived on a
case-by-case basis in connection with renovations and changes, if achieving the required
standards is not technically, functionally or economically viable.
The timing of renovations is determined by the intended use of a building or any changes to
the same, technology, functionality, economic viability and location.15
Energy performance can be improved by
⇒ modernising building components and systems in stages (staged deep renovation; the
most common way);
⇒ renovating entire buildings (deep renovation ); or
⇒ demolishing entire buildings or parts of buildings if no suitable use can be found due to
the building’s location or condition or for other reasons.
3.2 Deep renovations – measures and requirements
3.2.1 Requirements concerning building components
1. External walls: Original U-value x 0.5, however not exceeding 0.17 W/(m2K). When
changing the intended use of a building, original U-value x 0.5, however at least 0.60
W/(m2K).
2. Roofs: Original U-value x 0.5, however not exceeding 0.09 W/(m2K). When changing
the intended use of a building, original U-value x 0.5, however at least 0.60 W/(m2K).
3. Floors: Improvements to energy performance where possible
4. The U-value of new windows and external doors must be at least 1.0 W/(m2K). When
renovating old windows and external doors, thermal insulation must be improved
where possible.
3.2.2 Requirements concerning technical systems
1. The amount of heat to be recovered from the extracted air originating from a
building’s ventilation system must be equal to at least 45% of the amount of heat
required to heat the ventilation system; in other words, the annual heat recovery
efficiency must be at least 45%.
2. The specific electricity output of a mechanical air intake and extraction system may
not exceed 2.0 kW/(m³/s).
3. The specific electricity output of a mechanical air extraction system may not exceed
1.0 kW/(m³/s).
4. The specific electricity output of an air-conditioning system may not exceed 2.5
kW/(m³/s).
5. The efficiency of heating systems must be improved where possible in connection
with modernising equipment and systems.
6. With regard to modernising plumbing and/or sewerage systems, the regulations
applicable to new developments must be observed.
3.2.3 Ensuring the proper functioning of a renovated building
1. External walls and roofs and technical systems
Anyone undertaking measures to improve the energy performance of the external walls or
roof of a building must ensure that the walls and roof as well as window and door joins are
insulated so that thermal insulation is shielded against the effects of air flow.
When planning and carrying out repairs or replacements of external walls and roofs or
technical systems, the measures must be chosen so as to ensure correct thermal insulation
properties, soundproofing properties and moisture barrier properties as well as fireproofing
properties.
2. Ventilation
If necessary, plans detailing measures to improve the energy performance of a building must
show how the correct functioning of ventilation and sufficient air intake are to be ensured in
the case that the building is equipped with a mechanical air extraction ventilation system or a
gravitational ventilation system.16
If the energy performance of a building is being improved by installing unit-specific
mechanical air intake and extraction systems with heat recovery, these must be designed
and built so as to not cause health concerns in other units due to air intake or extraction.
3. Functioning of technical systems
In connection with improving the thermal insulation or airtightness of the external walls or
roof of a building or a considerable part thereof or in connection with improving the energy
performance of the same or after measures aimed at improving ventilation, proof must be
presented of the correct and energy-efficient functioning of the heating and ventilation
system and any necessary building systems balanced and adjusted as needed.
4. Policies and measures that promote deep renovations
Renovations that improve energy efficiency can be promoted by means of regulations,
innovations, financial incentives, communications and education.
4.1 Regulations
As part of the national implementation of the European Energy Performance of Buildings
Directive (EPBD), energy efficiency requirements have been set for individual components
and systems as well as whole buildings in connection with renovations that are subject to
planning permission (Decree No 4/2013 of the Finnish Ministry of the Environment). All
properties for sale or to let must have an energy performance certificate as of 2013. Energy
performance certificates also include recommendations for improving energy efficiency.
⇒ Guidelines are provided for evaluating which repairs are technically, functionally and
economically feasible.
⇒ Recommendations are also given for repairs that do not require a permit.
Energy efficiency can only be improved if the renovation project is carried out professionally
and with up-to-date technology from start to finish. The client needs to specify what they
want to achieve with the renovation in terms of energy efficiency, the engineers need to find
the means to meet these objectives, and the builders need to carry out the repairs and
ensure that the energy performance targets set are reached in practice. Regulations and
recommendations need to be supported by high-quality engineering and building know-how.
⇒ The importance of careful planning and skilled builders in achieving a high-quality end
result needs to be emphasised.
4.2 Innovations
The energy performance of buildings is a goal and research topic shared by many countries.
New technologies and solutions come from investing in a common objective. New solutions
need to be tested in real environments.
⇒ Regulations are waived to enable the testing of breakthrough technologies.
Energy services companies (ESCOs) provide independent energy consultants to coordinate
investments and measures to cut energy consumption (ESCO, 2014). The costs of the
ESCO service, including the investment, are covered by the savings brought about by lower
energy bills.
⇒ The ESCO concept needs to be made use of in the adoption of new technologies.
Building information modelling (BIM) should be introduced for renovations in old buildings as
well. New technologies, such as laser scanning, should be used where possible to gather17 basic information about the property. A computerised model of the building site would help builders to visualise the project and serve as a tool for ensuring occupational safety and efficient communication. ⇒ Modelling and new technologies need to be used in renovation projects. The information generated by modelling (PRE, 2014) could be used to produce dynamic energy production and consumption simulations to find the optimal renovation solution for each property. Incorporating cost calculations into the model would allow engineers to find the most cost-effective solution considering the remaining life of the building. ⇒ Dynamic energy consumption simulations need to be made use of when choosing between renovation alternatives. ⇒ Information generated by modelling and simulation software needs to be made use of in property management. 4.3 Financial incentives The availability of renovation and energy subsidies for housing companies has been relatively limited, and they have mostly been used to revive the economy and boost employment. In order to make financial incentives more effective, they need to be longer-lasting and less changeable. Incentives could also be introduced for renovation projects that go above and beyond what is required as well as for testing new technologies and concepts. Comprehensive energy performance renovations could also be promoted. ⇒ Financial incentives need to be targeted at renovations that make a bigger impact on energy performance. 4.4 Communications Information needs to be disseminated about the best ways to improve energy efficiency as well as successful projects. Misconceptions also need to be cleared up. The benefits and costs of renovations need to be discussed equally. ⇒ It is important to invest in making information about renovations widely available so that news about breakthrough technologies can be disseminated effectively. ⇒ Successful energy performance renovations need to be advertised to encourage a domino effect. ⇒ Disseminating information about renovation concepts and best practices as well as risks associated with specific solutions is especially important. In the context of deep renovations, the effect of efficient use of space on energy performance could be a more informative indicator than energy consumption by floor area. This is the case especially with projects in which changes are introduced to how and for what purpose space is used. ⇒ One useful indicator for measuring improvement in energy efficiency could be energy consumption per actual user (kWh/resident or worker) or visitor (kWh/user or customer) if changes are made to how space is used in connection with a renovation project. 4.5 Labour force, know-how and education The concept of energy efficiency as an integral part of all renovations should be emphasised by incorporating it into the curriculum at all levels of construction education. Energy efficiency
18

and renovations are essential elements of life cycle management, a discipline that has so far
been largely neglected in education in favour of courses focusing on new development.
Courses are needed for both young people and mature students and for both new recruits
and professionals who have already established themselves in the industry.

⇒ Material efficiency as part of life cycle management needs to be factored into teaching.

⇒ Courses focusing on renovation projects need to include lessons on ways to improve
  energy efficiency as well as new technologies.

⇒ Virtual learning resources need to be produced.

5.     Decision-making, service provision and financing relating to
       renovations
With regard to renovation projects, crucial decisions are made in connection with target-
setting even before planning begins. Engineers are responsible for finding solutions that
satisfy the objectives set, builders for carrying out the work, and property managers for
maintaining the level of energy performance achieved. Ultimately, decisions are made by
property owners.

The majority of residential buildings (95%) and commercial and office buildings (90%) in
Finland are privately owned (Statistics Finland, 2013B). Private property owners include
individual households (detached houses), housing associations of householders (terraced
houses, apartment blocks), joint-stock property companies (rental properties, rented
commercial and office buildings) and businesses (owned commercial and office buildings).
Compared to the private sector, the public sector owns relatively few rental properties (5%)
and commercial and office buildings (10%). However, the public sector has shares in multiple
joint-stock property companies that are listed as private-sector companies in statistics.

5.1    Decision-making
5.1.1 Householders (detached houses)
Householders who own their homes make all decisions concerning their properties and also
often carry out any necessary repairs themselves. Detached houses are maintained by their
owners. A (voluntary) property inspection is carried out in connection with most sales.
Provisions on energy performance certificates were enacted in connection with the
implementation of the Energy Performance of Buildings Directive (EPBD). Financial
incentives for renovations include tax credits and lower energy bills. Other incentives include
functional and qualitative improvements to the property, such as increased comfort of living
and usability.

Renovations are often triggered by sales, as new owners often have needs that make
alterations necessary. Detached houses are left empty in areas where population is
decreasing. It is also worth investing in improving energy performance when renovating
detached houses, as this helps to optimise life cycle costs (Finnish Ministry of the
Environment, 2013).

⇒ Renovation concepts that incorporate measures to improve energy performance need to
  be favoured.

⇒ With regard to individual properties, it makes sense to examine the potential benefits of
  different forms of energy, including renewable sources of energy.
19 5.1.2 Housing associations (terraced houses, apartment blocks) Housing associations are legal entities that either own or lease plots of land and own any properties on that land. The occupants of the units in the properties act as shareholders in the housing association. According to the Finnish Limited Liability Housing Companies Act, responsibility for maintaining the building and any basic utility systems of a housing association lies with the Board of Directors and the Manager appointed by the Board, who must act in accordance with the decisions of the General Meeting. The division of responsibilities laid down in the Articles of Association specifies the responsibilities of the housing association and the occupants of individual units. The shareholders decide on renovations and pay for any repairs to the buildings and basic utility systems of the company together. In Finland, the building stocks of housing associations are usually relatively small. The average housing association controls 21 units (Statistics Finland, 2013A). The Finnish Limited Liability Housing Companies Act (1599/2009), which entered into force in 2010, obligates housing associations to draw up and present to the General Meeting a condition survey of their properties every five years. When selling shares in a housing company, the vendor must present a certificate from the building manager, which includes technical details and the company’s financial statements as well as information about the condition of the property and its energy performance certificate. The shareholders of a housing association are not entitled to tax credits for repairs for which the company is responsible. The state budget includes annual renovation subsidies for housing associations. ⇒ Condition surveys should ideally factor in energy performance improvements to be carried out in connection with repairs that are more far-sighted than the mandatory five years. 5.1.3 Joint-stock property companies, businesses and the public sector (rental properties, commercial and office buildings) These kinds of buildings are either used by their owners or let out. In both cases, the use of the building plays a big role when deciding on renovations. Businesses that operate in their own premises pay little attention to property management costs. Properties that are let out, on the other hand, can bring a bigger return on the landlord’s investment if energy costs are lower. Property owners are encouraged to increase the energy performance of their buildings by means of an agreement scheme (Motiva, 2014), which is designed to help Finland meet its international obligations in mitigating climate change. Voluntary energy efficiency agreements have been signed with the property sector, the service sector and the local government sector. Businesses and non-governmental organisations that have signed an energy efficiency agreement set their own targets for increasing energy efficiency, carry out measures and report annually on their progress and other initiatives aimed at improving energy efficiency. One of the most important goals of the agreement scheme is to promote the adoption of new, energy-efficient technologies and services among businesses and local governments. The state supports participating businesses and non-governmental organisations in carrying out energy audits and analyses and can also contribute towards energy efficiency investments and the costs of adopting new, energy-efficient technologies. ⇒ Improvements in energy performance need to be incorporated into renovations. ⇒ The best practices, technologies and partnerships discovered in the course of the energy efficiency agreement schemes need to be put to use.
20

⇒ The services of ESCOs need to be made use of to improve energy efficiency.

The Finnish Association of Building Owners and Construction Clients has developed a
number of operating models and tools that are designed to improve eco-efficiency in
contracts between landlords and tenants (Finnish Association of Building Owners and
Construction Clients, 2011). Tenancy agreements can include provisions on energy
efficiency targets, forms of energy, metering and cost sharing.

⇒ The green lease and light green lease concepts need to be made use of.

5.2    Business
For many construction sector businesses, renovations have represented a market that can
be used to offset fluctuations in demand for new development. For companies, it has been
important to operate in several market segments in order to secure the continuity of
operations. Such companies have been found to last longer than highly specialised
companies. Some construction concepts are equally well suited to both new developments
and renovations.

While the best-run companies in the industry focus on catering to today’s needs, they may
miss out on future business opportunities, i.e. products and services that are specifically
suited to renovations.

⇒ Deep renovations are an opportunity for new businesses to focus on developing
  renovation products and on conquering future markets.

Renovation construction and especially energy renovations that are focused on improving
energy management have been studied extensively. Sound technical and economic
concepts have been developed.

⇒ Commercial exploitation of the results of R&D&I projects and new business need to be
  promoted.

Developing an energy renovation business requires efficient coordination between products,
service processes, customers and construction processes. If the property to be renovated is
in use, more focus can be given to the production process instead of the end result. In
addition to the mechanical and technical components, the process also includes customer
care and communication.

Customers are especially likely to be dissatisfied with surprises, failed schedules and
careless conduct on site.

⇒ Services need to be tailored to match the range of products available, and suitable
  production systems and know-how need to be developed.

5.3    Financing
The state has mostly granted financial support to housing associations according to
economic trends. Households have benefited from tax credits.

The building’s owners finance any necessary repairs themselves (savings, revenue,
reserves, funds) or apply for bank loans or, in special circumstances, loans or interest
subsidies from the Housing Finance and Development Centre of Finland. Funding from the
Housing Finance and Development Centre of Finland is generally only available for non-profit
organisations.

The availability of bank loans depends on the applicant’s ability to pledge collateral. In areas
where house prices are low, the required loan amount may be too high considering the
market value of the property.
21

In housing associations, the shareholders pay back any loans through their service charges.
According to the renovation barometer of the Finnish Real Estate Federation, half of all
housing associations that have taken out loans have a loan term of less than 10 years
(Finnish Real Estate Federation, 2013). In rental properties and rented business premises,
the costs of renovation are carried over to the rent charged by the owner for the property in
question or the owner’s entire property portfolio.

In the residential sector, the problem lies in the high costs of renovations relative to
households’ wealth (Oja, 2013).

Housing associations have recently begun to finance renovations by applying for new
planning permissions and selling land to developers. Parking is a critical issue in these
cases. Solving the parking issue requires timely support from planning authorities and
sometimes also centralised parking facilities. From the perspective of local governments’
infrastructure and services, adding more floor space to an existing residential property is a
cheap alternative to acquiring planning permission for a completely new area (Nykänen,
2013).

It often makes more financial sense to demolish residential and commercial properties that
are in poor repair than to renovate them if a building with more floor space can be built in
their place. In these cases, improvements in energy performance stem from the new
buildings satisfying modern energy efficiency regulations.

⇒ Options other than traditional forms of financing also need to be explored when
  contemplating deep renovations.

In Finland, the ESCO concept is used to finance renovations in buildings owned by the public
sector and businesses, especially in production facilities. The ESCO concept has not been
popular among housing associations, as individual housing associations generally only
control a small amount of building stock. The ESCO concept could be used to promote the
adoption of new technologies.

⇒ Financing through ESCOs needs to be taken advantage of to promote deep renovations
  in both residential and commercial properties.
22

6.     Energy savings, reductions in emissions and other benefits

6.1    Energy savings and reductions in emissions
The premise is that renovations aimed at improving energy efficiency are carried out in
connection with renovations necessitated by other reasons. The frequency of repairs (Vainio,
2002) depends on the age of the building and its components (façades, ventilation, hot
water, building services and electrical systems). Some buildings are demolished or
decommissioned otherwise. Loss factors have been calculated for the purpose of drawing up
energy consumption forecasts (Nippala, 2012).

Conduction losses

In connection with façade renovations, the U-values of external walls are halved and
windows modernised. In 1970s apartment blocks, for example, this means that the original
wall U-value of 0.45 W/m2K drops to 0.22 W/m2K. The window U-value drops from
2.0 W/m2K to 1.0 W/m2K.

In detached houses, insulation is added to the roof so as to halve the roof U-value. It is not
always possible to add insulation to the roofs of apartment blocks, which is why apartment
block roofs are excluded from these calculations.

Hot water

In connection with replumbing old properties, the goal is to lower the pressure and introduce
modern, economical bathroom suites. This lowers energy consumption resulting from the use
of hot water, as the same end result can be achieved with smaller volumes of water.

Ventilation

Ventilation systems are equipped with heat recovery units whenever new mechanical air
intake and extraction systems or mechanical air extraction systems are installed.

Electricity consumption

The premise is that electricity consumption remains unchanged. The number of appliances
increases, but as they are increasingly energy-efficient, there is no increase in electricity
consumption (e.g. laptops instead of desktop computers and LEDs instead of incandescent
light bulbs).

Heating

By 2050, the share of electrical heating systems will drop by 75% from the current level
(Table 3) and oil-based heating systems will disappear from residential properties altogether.
In commercial and office buildings, the share of oil-based heating systems will drop by 60%
from the current level (Table 4).

Table 3. Share of electrical heating. Source: Statistics Finland (2013B)

                                Percentage Target
                                  in 2013  for 2050
Detached houses                        45%      11%
Terraced houses                        29%       7%
Apartment blocks                        2%       1%
Commercial and office buildings        12%       3%
23
Table 4. Share of oil heating. Source: Statistics Finland (2013B)
Percentage Target
in 2013 for 2050
Detached houses 19% 0%
Terraced houses 9% 0%
Apartment blocks 6% 0%
Commercial and office buildings 18% 7%
The energy savings to be achieved by means of renovation are substantial for a single
property but across the entire building stock their impact is relatively minor (Diagram 10a, b),
as the number of renovations is low relative to the volume of buildings (Table 5). In addition
to renovations, the decommissioning of old buildings also affects energy consumption. By
2020, renovations can help to cut energy consumption in residential, commercial and office
buildings by four per cent, while the loss of old buildings will contribute a similar decrease.
In the long term (until 2050), renovations will contribute slightly more to the decrease in
energy consumption than the loss of old buildings.
Carbon dioxide emissions will decrease by more than energy consumption (Diagram 10c), as
fossil fuel heating systems will be replaced by emission-free fuels in connection with
renovations.
Table 5. Estimated impact of renovations on the energy consumption and greenhouse gas
emissions attributable to residential, commercial and office buildings in the light of research
and statistics. The figures include both traditional renovations (“BAU”) and deep renovations
(Airaksinen & Vainio, 2013).
Cumulative change
2012 2020 2030 2040 2050
Impact of loss of old buildings, GWh -3 638 -7 277 -11 370 -15 463
90 958
Impact of renovations, GWh -4 082 -9 610 -13 817 -18 024
Energy consumption, GWhe 109 469 -8 115 -18 035 -27 462 -36 889
Reduction in greenhouse gas emissions, CO2-
1 000 tn 20 587 -2 622 -5 621 -8 114 -10 607
Impact of loss of old buildings, GWh/% -4% -8% -13% -17%
Impact of renovations, GWh/% -4% -11% -15% -20%
Total, GWh/% -8% -19% -28% -37%
Reduction in greenhouse gas emissions, CO2-
1 000 tn / % -13% -27% -39% -52%
6.2 Societal impacts
Renovations cover all basic repairs, modernisation and maintenance. A total of
approximately EUR 7.5 billion was spent on repairs in the kinds of residential, commercial
and office buildings discussed in this report in 2013. Between 20 and 30 per cent of these
renovations are such that can incorporate measures to improve energy efficiency.
Measures to improve energy efficiency (BAU + deep renovation) increase the cost of
renovation projects by 5–15% (Vainio, 2012). With the average increase in costs attributable
to measures to improve energy efficiency (10%), the increase in the volume of renovations in
residential, commercial and office buildings amounts to between EUR 150–200 million per
year at 2013 prices.24
Rakennuskannan energiankulutus
GWh vuodessa
100 000
90 000
80 000
70 000
60 000
50 000
40 000
30 000
20 000
10 000
0
2012 2020 2030 2040 2050
Rakennuskannan E-luku
GWh vuodessa
100 000
80 000
60 000
40 000
20 000
0
2012 2020 2030 2040 2050
Rakennuskannan hiilidioksidipäästöt
1000 tonnia vuodessa
25 000
20 000
15 000
10 000
5 000
0
2012 2020 2030 2040 2050
Diagram 10a, b, c. Total impact of renovations and the loss of old buildings on the energy
consumption and greenhouse gas emissions of residential, commercial and office buildings
calculated according to the source data and assumptions given in Chapter 6.1 of this report.
Finnish English25 Rakennuskannan energiankulutus GWh Energy consumption of buildings, GWh/a vuodessa Rakennuskannan E-luku GWh vuodessa Energy rating of buildings, GWh/a Rakennuskannan hiilidioksidipäästöt 1000 Carbon dioxide emissions of buildings, tonnia vuodessa 1 000 t/a 6.2.1 Impact on employment The impact of renovations on employment is calculated on the basis of end products: the amount of work needed to design and make the products and services used in renovations, to deliver them to the construction site and to install them. For example, adding insulation and a new coat of paint to existing façades requires more work than doing the same to pre-cast elements at a factory. Demolition requires labour force on site but contributes nothing to the construction products industry. Adjusting a heating system requires labour force but only a little engineering and no construction products. A million-euro investment in renovation provides employment for a total of approximately 16 people across the entire chain. The chain used in this figure is more comprehensive than that used in official structural statistics on national economy, which are based on the input-output model. According to the official definition, the multiplier effect of a construction site only covers any products and services sourced for the site and excludes any engineering and construction works, as these are not per se sourced for the site. This analysis, however, also covers engineering and construction. A million-euro investment equates to eight person-years of work at a renovation site, to five person-years of work at an industrial site and to three person-years of work in the service sector (Vainio, 2001; Vainio, 2011). Improving energy efficiency in connection with a renovation project can increase workload by between two and three per cent compared to a normal renovation of a residential, commercial or office building (Table 6). Table 6. Impact of renovations and associated measures to improve energy efficiency on the volume of residential, commercial and office buildings and employment across the entire chain including contractors’ purchases. Volume of renovations in residential, Measures for improving commercial and office buildings in 2013, energy efficiency EUR million 7 500 +150 +200 Construction sites, person-years of work 60 000 1 200 1 600 Construction materials industry, person- years of work 37 500 750 1 000 Construction-related services, person- years of work 22 500 450 600 Total impact on employment, person-years of work 120 000 2 400 3 200 Increase, % 2.0% 2.7% 6.2.2 Impacts on national economy Renovations are paid for by property owners, the majority of whom are private householders (detached houses, housing associations) and businesses. In renovation projects, labour accounts for approximately 30% of costs, domestic construction products for 50% and
26

imported products for 15%. The remainder is made up of machinery costs, taking into
account depreciation.

A 10% renovation subsidy generates a total of 32% tax revenue in the form of income tax,
company tax, value added tax and social insurance contributions.

The construction chain includes businesses from multiple sectors (construction, trade,
transport and manufacturing). With the help of the input-output model used in national
economy statistics, labour costs and imported products used in manufacturing can be
separated from the contribution of the manufacturing industry.

Table 7. Conversion of the added costs resulting from measures to improve energy efficiency
(EUR 200 million) into revenue benefiting the national economy. The analysis is based on
the year 2013.

Households                               44 Households                          44
                                          8 Construction and specialist
                                                                                 8
Developers’ revenue                         works
Developers’ productive capital            4
Other businesses’ revenue                14 Other services and industry         26
Other businesses’ productive              8
capital
Earnings-related pensions                18 Insurance                           22
Unemployment, accidents                   4
                                          2 Taxes and social insurance
                                                                                45
Social security and sick pay                contributions
State tax                                 8
Value added tax                          22
Church tax                                1
Council tax                              12
Imports                                  58 Imports                             58
Total, EUR million                      200 Total, EUR million                 200

The volume of work is substantial. An additional investment in energy efficiency (EUR 200
million) would generate EUR 44 million in net income for households. The state, local
governments and church would receive EUR 45 million in tax revenue and insurance
companies EUR 22 million in insurance premiums. A lot of metal industry products (building
services) are used in renovation projects, which increases the percentage of products that
need to be imported. A total of 80% of construction products imported by Finland originate
from the EU.

The combined profits and capital expenditure of the businesses involved in the chain amount
to EUR 34 million, of which profits for construction firms and specialist engineering
companies account for EUR 8 million.

7.     Conclusion
Overview of Finland’s building stock

Finland has 280 million square metres of residential properties and 64 million square metres
of commercial properties. Approximately half of the building stock was built after 1980 and
the energy performance of these buildings is relatively good, as the energy performance
regulations governing new development were tightened in 1978 in response to the 1970s
energy crises.
27
The majority of buildings with multiple residential units and commercial buildings are
connected to the district heating network. Three quarters of all district heating is produced by
means of cogeneration (CHP). In 2013, coal accounted for 23%, natural gas for 31% and
biofuels for 22% of district heat generation. There are plans to increase the percentage of
biofuels.
Electricity currently accounts for 45% of the heating energy of detached houses and oil for
19%. Oil-based heating systems in particular are usually replaced by heat pumps in
connection with property-specific heating system modernisation projects.
Cost-effective deep renovations suitable for Finland’s climate
The Decree of the Finnish Ministry of the Environment, passed in 2013, obligates all
individuals undertaking a renovation, alteration or system modernisation project that requires
permission to also incorporate measures to improve energy efficiency into the project. The
regulation introduces cost-optimal levels of minimum energy performance requirements for
individual building components and for total energy consumption.
The levels laid down in the regulation also double as Finland’s deep renovation levels. The
regulation includes guidelines for both one-off deep renovations and staged deep
renovations.
The component-specific requirements are as follows:
1. External walls: Original U-value x 0.5, however not exceeding 0.17 W/(m2K). When
changing the intended use of a building, original U-value x 0.5, however at least 0.60
W/(m2K).
2. Roofs: Original U-value x 0.5, however not exceeding 0.09 W/(m2K). When changing
the intended use of a building, original U-value x 0.5, however at least 0.60 W/(m2K).
3. Floors: Improvements to energy performance where possible
4. The U-value of new windows and external doors must be at least 1.0 W/(m2K). When
renovating old windows and external doors, thermal insulation must be improved
where possible.
The requirements applicable to technical systems are as follows:
1. The amount of heat to be recovered from the extracted air originating from a
building’s ventilation system must be equal to at least 45% of the amount of heat
required to heat the ventilation system; in other words, the annual heat recovery
efficiency must be at least 45%.
2. The specific electricity output of a mechanical air intake and extraction system may
not exceed 2.0 kW/(m³/s).
3. The specific electricity output of a mechanical air extraction system may not exceed
1.0 kW/(m³/s).
4. The specific electricity output of an air-conditioning system may not exceed 2.5
kW/(m³/s).
5. The efficiency of heating systems must be improved where possible in connection
with modernising equipment and systems.
6. With regard to modernising plumbing and sewerage systems, the regulations
applicable to new developments must be observed.
Policies and measures that promote deep renovations
Finland’s national strategy emphasises innovation, communications, skilled labour and
education. The energy performance of buildings is a goal and research topic shared by many
countries. New technologies and solutions come from investing in a common objective, and
these need to be widely disseminated. Lessons learnt about the best ways to improve energy
efficiency as well as successful projects need to be shared.You can also read