Lower columbia region attainable housing needs assessment by matt thomson
←
→
Page content transcription
If your browser does not render page correctly, please read the page content below

lower columbia region
attainable housing needs assessment

by matt thomson
Acknowledgements

The Affordable Housing Committee of the LCCDTS would like to thank the following organizations
for providing the financial support that made this report possible:

Columbia Basin Trust
Kootenay Savings Credit Community Foundation
Canada Mortgage and Housing Corporation
City of Rossland
City of Trail
Village of Fruitvale
Areas A and B of the Regional District Kootenay Boundary

The Committee would also like to thank BC Non-Profit Housing Association for collaborating in this
project and the Villages of Montrose and Warfield for providing ready access to information on local
planning and housing policy

The consultant would also like to acknowledge the hard work and dedication of a number of
organizations that have been integral to the development of this report.

Affordable Housing Committee of the LCCDTS:

        Janet Morton, Chair
        Craig Adams, Community Futures of Greater Trail
        Donna Dean, Regional District of Kootenay Boundary
        Gail Lavery, Trail Family and Individual Resource Society
        Patricia Marshall Thompson, City of Rossland Sustainability Commission
        Al Graham, City of Trail
        Sue Flagel, Canadian Mental Health Association of the Kootenays
        Libby Nelson, Village of Fruitvale
        Jeanne Kim, Kootenay Savings Credit Union
        Bert Kniss, Village of Fruitvale
        Terry Van Horn, Lower Columbia Initiatives Corporation
        Ann Damude, Local Consultant

The consultant thanks the many individuals and organizations in the Lower Columbia Region that
participated in the key informant interviews early on in the project. Their insight was invaluable.

The consultant would also like to thank Mark Cecchini, with Teck Resources Limited and the
Kootenay Real Estate Board for the additional data they provided.

cover photography:
Brian Findlow

                                                                                                       i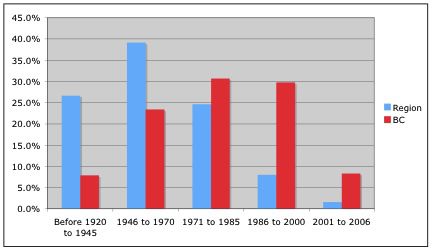
lower columbia region
attainable housing needs assessment

submitted by matt thomson

to the attainable housing committee of the lower columbia community
development team society

                                                                      iii
Table of Contents

                  Acknowledgments							                                          i

                  Table of Contents							                                        iii

                  List of Tables and Figures						                                iv

                  Executive Summary							                                        vii

                  1. Introduction								                                         1
                          1.1    Background and Purpose					                      1
                          1.2    Approach						                                   1
                          1.3    Methods						                                    2
                          1.4    Limitations						                                4

                  2. Community Demographic and Economic Profile			                5
                        2.1     Population and Demographics				                   5
                        2.2     Income							                                     10
                        2.3     Economic Profile						                            13
                        2.4     Households						                                  16

                  3. Housing Profile							                                       18
                          3.1    Dwellings by Type					                           18
                          3.2    Dwellings by Tenure					                         22
                          3.3    Age and Condition					                           23

                  4. Current Attainable Housing Need and Available Supply		       25
                          4.1     Homelessness						                              25
                          4.2     Households with Affordability Issues			         26
                          4.3     Social Housing Supply					                      27
                          4.4     Market Housing Supply					                      31
                          4.5     Housing Cost						                              32
                          4.6     Affordability Analysis					                     37

                  5. Emerging Housing Needs and Gap Analysis				                  41
                         5.1    Priority Needs and Options				                    41
                         5.2    Anticipated Affordable Housing Supply			          41
                         5.3    Gaps in Housing for Homeless and
                                At-Risk Individuals					                          42
                         5.4    Emerging Needs and Gaps for Households
                                with Affordability Issues					                    42
                         5.5    Gaps in Housing for Youth				                     44
                         5.6    Gaps in Housing for People With Special Needs		   44

iv lower columbia region attainable housing needs assessment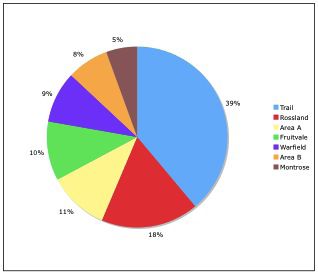
5.7    Emerging Housing Needs and Gaps for Seniors		   44
       5.8    Rental Market Gaps					                         47
       5.9    Emerging Housing Needs and Gaps for
              Entry-Level Ownership					                      47

6. Key Informant Perspectives						                           49
        6.1    Community-Specific Issues				                  49
        6.2    Regional Challenges and Barriers				           53
        6.3    Regional Assets and Opportunities			           55

7. Summary and Next Steps						                               58

References								                                            62
Appendix 1: List of Key Informants					                       64
Appendix 2: Key Informant Interview Guide				                 65

List of Tables and Figures
Table 2.1: 2006 Population and Growth by Jurisdiction			      5

Table 2.2: Proportion of the Population by Gender,
Across Jurisdictions, the Region and the Province				         7

Table 2.3: Share of Population by Age Groups; across
Jurisdiction, Region and Province, 2006					                  8

Table 2.4: Share of Population by Age Groups;
across Jurisdiction, Region and Province, 2001				            9

Table 2.5: Median And Average Income, for 2000 and 2005		     11

Table 2.6: Incidence of Low-Income in Households and
Unattached Individuals by Jurisdiction, 2005				              12

Table 2.7: Low Income Cut Offs for 2006					                  12

Table 2.8: Source of Income for 2008					                     13

Table 2.9: Labour Force by Industry, 2006					                14

Table 2.10: Labour Force by Occupation, 2006				              15

                                                                   v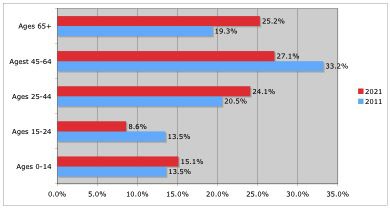
Table 2.11: Households by Household Type, 2006				                  16

                  Table 2.12: Projected Change in Number of Households in
                  the Greater Trail Health Area 2011-2021					                        17

                  Table 3.1: Dwelling by Type and Jurisdiction, 2006				              18

                  Table 3.2: Total Number of Units of Residential Construction
                  by Year and Type, Between 2002 and 2010				                         20

                  Table 3.3: Total Number of Units of Residential Construction
                  by Community and Type, Between 2002 and 2010				                    21

                  Table 3.4: Dwellings by Tenure, 2006					                           23

                  Table 3.5: Age of Dwellings as of 2006					                         24

                  Table 3.6: Condition of Housing Stock by Jurisdiction, 2006		       25

                  Table 4.1: Core Housing Need in LCR Jurisdictions, 2006			          26

                  Table 4.2: Number of Households Receiving Rental Assistance
                  Program Subsidies							                                            27

                  Table 4.3: Social Housing Supply
                  in the Lower Columbia Region, 2011					                             28

                  Table 4.4: BC Housing Shelter Aid for Elderly Renters, 2011			      29

                  Table 4.5: Total Number of Listings in 2010				                     32

                  Table 4.6: Average Household Dwelling Value				                     33

                  Table 4.7: Average and Median Home Prices by Type, 2010			          34

                  Table 4.8: Average Sale Price of a Detached Single Family
                  Dwelling Between 2007 and 2010					                                 34

                  Table 4.9: Median Sale Price of a Detached Single Family Dwelling
                  Between 2007 and 2010							                                        35

                  Table 4.10: Average Sale Price of a Townhouse				                   35

vi lower columbia region attainable housing needs assessment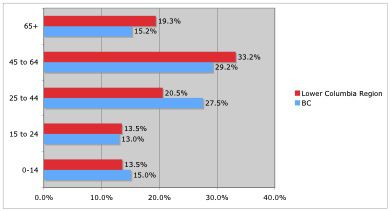
Table 4.11: Average Sale Price of An Apartment/Condominium		            35

Table 4.12: Average Sale Price of a Duplex					                         36

Table 4.13: Rental Rates, 2010						                                    37

Table 4.14: Rental Rates, 2011						                                    37

Table 4.15: Affordable Rent and Ownership Costs				                     38

Table 4.16: Peak Median Prices (2007-2010)
and Impact on Attainability						                                       39

Table 4.17: Impact of 6% Interest Rate on Attainable Ownership		        39

Table 5.1: Priority Housing Needs and Options				                       41

Table 5.2: Number of Seniors by Community, 2006				                     45

Table 5.3: Number of Units Available for Every 100 Senior
Citizens, based on 2006 Seniors Population				                          46

Table 7.1: Strategic Housing Options by Jurisdiction			                 60

Figures
Figure 2.1: Population Projections to 2021, Greater Trail Health Area   6

Figure 2.2: Population Distribution, 2006					                          6

Figure 2.3: Estimated Share of Population by Age Groups, 2011		         8

Figure 2.4: Share of Population by Age Groups, Projections to 2021		    10

Figure 3.1: Dwelling by Type and Jurisdiction, 2006			                  19

Figure 3.2: Age of Dwellings as of 2006, LCR and BC			                  24

                                                                             vii
Executive Summary
The Lower Columbia Region (LCR) is located in the southwestern portion of the Columbia River Basin
in the West Kootenay Region of British Columbia. Approximately 20,000 people live in the study
area, which includes the municipalities of Fruitvale, Montrose, Rossland, Trail, Warfield, and Electoral
Areas A and B of the Regional District of Kootenay Boundary (RDKB).
Over the last ten years, the LCR’s housing market has experienced significant change in purchase
and rental prices. The market has slowed in the last two to three years, providing an opportunity for
planning for future housing needs. Current and future drivers of the housing market trends in the
LCR include an aging population, significant workforce renewal as major employers replace retiring
workers and, depending on the recovery of North American housing markets, real-estate speculation
of the type that was prominent in the region in the early to mid 2000s.
The purpose of the Lower Columbia Region Attainable Housing Needs Assessment is to assess the
extent and nature of the need for attainable housing in the LCR, in order to plan for the next ten
years. It incorporates a quantitative analysis of local demographics, economy and housing issues and
the findings of an extensive series of stakeholder interviews. It identifies both community-specific and
region-wide issues and challenges, existing housing assets, current and emerging housing needs and
provides a gap analysis on the types of housing solutions that can address the needs identified. Finally,
it provides some examples of how communities and the region as a whole can move forward to address
the gaps identified. These examples are not an exhaustive nor prescriptive set of recommendations,
but are instead intended to provide some direction for the next phase of this project, which will
develop a strategic plan to address housing in the LCR.
The data presented in the study reveal a number of key issues in the area that do currently or will
impact the housing market in the LCR. The current housing profile shows that detached single-family
dwellings are the predominant form of housing, representing approximately 80% of all dwellings in
the region. The housing stock is significantly older than housing in the province as a whole, with 90%
of all housing in the LCR 25 or more years of age. Census data shows that there are more dwellings
in need of major or minor repair than the province as a whole, an issue repeated by a number of key
informants. They note that maintenance issues tend to adversely impact low-income renters and
households with affordability issues. While rents are lower in the LCR than in urban areas, inexpensive
rents often mean poor housing maintenance standards.
Despite the presence of some low-cost rentals, there are still many households experiencing affordability
issues. According to CMHC, “Core housing need refers to households which are unable to afford
shelter that meets adequacy, suitability, and affordability norms. . . Affordability, one of the elements
used to determine core housing need, is recognized as a maximum of 30 per cent of the household
income spent on shelter.”1 Currently, 17% of all households (nearly 1400 households total) experience
core housing need, while 40% of all renters (645 households) experience it.
1. From CMHC’s Affordable Housing FAQ. Available at: http://www.cmhc-schl.gc.ca/en/corp/faq/faq_002.cfm#4
viii lower columbia region attainable housing needs assessmentAnother emerging issue for the region is homelessness. In February and March 2011, an extreme
weather emergency shelter opened in Trail for the first time to address street homelessness and was
regularly used by a number of clients. While it is difficult to enumerate homeless individuals without
a significant investment of resources, key informants have nonetheless identified homelessness and
risk of homelessness as key issues, particularly in Trail, which serves as the service centre for the region.
While street homelessness is visible in Trail, key informants noted that it probably represents a small
subsection of individuals who experience risk of homelessness or significant volatility in their housing
situation on a regular basis. Many of these individuals may have mental health or addictions issues.
A major demographic issue is the aging population across the LCR. BC Stats projects that over 25%
of the population will be 65 or older by 2021, which will significantly increase the demand for seniors
housing over this time period. While seniors housing options currently appear to be adequate, key
informants noted a lack of options for low-income seniors and seniors needing supports. Additionally,
a lack of housing diversity means there are few options for seniors looking to remain independent but
downsize from a detached single-family dwelling. As the proportion of seniors in the LCR increases,
there will likely be an increased demand for a range of market and non-market seniors housing
options.
Finally, a number of major employers anticipate significant workforce renewal over the next ten years.
While these employers anticipate hiring locally as much as possible, there will nonetheless be a need
to hire from outside the area, particularly for professional employees. While the ownership housing
market offers a number of low-cost options, the age or state of repair of many dwellings may represent
a deterrent for young families who may not have the time, skills or finances to undertake extensive
renovations. Additionally, the lack of diversity in the local housing stock means that inexpensive multi-
family housing (e.g. duplexes and row houses) is less available than in other areas. The lack of new
and diverse housing in the area of study could encourage families to look outside the LCR (e.g. to
Castlegar) for newer, low maintenance housing.
Moving forward, these gaps can be regionally addressed by developing strategies and actions that
recognize the important differences between communities. All communities in the LCR have an
opportunity to encourage attainable market rental and ownership housing by, for example, developing
policy and bylaws that allow secondary suites for rental or encourage denser housing through infill or
small lot zoning designations. In addition the communities with downtown cores (Fruitvale, Rossland
and Trail) can develop plans for increased densification around services, amenities and transit. These
communities also represent appropriate future locations for independent and low-income and possibly
some supportive seniors housing and non-market housing for individuals and families who do not
require additional supports. Finally, as the largest community in the LCR and the service centre for
the region (particularly the presence of the Kootenay Boundary Regional Hospital), Trail represents the
most appropriate location for emergency shelter and supportive housing for people with mental health
and addictions, and facilities for frail seniors. While community-appropriate strategies will form an
iximportant component of the strategic planning phase, a comprehensive regional framework will guide
recommended actions and next steps. These include options such as a region-wide community land
trust, housing reserve fund or regional housing corporation or non-profit that would drive attainable
housing efforts across the LCR.2
2. A land trust, which differs from a conservation land trust, is a non-profit entity that owns real estate in order to make land and housing
available to residents who cannot otherwise access them. a housing reserve fund is a local government mechanism that can be used
to contribute to attainable or affordable housing projects. A housing corporation is established to plan, develop, manage or purchase
housing (Eberle et al., 2006).
x lower columbia region attainable housing needs assessment1. Introduction
1.1 Background and Purpose
The Lower Columbia Region (LCR) is located in the southwestern portion of the Columbia River Basin
in the West Kootenay Region of British Columbia. Approximately 20,000 people live in the study area,
which includes the municipalities of Fruitvale, Montrose, Rossland, Trail, Warfield, and Electoral Areas
A and B of the Regional District of Kootenay Boundary (RDKB).
While the housing market in the region has long been considered inexpensive, over the last decade, the
cost of home ownership has increased significantly. As the real estate markets have increased, pressure
on the rental market has also increased. Other housing pressures exist, such as an aging population,
lack of room for many municipalities to grow, an older housing stock in need of repair and the need to
draw newcomers to the region led to the establishment of an Attainable Housing Committee through
the Lower Columbia Community Development Team Society (LCCDTS).
The purpose of this report is to develop a regional picture of housing, economy and demographics
within the LCR, while at the same time recognizing the differences between communities that compose
the region. These important difference will inform the various approaches local governments take to
housing issues; however, by developing a regional understanding of issues, strategic decisions can be
made about how to prioritize housing actions. The research presented in this report therefore identifies
housing issues and provides the evidence base for strategic actions to build to address these issues.
1.2 Approach
The continuum of housing depicted below provides an organizing framework for understanding
the local attainable housing supply, identifying priorities and considering potential directions for
addressing identified needs. The continuum sets out five different types of housing which are suitable
for households of various ages, types, abilities and incomes.
1This Attainable Housing Needs Assessment has been structured to be consistent with the newly
developed BC Housing and BC Non-Profit Housing Association Housing Need and Demand Study
tool.3 However, due to the integration of a strong market ownership component and key informant
interviews the template has been adapted somewhat to allow the incorporation of this information.
This document provides the following standard information required by BC Housing and BC Non-Profit
Housing Association:
• Community Demographic and Economic Profile
• Housing Profile
• Current Housing Need
• Available Housing Supply
• Emerging Housing Need
• Gap Analysis
this report also provides an analysis of responses provided by key informant interviews. These identify
broader community issues that currently impact the housing market, or may do so in the future.
Finally, Section 7 identifies some directions for communities and the region that will help inform the
Strategic Planning phase of the project (to be conducted in Fall, 2011).
1.3 Methods
The information presented in this report is based on a mixed methodology, consisting of a literature
review of relevant documents, and the collection and analysis of relevant quantitative data and
qualitative data. The research was conducted over a five-month period, with relevant information
collected between April and August of 2011. The Attainable Housing Committee of the LCCDTS
guided the consultant through the research, indicating key issues to explore, helping develop research
tools and connecting the research with key informants from throughout the LCR.
The literature review was the first step, providing background on various housing activities already
completed in the region. The literature review consisted of existing housing research and local
government policy and legislation that relate to attainable housing and included the following
documents or research:
• Local government OCPs, zoning bylaws and other planning tools relevant to
attainable housing
• Research conducted by Selkirk College’s Regional Innovation Chair
• The City of Rossland’s Strategic Sustainability Plan
• The Seniors Housing Needs Assessment, completed for the Abbeyfield Greater Trail
Society
3. BC Housing and BCNPHA. 2010. Housing Need and Demand Study Document Template.
2 lower columbia region attainable housing needs assessmentFollowing the literature review, the consultant conducted a site visit to the LCR on April 18 and 19,
2011. This included a meeting with the Attainable Housing Committee to review key research and the
confirmation of the research timeline for the project.
In April and May the consultant collected a range of quantitative data from a number of sources.
These included:
• Statistics Canada
• BC Stats
• Canadian Mortgage and Housing Corporation
• Kootenay Real Estate Board
• Selkirk College Regional Innovation Chair
• Key stakeholders (e.g. Teck’s employment data)
The qualitative analysis was completed by the end of May, and provides the demographic, economic
and housing trends in the region over the last five to ten years. The data analysis also provided the
basis for key informant interviews.
During June and July the consultant conducted 33 key informant interviews with individuals representing
four different sectors involved in housing issues. These included:
• Local government planners and representatives
• Social service organizations
• Realtors and developers
• Organizations involved in economic development and employment
The qualitative component of this project was designed to provide insight into trends observed in the
quantitative analysis, ensure that older Census data was still relevant in the community and provide
information on issues not covered by the quantitative analysis (e.g. homelessness).
This report represents a synthesis of all relevant information. While Section 2, 3, 4 and 5 are largely
based on the quantitative research, key informant responses are used to supplement the data wherever
appropriate. Section 6 provides additional analysis of key informant responses to a range of questions
on the housing market, local economy, assets and challenges in the region.
31.4 Limitations
This report is designed to be as comprehensive as possible using a mixed methods approach to data
collection. However, there are nonetheless certain limitations that should be considered. The primary
limitation is the age of Census data used throughout much of this report. As this research was
conducted in 2011, the most up-to-date Census data currently available is from 2006.
Census data has been supplemented with other sources to provide information that is as up-to-date
as possible. In many cases, organizations such as the Kootenay Real Estate Board and local employers,
such as Teck, provide this information. The key informant interviews were also designed to supplement
housing market and economic data from the 2006 Census that may be out of date. Despite this, some
key information (such as income data) may be out date, particularly with regard to the recent economic
downturn since 2008.
An additional limitation is the geographical boundaries of the LCR, which consists of five incorporated
municipalities and two Electoral Areas. There is a large volume of data to analyze when considering
these communities as a region. Wherever possible quantitative data has reflected trends in both
individual communities and across the LCR. n some cases, due to the source of data or the way sources
present data, it was not always possible to provide a consistent geographic lens to the communities of
the LCR and the region as a whole.
4 lower columbia region attainable housing needs assessment2. Community Demographic & Economic Profile
2.1 Population and Demographics
This section describes regional and jurisdiction-specific population trends and distribution, age
distribution and projected changes in these areas. This section makes use of Statistics Canada 2006
Census of Canada data and with more recent data from BC Statistics Population section for current
population estimates and projections. The data in this section reflects only permanent residents of
the LCR.
2.1.1 Population Trends and Distribution
Between 2001 and 2006 the region as a whole saw a population decline of 5.1%, with slight growth
only in Area A of the Regional District of Kootenay Boundary (RDKB). Despite this decrease, BC Stats
projects a modest population growth in the Greater Trail Health Area between 2006 and 2021 of
4.6%, from 18,664 individuals to 19,478 (BC Stats, 2011a).
Table 2.1: 2006 Population and Growth by Jurisdiction
Jurisdiction 2006 Population % change since 2001
Area A 1989 0.3%
Area B 1418 -10.4%
Rossland 3278 -10.1%
Trail 7237 -4.5%
Warfield 1729 -0.6%
Fruitvale 1952 -3.6%
Montrose 1012 -5.2%
Region 18615 -5.10%
Source: Statistics Canada, 2006a
Migration trends are available only at the Regional District level throughout British Columbia and
therefore are not of significant value in determining the sources of in and out-migration for the LCR.
However, for the RDKB, the majority of in-migration (73.2%) between 2001-02 and 2009-10 came
from intra-provincial migration (BC Stats, 2011b).
Figure 2.2 shows population projections from 2006 to 2021. BC Stats projects the population for
the Greater Trail Health Area (correspondent to the LCR boundaries) to grow from 18,664 in 2006
(last Census) to 19,478 in 2021. This represents a regional population growth rate of nearly 4.4%
from 2006 population size.
5Figure 2.1: Population Projections to 2021, Greater Trail Health Area4
Source: BC Stats, Population Projections, 2011a
The two largest population centres in the LCR are Trail and Rossland, with Trail accounting for 39%
of the region’s population, and Rossland accounting for 18%. Fruitvale, Montrose and Area A (the
Beaver Valley and environs) account for 26% of the local population, while Warfield and Area B
account for 9% and 8% respectively.
Figure 2.2: Population Distribution, 2006
Source: Statistics Canada
4. The Greater Trail Health Area boundaries match those of the area of study and therefore represents a useful proxy for population
and demographic projections.
6 lower columbia region attainable housing needs assessment2.1.2 Regional Demographics by Gender and Age
Regionally, females outnumber males slightly, and the proportion of men to women is closely
comparable to the province as a whole. From a community by community perspective, Areas A
and B and Montrose have slightly higher proportions of men than women, but are still close to the
province as a whole.
Table 2.2: Proportion of the Population by Gender, Across Jurisdictions,
the Region and the Province
Male Female
Area A 52.3% 47.7%
Area B 50.5% 49.5%
Rossland 49.5% 50.5%
Trail 46.9% 53.1%
Warfield 49.7% 50.3%
Fruitvale 48.8% 51.2%
Montrose 51.7% 48.3%
Region 48.9% 51.1%
BC 49.0% 51.0%
Source: Statistics Canada
A significant feature of the LCR is its relative age compared to the provincial population (see Figure
2.3). According to the BC Stats population projections for 2011, 19.3% of the region is 65 or older,
compared with 15.2% for the province as a whole. Similarly, 33.2% of the population is between
45 and 64, as compared with 29.2% in the province as a whole.
Of concern is the lower proportion of individuals in the 25-to-44 age group, the prime working and
family forming age group. While in the province as a whole this group makes up 27.5% of the
population, in the LCR this group only accounts for 20.5% of the population.
7Figure 2.3: Estimated Share of Population by Age Groups, 20115
Source: BC Stats, 2011a
Table 2.3 shows 2006 age data across the jurisdictions comprising the LCR. All jurisdictions in the
region had a higher proportion of their population in the 45-to-64 age group than the province as
a whole in 2006, which has 28.4% of the population in this group. However, the gap is largest
in Area B, with 41.5% of its population in this age group, as compared to Trail with 30.1% of its
population.
The proportion of the 65+ population varies widely within the LCR. The 65+ population is lowest
in Rossland (11.7%) and highest in Trail (27.1% compared to the Provincial figure of 14.6%. This
significantly affects regional calculations for age groups and shows a concentration of seniors
within the municipal boundaries of Trail. It should also be noted that while the 25-to-44 age group
accounted for 21.1% of the regional population in 2006, this is projected to have declined to 20.5%
by 2011.
5. Population projection data available from BC Stats is not available at a local government level. Therefore all projections are for the
Greater Trail Health Area, which is comparable to the area of study.
8 lower columbia region attainable housing needs assessmentTable 2.3: Share of Population by Age Groups; across Jurisdiction, Region and Province, 2006
0-14 15-24 25-44 45-64 65+ Median Age
Area A 17.4% 13.1% 22.7% 34.8% 11.8% 43.5
Area B 12.7% 12.0% 19.0% 41.5% 14.4% 47.3
Rossland 18.3% 11.7% 25.0% 33.2% 11.7% 41.9
Trail 12.9% 10.4% 19.3% 30.1% 27.1% 49.4
Warfield 17.1% 13.0% 22.3% 32.1% 16.2% 43.9
Fruitvale 18.7% 13.3% 20.5% 32.8% 14.4% 43.5
Montrose 14.4% 14.4% 18.3% 37.1% 15.8% 46.9
Region 15.3% 11.9% 21.1% 32.8% 18.9% n/a
BC 16.5% 13.1% 27.3% 28.4% 14.6% 40.8
Source: Statistics Canada
Table 2.4 provides a comparison to 2001 age groups in jurisdictions across the LCR and in British
Columbia. A comparison of tables 2.2 and 2.3 shows the trend of an aging population in the region,
as a greater proportion of the population is aged 45 and over in 2006 than in 2001. Additionally,
the proportion of the population in younger age groups tends to fall below the proportions for the
province as a whole.
Table 2.4: Share of Population by Age Groups; across Jurisdiction, Region and Province, 2001
0-14 15-24 25-44 45-64 65+ Median Age
Area A 18.9% 14.6% 24.9% 30.2% 10.3% 40.9
Area B 17.4% 12.7% 26.9% 32.3% 11.1% 42.2
Rossland 19.6% 13.4% 29.6% 27.3% 10.3% 38.3
Trail 4.2% 10.9% 22.3% 25.4% 27.2% 46.7
Warfield 19.0% 12.1% 26.7% 27.6% 14.9% 40.5
Fruitvale 22.0% 14.3% 26.4% 24.9% 12.6% 39.1
Montrose 16.8% 14.0% 22.9% 29.4% 15.4% 46.9
Region 17.3% 12.5% 25.1% 27.2% 17.3% n/a
BC 18.1% 13.2% 30.1% 25.1% 13.6% 42.3
Source: Statistics Canada
Looking toward 2021 (Figure 2.4), the LCR will experience significant demographic shifts, with a
significantly larger aging population and growth expected in the 25-to-44 age group. Of concern
is the increase in the proportion of the population 65 or over. This group is expected to grow
from 18.9% in 2006 to a current level of 19.3% to 25.2% of the regional population by 2021.
Additionally, 52.3% of the region will be 45 or over.
9This growth in the older age groups will be somewhat mitigated by a significant growth in the 25-to-
44 age group, from 20.5% in 2011 to 24.1% in 2021. However, the region will also see a decline in
youth and young adults, with only 8.6% of the population in this age group by 2021.
Figure 2.4: Share of Population by Age Groups, Projections to 2021
Source: BC Stats, 2011a
2.2 Income
This section summarizes household income trends using 2006 Census data. All income data is for
the year 2005, as census questions are formulated to gather information about household income in
the year prior to Census data collection. Additional information supplemented Census data where
available.
2.2.1 Average and Median Income Trends
Household incomes represent an important source of data for understanding housing need and
demand, as it is households rather than individuals that purchase or rent housing, though these can
sometimes be single person households.
Table 2.5 shows trends in median (the middle of the income distribution) and average household
income for all jurisdictions in the LCR between 2000 and 2005. Regionally, Trail, Warfield and
Fruitvale fall below the median provincial income by 22.3%, 5.0% and 4.6% respectively. However,
all jurisdictions except Area B saw a positive change in median incomes between 2000 and 2005,
with the most significant increases in Rossland and Montrose.
10 lower columbia region attainable housing needs assessmentTable 2.5: Median And Average Income, for 2000 and 2005
Median Median % Change Average Average % Change
Household Household in Median Household Household in Average
Income Income Income Income Income Income
(for 2005) (for 2000) 2005 2000
Area A $61,286 $57,005 7.5% $69,788 $58,448 19.4%
Area B $53,297 $54,072 -1.4% $62,873 $56,150 12.0%
Rossland $60,088 $51,056 17.7% $71,992 $60,275 19.4%
Trail $43,087 $37,314 15.5% $51,155 $45,358 12.8%
Warfield $50,087 $59,312 15.6% $60,058 $56,668 6.0%
Fruitvale $50,277 $49,902 0.8% $56,832 $51,676 10.0%
Montrose $59,941 $51,014 17.5% $69,961 $57,835 21.0%
BC $52,709 $46,802 12.6% $67,675 $57,593 17.5%
Source: Statistics Canada and Selkirk College, Regional Innovation Chair
These jurisdictional trends are similar when considering average household income. Trail, Fruitvale
and Warfield fell below the average provincial income by 24.4%, 16.0% and 11.3% respectively.
All jurisdictions in the LCR saw a positive increase in average household incomes. While Warfield
saw the smallest increase (6.0%), Montrose, Rossland and Area A saw the most growth in average
income with 21.0%, 19.4% and 19.4% respectively, compared with a provincial growth in average
income of 17.5%.
The incidence of low income6 is an indicator of a need for affordable housing. The Low-Income Cut
Off (LICO) is defined as the amount at which families spend 55% or more of household income of
their income on necessities.
Table 2.6 shows incidence of low income by household and unattached individuals according to
the 2006 Census. While jurisdictions in the LCR fall below the provincial incidence of low income,
low incomes nonetheless remain a problem for private households, particularly in Fruitvale (13.1%),
Trail (12.1%) and Warfield (11.9%). These rates climb to 29.3%, 26.0% and 20.3% for the same
communities when considering unattached individuals 15 and older. While Trail and Rossland have
seen a decrease in low-income households of 4.3% and 1.3% respectively, Warfield saw a 3.6%
increase between 2001 and 2006.
6. Incidence of low-income is the share of the population with an income below a threshold determined by family size and city size as
determined by Statistics Canada. See Table 2.6 for 2006 Low Income Cut Offs.
11Table 2.6: Incidence of Low-Income in Households and Unattached Individuals by Jurisdiction,
2005
Incidence of Population % Change since Unattached % Change since
Low-Income in Private 2001 Individuals, 15+ 2001
2005 Households
Area A n/a n/a n/a n/a
Area B n/a n/a n/a n/a
Rossland 8.0% -4.3% 16.9% -28.8%
Trail 12.1% -1.3% 26.0% -9.0%
Warfield 11.9% 3.6% 20.3% -13.3%
Fruitvale 13.1% 0.1% 29.3% -6.7%
Montrose 2.5% 0.6% 11.8% n/a
BC 17.8% 0.5% 38.1% -1.4%
Source: BC Stats, 2011c
Table 2.7 shows the LICO for rural areas and small urban communities (population under 30,000).
For example a family of four in Trail would need to earn more than $24,871 annually to exceed the
cutoff, while an individual in Trail would need to make $13,154 to exceed it.
Table 2.7: Low Income Cut Offs for 2006
Rural Areas Urban Areas less than 30,000
1 person $11,494.00 $13,154.00
2 person $13,989.00 $16,010.00
3 person $17,420.00 $19,934.00
4 persons $21,731.00 $24,871.00
5 persons $24,746.00 $28,321.00
6 persons $27,444.00 $31,409.00
7 or more persons $30,142.00 $34,496.00
Source: Statistics Canada, 2006b
Table 2.8 shows the primary source of income for households in the LCR (i.e. the proportion of
income dollars from each source). Across the LCR, employment represents the primary source
of income for the majority of residents. In Trail the number of households receiving employment
income (60.2%) is slightly below the province as a whole, while in Rossland, Fruitvale and Montrose
the proportion of households is comparable or above the province as a whole. Trail has a larger
proportion of households with pension as their main source of income (19.1%) in comparison with
other communities in the LCR and the province. This is reflective of regional demographics, with a
12 lower columbia region attainable housing needs assessmenthigh proportion of residents 65 and older in Trail. Finally, self-employment and investment represent
a primary source of income for a smaller proportion of residents in most LCR communities than the
province as a whole. The exception to this is Rossland, which has a slightly higher proportion of
households whose primary income source is self-employment compared to the province as a whole.
Table 2.8: Source of Income for 2008*
Employment Pension Investment Self- Other Tax Exempt
Employed
Rossland 63.8% 10.5% 8.7% 6.0% 4.6% 0.3%
Trail 60.2% 19.1% 4.9% 2.2% 4.3% 0.7%
Fruitvale 68.3% 12.1% 4.5% 1.8% 4.3% 0.7%
Montrose 67.6% 14.0% 5.6% 2.0% 3.7% 0.4%
BC 63.5% 11.9% 11.4% 5.7% 4.5% 1.9%
*Due to CRA boundaries, Warfield data is aggregated with Trail; data not available for
Areas A and B
Source: BC Stats, 2011e
2.3 Economic Profile
Economic activity for the LCR is presented in this section. The primary economic driver in the LCR
is the Teck metallurgical facility located in Trail, which employs approximately 1500 local residents.
As a result, smaller metallurgical companies, such as Firebird Semiconductors Ltd. benefit from
the presence of the facility. Another major employer is Interior Health, as the Kootenay Boundary
Regional Hospital is located in Trail, drawing health care professionals to the region. The area is also
a well-known recreational area, with the presence of a ski hill (Red Mountain Resort), numerous
hiking and biking trails and three golf courses; tourism and recreation also represent important
sources of regional revenue and employment.7 Information in this section is from the 2006 Census
and key informant interviews.
2.3.1 Industry
A regional economy can be partly understood by examining the economic activity that predominates.
Table 2.9 shows the number of workers in the labour force employed in specific industries, and the
proportion of the labour force they represent for 2006. Statistics are shown for both the LCR and BC
for comparison purposes. Manufacturing is a dominant source of employment, with 16.1% of the
regional labour force working in some form of manufacturing. This is nearly double the provincial
rate. This underscores the role of Teck and other metallurgical industries in the area. Additionally,
7. Source: Key informant interviews, June-July, 2011
13health care is well above the provincial average, with 13.4% of the labour force working in this
industry, compared with a provincial rate of 9.7%. Retail also represents an important source of
employment (14.7%), with a proportion of the labour force that is slightly higher than in the rest
of BC. Together these three industries account for 44.2% of the labour force in the LCR. Business
services are less predominant in the LCR than across BC, with 12.2% of the workforce providing
these services compared to a provincial rate of 19.9%.
Table 2.9: Labour Force by Industry, 2006
LCR British Columbia
Industry Number Percent Number Percent
Agriculture/Resource Based 480 5.1% 107,760 4.9%
Construction 690 7.3% 166,100 7.6%
Manufacturing 1520 16.1% 189,120 8.6%
Wholesale Trade 185 2.0% 92,020 4.2%
Retail 1385 14.7% 248,950 11.4%
Finance/Real Estate 385 4.1% 134,940 6.2%
Health Care 1265 13.4% 213,085 9.7%
Educational Services 555 5.9% 152,565 7.0%
Business Services 1150 12.2% 436,665 19.9%
Other services 1860 19.7% 451,905 20.6%
Total labour force over 15 9440 2,193,115
Source: Statistics Canada, 2006a
2.3.2 Employment and Labour Force
The type of occupation residents of the area have is another important facet of the local economy
and provides direct insight into income levels, and therefore housing affordability. Table 2.10 shows
the concentration of labour force by occupation for 2006. Sales and service occupations represent
the primary occupation with 23.7% of the labour working in this field, slightly below the provincial
rate of 25.3%. These occupations tend to offer lower wages and part-time employment. Trades,
transport and equipment operations represent another important category of occupation with
20.2% of the labour force; these jobs offer opportunities for higher wages. LCR residents are also
slightly more likely to work in a health occupation (7.7%) compared to the provincial rate (5.5%).
However, business, finance and administration represents a smaller proportion of the workforce than
seen across BC.
14 lower columbia region attainable housing needs assessmentTable 2.10: Labour Force by Occupation, 2006
LCR Number Percentage BC Number Percentage
Management occupation 850 9.0% 229,945 10.5%
Business, finance and 1270 13.4% 375,975 17.1%
administration occupations
Natural and applied 480 5.1% 138,955 6.3%
sciences and related
occupations
Health occupations 725 7.7% 120,360 5.5%
Occupations in social 690 7.3% 178,040 8.1%
science, education,
government service and
religion
Occupations in art, culture, 240 2.5% 76,460 3.5%
recreation and sport
Sales and service 2240 23.7% 555,880 25.3%
occupations
Trades, transport and 1910 20.2% 339,500 15.5%
equipment operations and
related occupations
Occupations unique to 300 3.2% 86,460 3.9%
primary industry
Occupations unique to 695 7.4% 91,545 4.2%
processing, manufacturing
and utilities
Total 9445 2,193,115
Source: Statistics Canada
152.4 Households
2.4.1 Household Type
According to the 2006 Census there were 8,220 households in the LCR, and BC Statistics estimates
that by 2011 there are 8708 households in the region.
Table 2.11 shows household information for different types of households by jurisdiction and within
the LCR. The largest proportion of households in the region was the household type consisting of
couples without children (32.8%), followed by one-person households (32.0%). This is consistent
with the age profile of the region described above, as it indicates an older population of couples
whose children may have left or single seniors, respectively. Regionally, there is also a lower
proportion of households consisting of couples with children (23.8%) and other households (11.4%)
than the provincial average (26.3% and 16.1% respectively).
Table 2.11: Households by Household Type, 2006
Total Private Couples with Couples One-person Other
Households Children without households households
Children (multi-family,
lone-parent
and non-
family
other than
one-person
households)
Area A 780 30.1% 39.7% 19.9% 9.6%
Area B 625 22.4% 36.8% 24.8% 16.0%
Rossland 1355 30.6% 31.0% 27.7% 10.3%
Trail 3515 17.5% 30.3% 41.0% 11.5%
Warfield 745 24.2% 32.2% 30.9% 12.1%
Fruitvale 795 29.6% 34.0% 23.3% 13.2%
Montrose 405 33.3% 39.5% 22.2% 6.2%
Region 8,220 23.8% 32.8% 32.0% 11.4%
British 1,643,150 26.3% 29.6% 28.0% 16.1%
Columbia
Source: Statistics Canada
The proportion of one-person households in Trail (41.0%) is significantly higher than the provincial
rate (28.0%), while the proportion of couples with children is significantly lower (17.5% in Trail,
26.3% provincially). This is also consistent with the age profile described above. Area A and
16 lower columbia region attainable housing needs assessmentMontrose have a significant proportion of households that consist of couples without children
(39.7% and 39.5% respectively). For households that consist of couples with children, Montrose
(33.3%), Rossland (30.6%), Area A (30.1%) and Fruitvale (29.6%) are all higher than the provincial
rate. Across the region all jurisdictions have a lower proportion of other types of households, with
the exception of Area B (16.0%) that is comparable with the provincial rate (16.1%).
2.4.2. Household Projections
BC Stats estimates a moderate growth in the number of households between 2011 and 2021, from
8,708 to 9004. This represents a growth rate of 3.6% during this time period and corresponds
with the moderate increase in population described above. By 2021 there will be nearly 300 new
households within the region. Table 2.12 shows the projected household growth rate for the Greater
Trail Health Area between 2011 and 2021.
Table 2.12: Projected Change in Number of Households in the Greater Trail
Health Area 2011-2021
# of Households % change year to # of new households
by 2021 (Trail Local year
Health Region)
2011 8708 0.2%
2012 8731 0.3% 23
2013 8756 0.3% 25
2014 8786 0.3% 30
2015 8820 0.4% 34
2016 8858 0.4% 38
2017 8894 0.4% 36
2018 8908 0.2% 14
2019 8945 0.4% 37
2020 8990 0.5% 45
2021 9004 0.2% 14
Total 3.6% 296
Source: BC Stats, 2011a
This section examines the current supply of housing in the area, including housing diversity, type of
tenure, age and state of repair, rental statistics and social housing.
173. Housing Profile
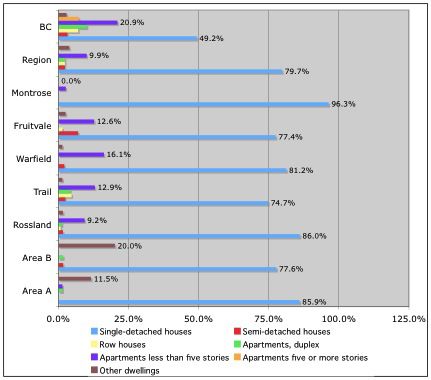
3.1 Dwellings by Type
Table 3.1 shows the dwellings by type in each jurisdiction of the LCR. Single-detached houses are
the predominant housing for across the area, representing nearly 80% of all housing stock and
providing at least three quarters of the housing stock in each jurisdiction. This represents significantly
less diversity than provincial rates; however, urban areas such as Metro Vancouver and Victoria
influence BC’s dwelling type statistics. The next most predominant form of housing in the LCR are
small apartments, representing approximately 10% of housing stock, followed by other dwellings
(including mobile homes) which represent 3.8% of dwellings.
Trail has the lowest proportion of single-detached houses with 74.7% of all dwellings in this group.
Additionally, 12.9% of Trail’s dwellings are small apartment buildings (less than five stories), while
row houses, duplex apartments and semi-detached houses account for 4.6%, 4.1% and 2.3% of all
dwellings respectively.
Table 3.1: Dwelling by Type and Jurisdiction, 2006
Single- Semi- Row Apartments, Apartments Apartments Other
detached detached houses duplex less than five five or more dwellings
houses houses stories stories
Area A 85.9% 0.0% 0.0% 1.3% 1.3% 0.0% 11.5%
Area B 77.6% 1.6% 0.0% 1.6% 0.0% 0.0% 20.0%
Rossland 86.0% 1.5% 0.7% 1.1% 9.2% 0.0% 1.5%
Trail 74.7% 2.3% 4.6% 4.1% 12.9% 0.0% 1.3%
Warfield 81.2% 2.0% 0.0% 0.0% 16.1% 0.0% 1.3%
Fruitvale 77.4% 6.9% 1.3% 0.0% 12.6% 0.0% 2.5%
Montrose 96.3% 0.0% 0.0% 0.0% 2.5% 0.0% 0.0%
Region 79.7% 2.2% 2.2% 2.2% 9.9% 0.0% 3.8%
BC 49.2% 3.1% 6.9% 10.0% 20.9% 7.1% 2.8%
Source: Statistics Canada
There is a significant proportion of small apartment buildings in Warfield (16.1%, the highest in the
region), Fruitvale (12.6%) and Rossland (9.2%). Another dominant housing form in Areas A and
B of the RDKB is the ‘other dwelling’ category, consisting primarily of mobile homes. 20.0% of
Area B’s dwelling types are comprised of this category, while in Area A it represents 11.5% of the
dwelling types. This category is of particular importance, as rising real estate costs can put significant
pressures on sites designed for mobile homes. Figure 3.1 illustrates the diversity of dwellings in the
area by type and jurisdiction.
18 lower columbia region attainable housing needs assessmentFigure 3.1: Dwelling by Type and Jurisdiction, 2006
Source: Statistics Canada
3.1.1 New Residential Construction Since 2002
In addition to existing housing stock, the LCR saw a significant increase in the number of housing
units constructed between 2003 and 2010. Table 3.2 shows the total number of units for which
building permits were issued between 2002 and 2005. Residential building permits for a total of
536 units issued between 2002 and 2010. The largest proportion of these permits (46.3%) was for
single dwelling units (detached single family homes). 219 units of housing were constructed in some
form of multi-family housing (comprising row houses/duplexes and apartments), consisting of 40.9%
of the total residential units constructed in the area. The remaining permits were for mobile or other
forms of dwellings.
Table 3.2 also shows a significant increase in the number of units for which building permits were
issued between 2002 to the 2006-08 period. This is followed by a significant drop in the number
19units for which building permits were issued, back to levels seen in the earlier part of the decade.
This peak and subsequent downturn in building permits reflects the broader North American housing
market, which saw a high in 2008 followed by a downturn. It also corresponds with key informant
comments, which indicated that the 2006-08 period was a time of significant construction and
housing market turnover, in which housing prices increased significantly across the region. The
increase in construction corresponds with a significant increase in average dwelling value shown by
Statistics Canada between 2001 and 2006 (for more discussion see section 3.6).
As of 2006 Census, Statistics Canada had counted 8,220 households in the LCR. This represents
8,220 units of single-family or multi-family housing. Building permits were issued for 256 units of
housing between 2007 and 2010. Assuming all units were completed and are currently occupied
year-round, this represents a 3.1% increase in the number of households since 2006.
Table 3.2: Total Number of Units of Residential Construction by Year and Type,
Between 2002 and 2010
Single Dwelling Multiple Family (Row Residential Building
Units Houses, Duplexes Permits (Total
and Apartments by Number of Units)
Number of Units)
2002 7 11 20
2003 20 8 28
2004 14 40 56
2005 28 31 60
2006 37 79 116
2007 49 25 80
2008 52 22 127
2009 20 3 26
2010 21 0 23
Total 248 219 536
Source: BC Stats, 2011d
Table 3.3 shows the total number of units of residential construction for which building permits were
issued since 2002 by jurisdiction in the LCR. The majority of units for which building permits were
issued (55.2%) in the LCR were concentrated in Rossland. A significant number of single dwelling
units were also issued building permits in Trail (33.9% of single dwelling permits issued in this time
period), though very little multi-family housing. Beaver Valley communities (Montrose/Fruitvale) saw
permits issued 21.5% of all units in the LCR. Fruitvale alone saw the construction of denser forms
of housing, with building permits issued for 53 units of multi-family housing types (most, if not all of
these would have been for development of a seniors facility) and 41 single dwelling units. Warfield
20 lower columbia region attainable housing needs assessmentsaw only moderate construction in this time period, with permits issued for the construction of 23
single dwelling units.
Table 3.3: Total Number of Units of Residential Construction by Community and Type,
Between 2002 and 2010
2002-2010 Single Dwelling Multiple Family (Row Residential Building
Units Houses, Duplexes Permits (Total
and Apartments by Number of Units)
Number of Units)
Fruitvale 41 53 97
Montrose 12 4 18
Rossland 76 217 296
Trail 78 2 102
Warfield 23 0 23
Total 230 276 536
Source: BC Stats
3.1.2 Secondary Suites
Secondary suites are a type of ground-oriented housing that is generally affordable and suitable for
families. The following summarizes community-specific secondary suite legislation for jurisdictions in
the LCR:
• Trail: R2 zoning allows for two family dwellings on a lot, which can be interpreted as
duplex or secondary suites in a single family home.
• Rossland: Allows detached suites (coach houses) up to 7m in height (e.g. second story on a
garage).
• Fruitvale: Currently has no secondary suite legislation; however, they are not disallowed.
The municipality collects additional utilities fees for dwellings with a secondary suite.
• Montrose: Currently has no secondary suite legislation, but allows detached garden suites
for relatives of owners (in-law suite)
• Warfield: No existing legislation on secondary suites.
• Area A: Policy statement supporting secondary suites in the revised OCP, which was
adopted in February 2011.
21• Area B: Currently undergoing OCP review; draft revised OCP includes policy direction to
allow secondary suites in some land use designations.
Because legislation is varied across the region, and in many cases secondary suites/garden suites are
minimally or unregulated, it is difficult to track numbers. This is a common problem through the
province. A survey of newspaper listings for May and June of 2011 did find several secondary suites
for rent.
The Tenants Resource and Advisory Centre (1995) estimates that approximately 20% of BC’s rental
housing is provided by legal and illegal secondary suites. Using this figure as a guide creates a
guesstimate of approximately 322 secondary suites, representing 20% of the rental market in the
region.
3.1.3 Seasonal Use
Seasonal use as of 2008 accounted for 2,750 property titles that are used in some form seasonally.
1,641 of these were categorized as recreational/cultural, while 797 were seasonal dwellings.
Additionally, 13 were classified as ski resort ownership and 295 were hotel/resort property titles.
3.2 Dwellings by Tenure
In the LCR, the majority of dwellings are owned (80.4%), a higher proportion than in the province
as a whole. According to the 2006 Census there are 1610 rented units, comprising 19.6% of the
housing stock in the region. It is likely that the number of rental units in the region has declined, and
key informants raised concerns with rising real estate prices and an increase in home sales around
2006, that a number of previously rented dwellings were no longer available as rental units. Key
informants also noted that this was likely to be most true of Rossland and Trail, though an issue
across the region.
22 lower columbia region attainable housing needs assessmentTable 3.4: Dwellings by Tenure, 2006
Owned Dwellings Rented dwellings
Area A 88.5% 11.5%
Area B 93.6% 6.4%
Rossland 86.2% 13.8%
Trail 72.0% 28.0%
Warfield 83.3% 16.7%
Fruitvale 78.6% 12.4%
Montrose 96.3% 3.7%
Region 80.4% 19.6%
BC 69.9% 30.1%
Source: Statistics Canada
While rental units are present across the region, they are most concentrated in several areas. Trail
and Fruitvale have the highest proportion of rented dwellings (28.0% and 21.4% respectively).
Warfield, Rossland and Area A also have a significant proportion of rented dwellings (16.7%, 13.8%
and 11.5% respectively). Area B and Montrose have low proportions of rented dwellings (6.4% and
3.7% respectively).
3.3 Age and Condition
According to the 2006 Census, housing stock in the LCR as a whole is composed of older housing.
Nearly two-thirds (65.7%) of the housing stock across the region was built prior to 1971, while over
90% was built prior to 1986. This is significantly older than the housing stock across BC, of which
only 31.3% was built prior to 1971 and 62.0% was built prior to 1986.
Table 3.5: Age of Dwellings as of 2006
Before 1920 1946 to 1970 1971 to 1985 1986 to 2000 2001 to 2006
to 1945
Area A 10.3% 26.9% 41.0% 18.6% 2.6%
Area B 12.8% 33.6% 33.6% 20.0% 0.0%
Rossland 35.1% 27.3% 27.7% 7.4% 3.0%
Trail 36.7% 45.5% 12.9% 3.6% 1.1%
Warfield 25.3% 42.7% 24.7% 4.7% 1.3%
Fruitvale 8.2% 35.2% 44.0% 11.3% 1.3%
Montrose 2.5% 56.8% 32.1% 9.9% 2.5%
Region 26.6% 39.1% 24.6% 8.0% 1.6%
BC 7.9% 23.4% 30.7% 29.8% 8.3%
Source: Statistics Canada
23The age of housing stock is most pronounced in Trail, with 82.2% of Trail’s housing stock dating
from before 1971, and 95.1% built prior to 1986. Conversely, 21.2% of Area A’s housing stock,
20.0% of Area B’s housing stock have been built since 1986.
Figure 3.2: Age of Dwellings as of 2006, LCR and BC
Source: Statistics Canada
The condition of the housing stock fits the age profile of housing stock discussed above. In the LCR
44.8% of housing is in need of some repairs, while 10.7% of housing is in need of major repairs.
In comparison, less than a third (32.3%) of provincial housing stock requires some repairs, and only
7.4% of the housing in BC is in need of major repair.
Table 3.6: Condition of Housing Stock by Jurisdiction, 2006
Regular Maintenance Required Minor Repairs Major Repairs
Area A 57.4% 34.2% 8.4%
Area B 49.6% 40.8% 9.6%
Rossland 48.7% 37.6% 13.7%
Trail 57.6% 31.9% 10.5%
Warfield 62.2% 29.7% 8.1%
Fruitvale 56.0% 33.3% 10.7%
Montrose 50.3% 37.3% 12.4%
Region 55.2% 34.1% 10.7%
BC 67.7% 24.9% 7.4%
Source: Statistics Canada
24 lower columbia region attainable housing needs assessment4. Current Attainable Housing Need & Available Supply
4.1 Homelessness
Homelessness is an indicator of extreme poverty, lack of housing and often other issues such as
mental health, addiction or family breakdown. Homelessness and risk of homelessness are real and
persistent issues in the LCR. While it is difficult to enumerate homelessness, particularly in rural areas
where homelessness often takes a different form than urban centres, the qualitative data provided
through key informant interviews provides some insight into the extent of this issue in the LCR.
An Extreme Weather Emergency Shelter operated between February and March of 2011. They were
open a total 38 nights during that time period with a minimum of 1 bed occupied every night. Some
nights up to 2 or 3 clients were present. However, the EWES model does not provide 24-hour or
regular access for homeless individuals, and therefore is not an accurate representation of those in
need. The only other regional shelter service available to homeless individuals is located in Nelson,
which poses significant transportation barriers and should an individual seek housing through the
Nelson shelter, they will be removed from accessing their services and supports in Trail.
While the street homeless population may not be more than a handful of individuals in Trail, there is
evidence that there are a number of individuals at-risk of homelessness—individuals who are couch-
surfing, living in unsafe or abusive situations, transient and moving from apartment to apartment,
or living in housing that does not meet basic health and safety standards. A survey conducted by a
coalition of service organizations working with those in poverty had approximately 100 responses,
most of which were from individuals at risk of homelessness. Additionally, with increased pressure
on the rental market within Trail, the options for these individuals are declining, even while IA
and disability rates8 fail to meet the growing cost of a one-bedroom apartment. This can lead to
unhealthy living conditions for those renting older units in need of repair or unsafe shared living
situations.
There are several historical and current reasons that homelessness and risk of homelessness are
persistent and visible issues for Trail. The decentralization of mental health services previously offered
in the Lower Mainland has meant that many individuals with mental health issues have returned
to their hometowns to find housing and services. Additionally, some key informants noted that
the low cost of housing historically may have attracted people on disability or IA to the region;
however, many key informants also stressed the importance of recognizing that mental health issues
are present in all communities, and it is important not to blame newcomers for the existence of
visible homelessness and poverty. An additional factor that may contribute to a high prevalence of
homeless and at-risk individuals is the presence of the Kootenay Boundary Regional Hospital in Trail.
Because the hospital has a ward for people with mental illness, individuals who are patients at the
ward may stay in Trail to remain close to services and supports present in the community. There are
currently 23 units available to people with mental health issues in the region. However, 9 of these
units are designated tertiary care and do not represent permanent housing.
8. The shelter component of IA and disability payments is $375 per month, which falls well below rental rates for a one-bedroom
apartment in the region.
25You can also read