Luxembourg OECD Economic Surveys - July 2019
←
→
Page content transcription
If your browser does not render page correctly, please read the page content below

OECD Economic Surveys

    Luxembourg
    July 2019
    OVERVIEW

www.oecd.org/economy/luxembourg‐economic‐snapshot/
This Overview is extracted from the Economic Survey of Luxembourg. The Survey is published on
the responsibility of the Economic and Development Review Committee (EDRC) of the OECD, which
is charged with the examination of the economic situation of member countries.

This document and any map included herein are without prejudice to the status of or sovereignty
over any territory, to the delimitation of international frontiers and boundaries and to the name of
any territory, city or area.

OECD Economic Surveys: Luxembourg© OECD 2019

You can copy, download or print OECD content for your own use, and you can include excerpts from
OECD publications, databases and multimedia products in your own documents, presentations,
blogs, websites and teaching materials, provided that suitable acknowledgment of OECD as source
and copyright owner is given. All requests for public or commercial use and translation rights should
be submitted to rights@oecd.org. Requests for permission to photocopy portions of this material
for public or commercial use shall be addressed directly to the Copyright Clearance Center (CCC) at
info@copyright.com or the Centre français d’exploitation du droit de copie (CFC) at
contact@cfcopies.com.
EXECUTIVE SUMMARY 3
Executive Summary
Growth has been robust and well-being is high
Reducing households’ and banks’ financial risks should be a priority
Fiscal policy should support sustainable growth
Future prosperity will require stronger productivity growth
The housing market needs to become more efficient and equitable
4 EXECUTIVE SUMMARY
Growth has been robust and well-being is high Reducing households’ and banks’ financial
risks should be a priority
The economy has continued to expand rapidly Rising household indebtedness creates
(Figure A). GDP grew by 2.6% in 2018, mainly vulnerabilities for some families and some
underpinned by private consumption. Over most banks. Mortgage debt has continuously
of the past decade, GDP growth in Luxembourg increased in line with rising house prices (Figure
has strongly outpaced the euro area average. B), creating a high debt service burden for a
Coupled with other strengths, such as relatively larger share of households than in most other
low gender inequality and a healthy work-life countries. Though the regulator has imposed
balance, high income levels are a mainstay of higher capital buffers, domestic banks have large
Luxembourg’s well-being. exposures to the residential real estate market,
Figure A. Post-crisis economic performance which is a source of risk. Introducing borrower-
has been strong based macroprudential instruments, such as caps
GDP, y-o-y % changes
12 to loan-to-value or debt service-to-income ratios,
10 as envisaged in draft legislation, would help
8
6
avoid the further build-up of vulnerabilities.
4 Figure B. Real house prices are growing strongly
2 Index 2007 = 100, s.a.
0 160
-2 Luxembourg Belgium
-4 150 France Germany
Luxembourg
-6 140 Sweden
Euro area
-8
-10 130
2007 2009 2011 2013 2015 2017 2019
120
Source: OECD Economic Outlook: Statistics and
Projections (database), June. 110
StatLink 2 http://dx.doi.org/10.1787/888933950981 100
However, slower growth is projected (Table 90
2007 2009 2011 2013 2015 2017
A), and there are downside risks. In case of a
Source: OECD, Analytical house prices indicators
slowdown, the authorities should allow database.
automatic stabilisers to operate. A fiscal stimulus StatLink 2 https://doi.org/10.1787/888933951000
could be envisaged in case of a severe downturn,
which might result from rising trade tensions and Reinforced supervision and regulation can
financial volatility. Building on recent measures, further enhance financial sector resilience and
one option to stimulate the economy could be foster the transition to a low-carbon economy.
to further reduce taxes on low wages, which The large investment fund industry is sensitive to
would have the side-benefit of making the labour external risks, and sizeable intra-group exposures
market more inclusive by favouring job insertion of international banks likewise call for close
of low-skilled workers. monitoring. The financial sector is globally
exposed to climate-related risks, inter alia
Table A. The expansion is projected to continue
through holdings of high-carbon assets which are
(Annual growth rates, unless specified) 2018 2019 2020
likely to lose value when policies are
Gross domestic product (GDP) 2.6 2.0 2.5
implemented to meet international climate
Private consumption 4.2 2.8 3.6
change mitigation targets. Building on
Government consumption 4.0 4.2 3.2
Gross fixed capital formation -2.8 5.5 4.5
Luxembourg’s leading role in green bonds,
Exports of goods and services 4.6 3.8 4.1 strengthening climate-related disclosure
Imports of goods and services 5.1 4.4 4.8 requirements for financial intermediaries will
Unemployment rate (% of labour force) 5.5 5.2 5.1 increase transparency and thus the allocative
Consumer price index 2.0 2.1 2.1 efficiency of financial markets.
Source: OECD Economic Outlook.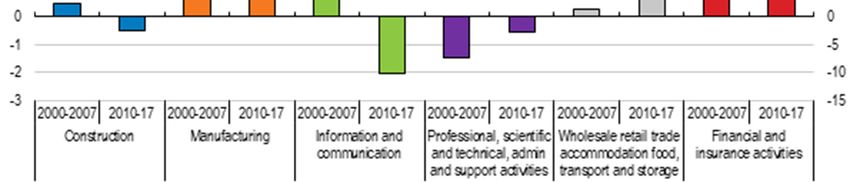
EXECUTIVE SUMMARY 5
high, but its growth has been subpar for two
Fiscal policy should support sustainable growth decades (Figure D). Weak growth can largely be
traced to services, where often the most productive
The fiscal position is very strong, but ageing firms have failed to pull ahead and weaker firms
creates a long-term fiscal challenge. The 2018 have fallen further behind. Within services, the
budget surplus exceeded 2% of GDP, and gross financial sector has remained the main area of
public debt is low and far outweighed activity, despite declining productivity growth.
by financial assets. However, under unchanged Policy initiatives to diversify the economy need to
policies, ageing-related costs are projected to rise be further pursued, with systematic monitoring
substantially, posing a long-run fiscal and evaluation.
sustainability challenge. Taking steps to increase
Figure D. Productivity growth has been sluggish
the retirement age with life expectancy and/or GDP per hour worked, USD 2010 PPPs,
reduce the generosity of pensions would help average annual % change
address this challenge. Options outlined in 2.0
2000-2007 2010-2017
the 2012 pension reform should be discussed in
this context. 1.5
The composition of revenues should be also 1.0
revised to support more sustainable growth
(Figure C). Increasing environmental taxes, such 0.5
as those on transport fuel or on motor vehicles,
would reduce CO2 emissions and pollution. More 0.0
BEL DEU FRA LUX OECD
reliance on recurrent real estate taxes would also
Source: OECD Productivity Indicators Database.
be desirable. This would allow less reliance on StatLink 2 https://doi.org/10.1787/888933951038
base-narrowing tax arrangements that in the past
attracted multinationals to Luxembourg and thus Firms that are not top-performers, but viable,
helped increase corporate tax revenues. Those need to catch up. Firms often face skill
provisions are being gradually phased out as part shortages, inter alia in digital technologies,
of Luxembourg’s engagement in international which weighs on productivity outcomes. Market
efforts towards tax transparency, which should congestion by inefficient firms compounds the
continue. problem. Training offers should be stepped up
Figure C. Environmental and recurrent real estate and need to be better informed by regular skill
taxes are low foresight exercises. Restrictive regulations in
% of GDP professional services hamper productivity in that
5.0
sector but also in downstream production. A
LUX OECD
4.0 more efficient insolvency regime would foster
entrepreneurship and help struggling firms to
3.0
either restructure or exit.
2.0
Top-performing firms could still become more
1.0 innovative. This can take place through more
0.0
widespread adoption of cutting-edge
Environmental Recurrent real Corporate taxes technologies, such as artificial intelligence or
taxes estate taxes
blockchain applications, where public sector use
Source: OECD Global Revenue Statistics and OECD Green can have a valuable demonstration effect. R&D
Growth Indicators.
StatLink 2 https://doi.org/10.1787/888933951019
investment is low by international standards, and
the share financed by firms has been declining.
Future prosperity will require stronger Income-based R&D tax incentives have been
productivity growth recently made more targeted, but remain likely to
benefit large firms disproportionately.
Productivity growth has disappointed, Introducing expenditure-based tax incentives
especially in services. The level of productivity is could thus be considered.
6 EXECUTIVE SUMMARY
The housing market needs to become more taxes hardly provide any incentives for socially
efficient and equitable efficient land use and territorial development. For
instance, unused constructible land is seldom
Housing supply has not kept pace with growing taxed, thus encouraging land hoarding. Rising
demand. Strong demographic growth, coupled house prices are also due to the favourable income
with a trend towards smaller households, have tax treatment of owner-occupied housing, inter
fuelled housing demand, while structural alia through mortgage interest deductibility,
constraints have hampered supply (Figure E). which tends to be regressive.
Limited use of land available for construction and Equitable access to housing is also made
cumbersome zoning restrictions have made land difficult by a small social rental sector. The
prices soar. In turn, this has worsened land stock of social rental housing is very low (Figure
hoarding, left unchecked by the low opportunity F), partly reflecting the past practice of re-sale of
cost of vacant constructible land, but also by weak subsidised housing on the unregulated market.
incentives of municipalities to enforce an Social rental agencies can alleviate this shortage
obligation to build on private landowners. by acting as intermediaries between landlords and
Complex construction norms set by municipalities vulnerable tenants, providing rent payment
have made building costs rise further. guarantees and maintenance services to the
Figure E. Population growth has outpaced owners and supporting tenants in their future
new construction transition to unsubsidised housing. Financial
Percentage change, 2015
2.5 support for these agencies should be stepped up
Population Dwellings
2.0
and municipalities could provide up-to-date
information on unoccupied dwellings.
1.5
Social housing allocation can be improved.
1.0 Social rental housing should be targeted at those
0.5
households most in need, to provide them with an
affordable dwelling and prevent socio-economic
0.0
FRA DEU CHE LUX segregation. However, the admission criteria for
Note: Population data for Germany refers to 2016. social housing are often flexible and with low
Source: OECD (2018), International Migration Outlook; and transparency. Moreover, partly due to unlimited
OECD Affordable Housing Database. tenure contracts, many tenants come from the two
StatLink 2 http://dx.doi.org/10.1787/888933951057
top income quintiles. Recurrent means-testing
High urban sprawl weighs on housing should be combined with tailored plans for re-
affordability and on the environment. Single- entering the private rental sector, similar to those
family houses still account for half of the housing used by social rental agencies. Rents in the social
stock, which contributes to high urban sprawl in housing sector should also increase more steeply
international comparison. This private preference with tenant income.
for low-density housing entails major social costs Figure F. Social rental housing is scarce
in terms of pollution, traffic congestion (not least Number of social rental dwellings as a share of the total
due to massive cross-border commuting) and more number of dwellings, 2015 or latest year
expensive public infrastructure. Enhanced
incentives for densification are hence called for.
As with other supply constraints, better
coordination between central and local
government, as well as across different
municipalities, is key.
Tax provisions hamper housing supply, fuel
mortgage indebtedness and harm equity.
Note: Data refer to 2011 Luxemburg; 2012 for Germany;
Recurrent real estate taxes are very low, partly 2014 for France.
because they are based on outdated cadastral Source: OECD Affordable Housing Database.
valuations. Besides raising little revenue, these StatLink 2 http://dx.doi.org/10.1787/888933951076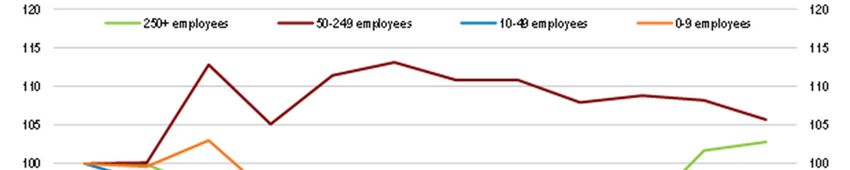
EXECUTIVE SUMMARY 7
MAIN FINDINGS KEY RECOMMENDATIONS
Reducing households’ and banks’ financial risks
Rising house prices and household indebtedness create Introduce borrower-based macroprudential instruments, such as
vulnerabilities for some families and for some banks. caps to loan-to-value or debt-service-to-income ratios, as foreseen
in draft legislation.
As elsewhere, the financial sector faces risks from exposures to Strengthen disclosure of climate-related risks by financial
high-carbon assets which could lose value in the context of policies intermediaries, in line with the recommendations by the Task Force
to meet internationally agreed climate change mitigation targets. on Climate-related Financial Disclosures.
The financial sector is exposed to risks arising in international Further reinforce financial supervision, namely by continuing to
markets. monitor credit risks on intra-group bank exposures and to enhance
on-site inspections and data collection on investment funds.
Using fiscal policy to make growth sustainable and inclusive
As in the euro area, there are signs of a slowdown in activity and Allow automatic stabilisers to work in case of a downturn and, if it
the most vulnerable workers would be the first affected. intensifies, implement a countercyclical fiscal expansion.
In a no-policy-change scenario, ageing-related costs are projected Increase the retirement age with life expectancy and/or reduce the
to rise substantially over the long run. generosity of pensions.
Recurrent taxes on immovable property are very low. Turn recurrent taxes on immovable property into a more important
fiscal resource, e.g. by regularly aligning the tax base with the
market price of the property.
Past tax arrangements for large corporations have contributed to Continue to engage in international efforts to address tax challenges
raise significant tax revenues, but are no longer a sustainable of cross-border activities and to strengthen tax transparency.
attractiveness factor.
Luxembourg has low environmental taxation. Fuel tourism is high. Continue to raise taxes and excise duties on transport fuel,
especially on diesel, and develop flanking measures over the short
term for most affected poor households.
Reviving productivity growth
Productivity growth has long been slow, partly due to skill Undertake regular skill foresight exercises and ensure their
shortages. outcomes feed into enhanced training offers.
In services, the less productive firms have tended to fall further Modernise bankruptcy law to ease early restructuring and second-
behind, which weighs on aggregate productivity. chance opportunities, as well as the exit of non-viable firms.
Regulations for some professional services remain restrictive in In those professional services, eliminate restrictions on advertising
international comparison. and marketing.
Even top firms often fail to innovate. Promote the adoption of cutting-edge technologies, inter alia through
the demonstration effect of public sector use.
Addressing pressures and improving inclusiveness in the housing market
Limited use of land available for construction and cumbersome Increase the opportunity cost of unused land by reforming recurrent
zoning restrictions have fuelled land prices and encouraged land taxes on immovable property. One option is to increase land value
hoarding. taxes on land zoned for construction.
Make part of government financing of municipalities conditional on
municipalities penalising landowners and developers for non-use of
building permits.
The personal income tax treatment of owner-occupied housing Phase out or at least reduce mortgage interest deductibility.
favours home ownership, encouraging indebtedness and house
price rises.
High urban sprawl increases pollution, traffic congestion and the Increase residential density, in particular around transport network
cost of public infrastructure. hubs, namely by building higher buildings.
The social rental housing stock is small and often allocated to high- To increase the stock of social rental housing while preserving social
income tenants. The 2019 budget includes a new budget line to mixity, directly finance new land acquisition by public providers of
acquire land for housing purposes, currently endowed with an social housing.
amount of EUR 100, which can be increased according to Use recurrent means testing to better target the provision of social
budgetary procedures. housing.
Housing allowances and rents in the social housing sector are not Link housing allowances and rents in the social housing sector to
spatially differentiated, despite highly heterogeneous housing and reference rents at the local level.
rental market prices across municipalities.
KEY POLICY INSIGHTS 9
Key Policy Insights
Luxembourg is one of the most prosperous economies in the OECD. Thanks to overall
sound policies and institutions, the financial sector remains competitive and has made
inroads into new areas, such as fintech and green finance. Dynamic job creation has reduced
unemployment and enabled Luxembourg to integrate numerous immigrants, who have
become an essential pillar of the labour force while embracing the opportunity of a better
life. A very large number of residents in neighbouring countries have also found work in
Luxembourg, illustrating the high interconnectedness of the economy. The strong fiscal
position is well illustrated by a long-standing AAA rating and the large accumulation of
government financial assets.
Well-being benefits from high income levels, but also relies on many other strengths
(Figure 1). Most people enjoy a healthy work-life balance and supportive social
connections. Housing is generally spacious and well-equipped. Gender inequalities are
comparatively low, especially as regards wages (Figure 2).
Figure 1. Wellbeing is high in multiple dimensions
Better Life Index, country rankings from 1 (best) to 35 (worst), 2017
20% top performers 60% middle performers 20% bottom performers Luxembourg
3
6 7
10 11
14
15 15
16
18
29
Income and Housing Jobs and Civic Work-life Social Personal Health status Subjective Environmental Education and
wealth earnings engagement balance connections security well-being quality skills
Note: Each well-being dimension is measured by one to four indicators from the OECD Better Life Index set.
Normalised indicators are averaged with equal weights.
Source: OECD (2018), OECD Better Life Index, www.oecdbetterlifeindex.org.
StatLink 2 https://doi.org/10.1787/888933951095
However, prosperity and quality of life cannot be taken for granted, and face some risks.
For example, important challenges remain in education and skills, partly due to the large
diversity of the resident population. Furthermore, though most immigrants find a job, they
tend to earn less than the native-born and are more exposed to poverty, which weighs on
the poverty rate for the population as a whole (Figure 3). The provision of multilingual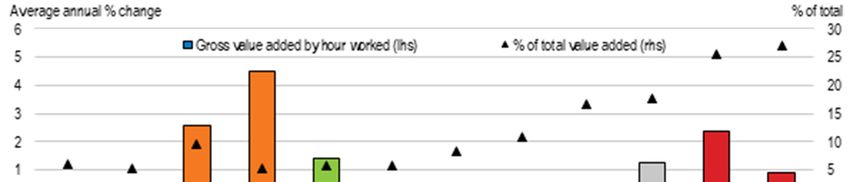
10 KEY POLICY INSGHTS
education and 20 hours per week of free care for children aged 1-4, introduced in 2017, is
a worthy policy initiative to address these challenges, which were extensively analysed in
the 2017 OECD Economic Survey of Luxembourg.
Figure 2. Gender wage and employment gaps are comparatively small
Percentage, 2017 or latest year available
A. Wage gap B. Employment gap
40 40
35 35
30 30
25 25
20 20
15 15
10 10
5 5
0 0
ITA
FRA
CZE
LVA
BEL
NZL
ISL
IRL
CHL
GRC
SVN
TUR
NOR
HUN
LTU
NLD
DEU
FIN
GBR
CAN
ISR
JPN
KOR
PRT
AUT
EST
LUX
DNK
MEX
ESP
SWE
AUS
CHE
SVK
USA
POL
OECD
ITA
ISL
IRL
FIN
CAN
LTU
ISR
SVN
DEU
NLD
HUN
JPN
TUR
EST
AUT
PRT
SWE
DNK
LUX
FRA
LVA
AUS
USA
ESP
CHE
SVK
CZE
MEX
BEL
NZL
POL
CHL
NOR
GBR
OECD
GRC
KOR
Note: The gender wage gap is defined as the difference between median earnings of men and women relative
to median earnings of men, for full-time employees. The employment gap is defined as the difference in
percentage points between the employment rates of men and women.
Source: OECD Labour Force Statistics (database).
StatLink 2 https://doi.org/10.1787/888933951114
This Survey focuses on three main challenges. The first relates to housing, which is
analysed in the thematic chapter. Strong population growth and supply constraints have
made housing prices surge, which worsens affordability problems and creates
vulnerabilities for some households and for some banks. The second main challenge is
sluggish productivity growth, which has been lasting for several years. The third challenge
is to achieve a more sustainable and inclusive growth. Environmental quality has
deteriorated due to transport emissions and congestion related to cross-border commuting
and urban sprawl. Facilitating labour market integration of older people is also an issue,
notably since under unchanged policies ageing will create a long-term fiscal challenge.
Against this background, this Survey has three main messages:
Tackling housing supply constraints, such as land hoarding, and increasing the
supply of social rental housing are key to improving housing affordability.
Reviving productivity growth will require supporting viable non-frontier firms to
catch up, inter alia through digitalisation and related upskilling, and to help frontier
firms to innovate more.
Growth, equity and sustainability would all benefit from fiscal reforms to address
rising pension expenditure and tilt revenues towards environmental and property
taxation.KEY POLICY INSIGHTS 11
Figure 3. The risk of poverty among immigrants is a concern
Percentage of population at a risk of poverty, age 18 and above, 2017 or latest year available
A. All population
30 30
25 25
20 20
15 15
10 10
5 5
0 0
ISL
NOR
FIN
HUN
NLD
SVN
BEL
IRL
GBR
DEU
TUR
GRC
LTU
CZE
SVK
FRA
DNK
CHE
SWE
LUX
ITA
ESP
LVA
AUT
PRT
EST
POL
EU28
B. Native born
25 25
20 20
15 15
10 10
5 5
0 0
ISL
NLD
HUN
FIN
SVN
IRL
DEU
TUR
LTU
CZE
FRA
SVK
SWE
LUX
DNK
CHE
ITA
ESP
LVA
AUT
PRT
EST
NOR
BEL
EU28
GBR
POL
GRC
C. Foreign born
45 45
40 40
35 35
30 30
25 25
20 20
15 15
10 10
5 5
0 0
FIN
CZE
FRA
ITA
PRT
AUT
EST
TUR
HUN
ISL
POL
IRL
GBR
DEU
NOR
SVN
NLD
LTU
BEL
GRC
CHE
SVK
LUX
DNK
SWE
LVA
ESP
EU28
Note: The at-risk-of-poverty rate is the share of people with an equivalised disposable income (after social
transfers) below the at-risk-of-poverty threshold, which is set at 60 % of the national median equivalised
disposable income after social transfers.
Source: Eurostat, "Income and living conditions".
StatLink 2 https://doi.org/10.1787/88893395113312 KEY POLICY INSGHTS
Growth has been solid, but there are risks ahead
After somewhat lower figures in 2016-2017, mainly caused by disappointing developments
in the non-financial sector, GDP growth rebounded in 2018, outperforming the euro area
average (Table 1 and Figure 4, Panel A). The lasting effects of the 2017 cuts in personal
income taxation, high household confidence and a strong labour market have all boosted
private consumption. The unemployment rate has declined to just above 5%, although it
remains elevated among young workers (Figure 4, Panel B).
Table 1. Macroeconomic indicators and projections
Annual percentage change, volume (2010 prices)
2015
Current prices 2016 2017 2018 2019 2020
(billion EUR)
Gross domestic product (GDP) 51.6 2.4 1.6 2.6 2.0 2.5
Private consumption 15.9 1.7 3.0 4.2 2.8 3.6
Government consumption 8.7 2.5 3.5 4.0 4.2 3.2
Gross fixed capital formation 9.4 10.1 3.9 -2.8 5.5 4.5
Housing 1.6 8.3 0.5 15.3 -8.6 2.5
Final domestic demand 33.9 4.1 3.4 2.2 3.9 3.7
Stockbuilding1 0.5 -0.4 -0.5 0.6 -0.6 0.0
Total domestic demand 34.4 3.5 2.6 3.3 3.0 3.6
Exports of goods and services 115.9 3.8 -1.9 4.6 3.8 4.1
Imports of goods and services 98.8 4.5 -2.2 5.1 4.4 4.8
Net exports1 17.1 0.1 -0.1 0.5 0.1 0.1
Other indicators (growth rates, unless specified)
Potential GDP .. 2.8 2.8 2.6 2.6 2.6
Output gap2 .. -0.7 -1.9 -1.9 -2.6 -2.7
Employment .. 2.3 2.8 2.8 2.4 2.3
Unemployment rate .. 6.3 5.9 5.5 5.2 5.1
GDP deflator .. 0.9 2.1 3.8 2.8 2.1
Harmonised consumer price index .. 0.0 2.1 2.0 1.8 2.0
Harmonised core consumer price index .. 1.0 1.4 0.9 1.8 2.0
Household saving ratio, net3 .. 13.7 16.5 16.5 16.1 15.9
Current account balance4 .. 5.1 5.0 4.8 4.0 4.2
General government fiscal balance4 .. 1.9 1.4 2.4 1.9 1.9
Underlying general government fiscal balance2 .. 2.2 2.4 3.5 3.3 3.3
Underlying government primary fiscal balance2 .. 2.0 2.3 3.3 3.2 3.2
General government gross debt (Maastricht)4 .. 20.7 23.0 21.4 21.7 22.1
General government net debt4 .. -49.9 -50.0 -49.4 -49.1 -48.7
Three-month money market rate, average .. -0.3 -0.3 -0.3 -0.3 -0.3
Ten-year government bond yield, average .. -0.2 0.5 0.6 0.3 0.4
1. Contribution to changes in real GDP.
2. As a percentage of potential GDP. Based on OECD estimates of cyclical elasticities of taxes and expenditures.
For more details, see OECD Economic Outlook Sources and Methods.
3. As a percentage of household disposable income.
4. As a percentage of GDP.
Source: OECD (2019a), OECD Economic Outlook: Statistics and Projections (database), June.KEY POLICY INSIGHTS 13
Figure 4. Macroeconomic developments are solid
Y-o-y %
A. Real GDP growth B. Unemployment rates
% of labour
changes force
12 35
Luxembourg Luxembourg, under 25
10
30
8 Euro area Euro area, under 25
6 25
4
20
2
0 15
-2
-4 10
Luxembourg
-6
Euro area 5
-8
-10 0
2007 2009 2011 2013 2015 2017 2019 2007 2009 2011 2013 2015 2017 2019
C. Current account balance Y-o-y % D. Inflation (harmonised)
% of GDP changes
70 6
Goods Services Headline inflation
60 Income Net transfers
50 Current account 5
Goods and services Core inflation
40
4
30
20 3
10
0 2
-10
1
-20
-30 0
-40
-50 -1
2007 2009 2011 2013 2015 2017 2019 2007 2009 2011 2013 2015 2017 2019
Source: OECD Economic Outlook (database); Eurostat, Employment and Unemployment (Labour Force
Survey) Statistics; OECD National Accounts Statistics.
StatLink 2 https://doi.org/10.1787/888933951152
However, growth has slowed down towards the end of 2018, in line with developments in
the euro area as a whole. Prospects of subdued euro area growth in the near future are likely
to affect Luxembourg, given the very strong trade and financial linkages with euro area
partners (Figure 5). In case of a downturn, the government should allow automatic
stabilisers to operate and, if the downturn intensifies, implement a countercyclical fiscal
expansion, taking advantage of Luxembourg’s ample fiscal space. Building on recent
measures, further lowering labour taxation at modest income levels would provide short-
run stimulus and foster labour market inclusiveness by reducing unemployment among
low-skilled workers.
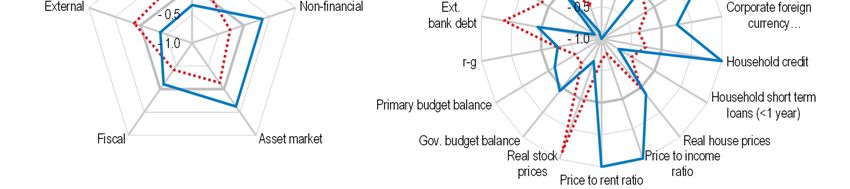
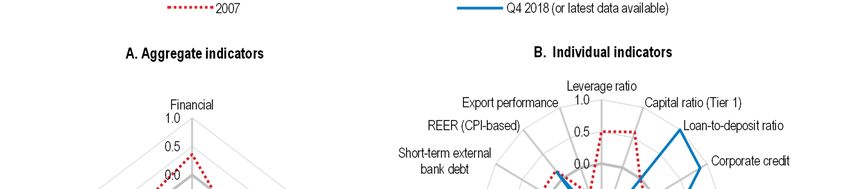
Risks are both of internal and external nature and have become tilted to the downside
(Table 2). At home, rising real estate prices and mortgage indebtedness have stoked
vulnerabilities in asset markets and in the resident non-financial sectors; indicators point to
historically high risk in the credit and housing markets (Figure 6). As a consequence, house
price reversals or steep interest rate hikes could affect some banks. On the external front,
rising trade tensions could lower GDP growth by about 1pp in 2019 (STATEC, 2018b).14 KEY POLICY INSGHTS
The impact of Brexit is uncertain. On the one hand, potential disruptions could harm the
financial sector in case of a “hard Brexit”; on the other hand, some financial firms have
already announced the reallocation of their activities to Luxembourg.
Figure 5. Luxembourg mainly trades with European partners
Share of exports by sector and destination, 2017
A. Goods by destination B. Services by destination
1% 1% 1% 1%
4% Euro area 6% Euro area
5%
8% Other EU
Other Europe
19% Other Europe
Asia and Oceania 10%
Asia and Oceania
North America 55%
North AmericA
70% Africa 19% Africa
South America South America
C. Goods by sector D. Services by sector
Manufactured goods Financial services
4% Other business services
5% Machinery and transport 19%
equipment
7% Transport
Chemicals and related
38% 5%
8% products, Travel
4%
Miscellaneous
manufactured articles ICT services
11% 4%
Food and live animals 3%
58% Cultural, and recreational
services
3%
Commodities and Insurance and pension
27% transactions 3% services
Others
Others
Note: In Panel C, Others include crude materials, beverages and tobacco, mineral fuels and lubricants, and
animal and vegetable oils. In Panel D, Others include intellectual property charges, insurance and pension,
construction services, maintenance services, and manufacturing services. In 2017, goods made up 13% of
exports while services made up 87% of exports.
Source: OECD International Trade Statistics.
StatLink 2 https://doi.org/10.1787/888933951171KEY POLICY INSIGHTS 15
Table 2. Low probability events that could lead to major changes in the outlook
Vulnerability Possible outcome Possible policy action
High household Sharp reversals in real estate prices and Expand the macroprudential toolkit with borrower-
indebtedness and steep increases in interest rates could put based measures to contain credit growth, as proposed
rising real estate some households in financial distress, and in draft legislation. Address structural factors in housing
prices endanger some banks. markets that contribute to rising prices. In case of a
housing market downturn, consider taking fiscal policy
measures, which could take the form of a temporary cut
in transaction taxes for houses sold in a low price range.
Rising trade tensions Degradation of the external environment Maintain close supervision of banks and investment
or heightened and materializing risks in international funds. Continue to participate in international
financial volatility markets would impact demand for financial collaboration platforms that promote free markets and a
could affect the fund services and lower growth. rules-based trade system.
industry.
Disorderly exit of the As the United Kingdom is a major trading Implement contingency plans.
United Kingdom partner, particularly for financial services,
from the European its disorderly exit from the EU could lead to
Union. disruptions for Luxembourg’s financial
activities. At the same time, Luxembourg
could benefit from the reallocation of banks
and insurance companies.
Figure 6. Macro-financial vulnerabilities have increased in housing and credit markets
Index scale of -1 to 1 from lowest to greatest potential vulnerability, where 0 refers to long-term average, period since 1970
Note: Each aggregate macro-financial vulnerability dimension is calculated by aggregating (simple average)
normalised individual indicators from the OECD Resilience Database. Individual indicators are normalised to
range between -1 and 1, where -1 to 0 represents deviations from long-term average resulting in less
vulnerability, 0 refers to long-term average and 0 to 1 refers to deviations from long-term average resulting in
more vulnerability.
Source: Calculations based on OECD (2019a), OECD Resilience Database, February.
StatLink 2 https://doi.org/10.1787/888933951190
Strengthening financial regulation to address risks
External risks to the large financial sector call for enhanced monitoring
The financial sector is the most important pillar of Luxembourg’s economy, accounting in
2017 for 28% of GDP and 10% of total employment (Figure 7). As such, the financial
sector is also a major driver of the country’s macroeconomic performance (Figure 8).16 KEY POLICY INSGHTS
Luxembourg’s attractiveness for finance is explained by its stable macroeconomic and
political environment, multilingual and multicultural society, favourable overall tax
settings, efficient legal framework, openness and technological readiness, as well as by its
capacity to attract and retain talent, thus creating a pool of labour with the required skills
and expertise (Global Competitiveness Report, 2017).
Figure 7. The financial sector accounts for a large share of total value added
Share of total value added, 2010 prices
% of total value added % of total value added
35 35
Manufacturing ICT
Financial and insurance Professional, scientific and technical activities
30 30
25 25
20 20
15 15
10 10
5 5
0 0
2000 2001 2002 2003 2004 2005 2006 2007 2008 2009 2010 2011 2012 2013 2014 2015 2016 2017
Source: OECD National Accounts database.
StatLink 2 https://doi.org/10.1787/888933951209
Figure 8. The contribution to growth from financial services has been high
Contributions to total value added growth, y-o-y changes
% %
10 10
Financial and insurance activities
8 Other sectors 8
GDP
6 6
4 4
2 2
0 0
-2 -2
-4 -4
-6 -6
2000 2001 2002 2003 2004 2005 2006 2007 2008 2009 2010 2011 2012 2013 2014 2015 2016 2017
Source: OECD National Accounts database.
StatLink 2 https://doi.org/10.1787/888933951228
Luxembourg investment funds rank second worldwide in terms of assets held, after the US,
and operate on global financial markets. Indeed, actors from around the world invest in
funds domiciled in Luxembourg, which in turn invest in various markets and asset classes
abroad. The banking sector mainly comprises international banks with many cross-border
activities. Many of these banks are foreign-owned with parent companies abroad, such thatKEY POLICY INSIGHTS 17
at the end of 2017, 83% of total inter-bank credit consisted in intra-group lending (BCL,
2018). Finally, these various actors are strongly inter-connected since investment funds
hold deposits and claims over depository banks, although, according to the financial
supervisor, the Commission de Surveillance du Secteur Financier (CSSF), internal stress
testing shows that this interconnection does not represent a major channel of risk.
Linkages of credit institutions and investment funds to international markets expose the
domestic economy to external financial shocks. In particular, heightened financial volatility
and tensions on global stock markets could affect the fund industry. Assets under
management have been growing rapidly since the global financial crisis, due to decreased
bank intermediation, the expansion of the ECB balance sheet and the low interest rate
environment, which created abundant liquidity and motivated search for higher yield
(Figure 9). However, the financial market volatility observed in 2018 weighed on the
expansion of the sector compared to previous years, illustrating its sensitivity to the
materialization of external risks (STATEC, 2018b).
Figure 9. Assets under management have been on an upward path since the crisis
EUR billion EUR billion
5000 5000
Credit institutions, total assets Investment funds, assets under management¹
4500 4500
4000 4000
3500 3500
3000 3000
2500 2500
2000 2000
1500 1500
1000 1000
500 500
0 0
2001 2002 2003 2004 2005 2006 2007 2008 2009 2010 2011 2012 2013 2014 2015 2016 2017 2018
1. Undertakings for collective investment (UCI), net assets.
Source: Banque centrale du Luxembourg, Statistical tables.
StatLink 2 https://doi.org/10.1787/888933951247
The financial sector’s exposure to external risks warrants substantial surveillance and
monitoring. In addition to the supervision conducted by the ECB, the CSSF has been
increasing its staff and runs on-site inspections and fund-bank stress tests twice a year,
which is welcome, in addition to engaging in international institutions. Efforts to monitor
and supervise must continue to keep pace with the financial sector’s size and complexity.
For example, regarding the fund industry, authorities must keep up on-site inspections and
pursue efforts to close remaining data gaps, so that supervision on an individual fund basis
can be enhanced. Furthermore, credit risks on intra-group exposures in the banking sector
should continue to be closely monitored. These exposures build up through liquidity
transfers to parent banks abroad, under an exemption from large exposure limits for intra-
group exposures. The supervisor should continue to verify that these exemptions still
comply with the conditions set out by law , assess the risk arising from the resulting intra-
group exposure, and recall the exemption if need be.18 KEY POLICY INSGHTS
Macroprudential tools can help contain soaring house prices
Housing prices have been increasing strongly since the crisis (Figure 10), which is likely
to reflect structural factors, as discussed in the thematic chapter. Strong economic and
demographic growth has been pushing up demand. Owing to low interest rates and tax
deductibility of mortgage interest payments, this demand has been increasingly financed
by indebtedness. As residential real estate construction has remained subdued due to supply
constraints, this has resulted in steep price rises.
Figure 10. Real house prices are growing strongly
Percentage change in real house price indexes from Q1-2008 to Q4-2018, s.a.
100 100
80 80
60 60
40 40
20 20
0 0
-20 -20
-40 -40
-60 -60
IRL
FIN
ISR
LVA
ESP
ITA
SVK
FRA
DNK
USA
MEX
CZE
AUS
LUX
CHE
SWE
GRC
LTU
SVN
NLD
Euro area
KOR
GBR
HUN
BEL
ISL
JPN
CHL
DEU
NOR
NZL
CAN
EST
PRT
AUT
OECD
Source: OECD Analytical House Price Indicators.
StatLink 2 http://dx.doi.org/10.1787/888933951266
Mortgage debt represented 91% of total household liabilities in 2014 (Girshina et al., 2017).
Rising debt has made Luxembourg’s debt-to-income (DTI) ratio comparatively high, at
176% in 2017 against 108% for the EU average (BCL, 2018). The same holds for the debt-
service-to-income (DSTI) ratio (17%, against 14% for the OECD average). In contrast, at
34%, the loan-to-value (LTV) ratio is below the OECD average (43%), reflecting
households’ high assets, which are partly a consequence of rising house prices.
One way to assess vulnerabilities linked to the real estate market is to determine the share
of households whose debt burden exceeds some commonly accepted thresholds. These
households could be vulnerable to real estate price drops, income losses or interest rate
hikes, as most outstanding loans are variable-rate ones (BCL, 2018). In Luxembourg, the
share of vulnerable households on the basis of the debt-to-income and debt-service-to-
income ratios is internationally high, while the opposite is true for the loan-to-value ratio
(Figure 11).
For all three indicators, however, Luxembourg’s shares are among the highest when
focussing on households in the bottom wealth quintile. Moreover, younger households are
more likely to be financially vulnerable (Giordana and Ziegelmeyer, 2017). As regards
bank vulnerabilities, exposures to the real estate market represent 50% of GDP (ESRB,
2016) and are concentrated in a small number of domestic banks, including some identified
as systemically important (BCL, 2018). However, according to the CSSF, regular stress
testing shows that banks would withstand extreme mortgage default rates and house price
declines as observed in the context of the 2008 crisis without the need of recapitalization.KEY POLICY INSIGHTS 19
Figure 11. The share of over-indebted households is high, in particular for those with low wealth
A. Share of households with debt-to-income ratio exceeding 300%
2014
100 100
All households Households in the bottom wealth quintile
90 90
80 80
70 70
60 60
50 50
40 40
30 30
20 20
10 10
0 0
FIN DEU POL EST BEL HUN SVK LVA AUT SVN ITA FRA GRC IRL ESP LUX NLD PRT
B. Share of households with loan-to-value ratio exceeding 75%
2014
All households Households in the bottom wealth quintile
100 100
90 90
80 80
70 70
60 60
50 50
40 40
30 30
20 20
10 10
0 0
AUT BEL ITA LUX SVN SVK POL FRA DEU FIN HUN ESP EST GRC PRT NLD LVA IRL
C. Share of households with mortgage-debt-service-to-income ratio exceeding 40%
2014
70 70
All households Households in the bottom wealth quintile
60 60
50 50
40 40
30 30
20 20
10 10
0 0
FIN AUT DEU BEL SVK POL NLD PRT LVA IRL FRA ITA LUX EST ESP SVN GRC HUN
Note: Computations of these shares only include households with mortgage on their main residence. The debt-
to-income ratio calculates outstanding debt on main residence divided by annual household gross income. The
loan-to-value ratio computes the outstanding stock of main residence mortgages divided by the current value
of the main residence. The debt-service-to-income ratio represents monthly debt service payment on main
residence (including interest and principal, excluding taxes) divided by monthly household gross income. The
thresholds of respectively 300%, 75% and 40% are commonly used in the literature on household financial
vulnerabilities, for example in studies covering Luxembourg (Giordana and Ziegelmeyer, 2017), the euro area
(ECB, 2013) or the UK (IMF, 2011).
Source: HFCS database, LWS database, OECD Affordable Housing Database.
StatLink 2 https://doi.org/10.1787/88893395128520 KEY POLICY INSGHTS
Sustained increases in housing prices and household indebtedness warrant expanding the
macroprudential toolkit. In 2016, the ESRB issued a warning to Luxembourg, considering
that the existing policies were insufficient to contain risks and financial vulnerabilities in
the residential real estate market (ESRB, 2016). In the light of fast-paced credit growth,
Luxembourg has been stepping up its macroprudential capital requirements, upon
recommendations of the Comité du Risque Systémique (CdRS). Since 2012, banks must
use a 75% (instead of the standard 35%) risk weight for the part of a new mortgage loan
above an LTV of 80%. In 2014 Luxembourg introduced a capital conservation buffer of
2.5%, in 2016 an O-SII (Other Systemically Important Institutions) buffer, and at the end
of 2018 the counter-cyclical capital buffer was raised to 0.25%. However, there are
currently no measures focussing specifically on borrower risks in Luxembourg, while this
type of instrument has been increasingly adopted in OECD countries (Figure 12). The
relatively recent implementation of these measures makes it difficult to assess their impact.
However, a growing empirical literature points to the effectiveness of LTV and DSTI ratios
to contain mortgage lending and house price increases (Cerutti et al., 2017; IMF, 2014; Lim
et al., 2011; Kuttner and Shim, 2013).
A 2018 draft law would enable the CSSF to set limits to mortgage credit, including DTI,
LTV and DSTI caps, upon the recommendation of the Conseil du Risque Systémique
(CdRS) and after consulting with the central bank. The draft law received a favourable
opinion from the ECB and is pending Parliament approval. Like other European countries
facing tensions in their housing markets, Luxembourg should move ahead in the
implementation of this type of borrower-based macro-prudential instruments.
Additionally, the authorities should be prepared to use remedial measures in the event of a
serious housing market downturn, which could depress household consumption through
negative wealth effects, and produce financial stress. For instance, the authorities could
consider a temporary cut in transaction taxes for houses sold in a given (low) price range.
Such policy has been found effective in the UK to uphold consumer spending and minimise
house price falls (Best and Kleven, 2017).
Figure 12. Borrower-based macroprudential measures have been increasingly implemented
Number of OECD countries with limits to debt-service-to-income (DSTI) and loan-to-value (LTV)
18 18
LTV DSTI
16 16
14 14
12 12
10 10
8 8
6 6
4 4
2 2
0 0
2000 2001 2002 2003 2004 2005 2006 2007 2008 2009 2010 2011 2012 2013 2014 2015 2016
Source: OECD Resilience database.
StatLink 2 https://doi.org/10.1787/888933951304KEY POLICY INSIGHTS 21 Luxembourg has become a gateway for fintech and big tech firms Luxembourg has succeeded in attracting prominent fintech and big tech companies. Licensed by the Minister of Finance (upon advice from the CSSF) to perform different activities (e.g. those of banking, payment or e-money institutions), these companies then service customers all over Europe. Some of these firms offer online checking accounts and payment services with lower fees than those charged by incumbent banks. Others operate trading platforms for virtual assets (or cryptoassets). Others still are exploring the use of blockchain (or distributed ledger technology) to cut costs in the fund distribution (ILNAS, 2018). It is still early to assess the contribution of these strands of innovative finance to economic activity through conventional metrics, like value added or employment. But they clearly have the potential to help preserve and enhance Luxembourg’s competitive edge in financial services. At the same time, fintech and big tech activities raise important regulatory issues, often with a cross-border dimension, which calls for action at the EU level. Large cryptoasset trading platforms raise unfair trading concerns Cryptoasset trading platforms allow buying and selling cryptoassets as well as the conversion of cryptoassets into fiat currency. Luxembourg is home to two entities of two large groups active in trading, Bitstamp and bitFlyer, which also operate as payment institutions. Bitstamp, for instance, ranks third among cryptoasset trading platforms with respect to the Bitcoin trading against the Euro, with around 10% of global market share. Bitstamp Europe S.A. (the Luxembourg entity) operates as a payment institution only and does not have any cryptoasset trading platform in Luxembourg, whereas bitFlyer Europe S.A. (the Luxembourg entity), in addition to payment services, operates a cryptoasset trading platform. The CSSF was the first EU supervisor to have granted a license of a payment institution to these platforms, covering the fiat currency part of their activities, thus requiring compliance with legislation to prevent money laundering and terrorist financing, as well as with relevant regulation in other areas (e.g., governance, internal control). However, the payment regulations in Europe do not cover risks related to cryptoasset trading, such as market manipulation and insider trading. There is growing evidence of price manipulation in the bitcoin markets (Gandal et al., 2018; Griffin and Shams, 2018). In this context, a recent report based on questionnaires sent to major platforms operating in the US (Office of the New York Attorney General, 2018) found that often those platforms have not implemented any formal policy to detect market manipulation and it is not clear either whether those platforms prevent insider trading. Furthermore, there is no European or Luxembourg regulation setting rigorous standards for listing a new cryptoasset, and platforms themselves do not have such standards either. There is therefore a case for regulation of trading activities of cryptoasset trading platforms, but still no international “best practices” in this domain. The EU authorities have not yet decided whether to consider cryptoassets as transferable securities and, hence, the EU financial rules (e.g. MiFID II, the Market Abuse Directive) do not apply to their trading (ESMA, 2019). The authorities in Luxembourg have always been in favour of trying to fit the new business models into existing European regulation (such as the directive on payment services PSD2), rather than developing specific regulation on their own while waiting for a common EU solution. Other jurisdictions have designed a specialized license (e.g BitLicense in New York, amended Payment Services Act in Japan and the recently
22 KEY POLICY INSGHTS
adopted PACTE law in France), and China has banned these platforms altogether (in 2017).
Numerous consultations and reports suggest that policy makers are in the process of
learning about this new asset class (e.g. ESMA, 2018, 2019; OECD, 2019a; Le Moign,
2018).
To foster learning on how best to ensure fair trading, the CSSF should have the legal
capacity to conduct inquiries into the activities of trading platforms. As of now, the legal
power of the CSSF is limited to issuing warnings to retail investors about cryptoasset
related risks and it does not have any supervisory power over these cryptoasset activities.
Eventually, trading platforms should be subject to regulation similar to the regulation of
other market operators, preferably at the EU level, to prevent regulatory competition
(ESMA, 2019). In addition, the CSSF should continue, in line with the warnings issued in
2018, to disseminate information to investors about the risks of virtual currencies.
Enforcement against international corruption needs to be stepped up
Luxembourg is regarded as one of the least corrupt countries in the world, according to
different indices of perception of corruption (Figure 13). Fighting corruption is important
for ethical, political and economic reasons. On the economic front, it undermines the
business climate, distorts competition and can be a major driver of public spending
inefficiency. Across the EU, Luxembourg residents are among those who perceive
corruption to be less of a problem both in public institutions and as part of the country’s
business culture (European Commission, 2017).
Figure 13. Corruption is perceived as very low
A. Transparency International indicators B. World Economic Forum indicators
100=best 100=best
100 100
90 90
80 80
70 70
60 60
50 50
40 40
30 30
20 20
10 10
0 0
ITA
ITA
FIN
NLD
CAN
DEU
GBR
JPN
ISR
SVN
KOR
HUN
TUR
FIN
JPN
NLD
CAN
GBR
DEU
ISR
KOR
TUR
SVN
HUN
DNK
NZL
SWE
CHE
LUX
AUS
ISL
BEL
IRL
FRA
USA
CHL
POL
CZE
LVA
ESP
SVK
MEX
LUX
CHE
ISL
NZL
AUS
DNK
IRL
SWE
FRA
BEL
CHL
USA
POL
LVA
CZE
ESP
SVK
MEX
NOR
AUT
EST
PRT
GRC
NOR
AUT
EST
PRT
GRC
Note: “Transparency International indicators” refers to the average of five sub-indicators available for all
OECD countries in the “Corruption Perception Index”; “WEF indicators” refers to the World Economic
Forum’s Executive Opinion Survey.
Source: Transparency International; and World Economic Forum.
StatLink 2 https://doi.org/10.1787/888933951323
However, the large magnitude of capital flows involving Luxembourg poses associated
risks of economic crime, especially of a cross-border nature. A case in point is bribery of
foreign public officials. Luxembourg’s enforcement of the OECD Anti-Bribery
Convention remains very modest, with only one criminal case concluded over 1999-2017,
and only one individual sanctioned (OECD, 2018f). The authorities claim that recent draft
legislation will, when approved, implement two OECD recommendations for combattingKEY POLICY INSIGHTS 23
this form of corruption. They have also mentioned that Luxembourg has adequately
responded to requests for mutual legal assistance from other countries, sanctioned one case
in 2018, and investigated two more cases that are still ongoing. Progress on enforcement
will be assessed by the OECD Working Group on Bribery, with the next evaluation of
Luxembourg scheduled for 2021.
Luxembourg faces an inherent high risk of money laundering of foreign proceeds. The legal
framework to fight money laundering has been upgraded with the transposition into
national law of the 4th EU Anti-Money Laundering Directive, which was completed in
2018. Active enforcement is key for risk mitigation, and should be informed by the national
risk assessment exercise completed in 2018. In this context, a register of beneficial owners
of corporate and other legal entities, which will help detection, has been set up by recent
legislation (January 2019), and will be accessible to the authorities as of September this
year. A draft bill setting up a separate register of beneficial owners of trusts and other types
of legal arrangements is under preparation as part of the transposition of the 5th EU Anti-
Money Laundering Directive.
Fiscal reforms for inclusive growth and sustainability
The fiscal position is strong, but ageing poses a long-term challenge
Luxembourg has a fiscal surplus, which has been on an upward trend since the crisis
(Figure 14). After a slight decline in 2017, due to expansionary measures included in the
tax reforms and the loss of e-commerce VAT, the surplus exceeded 2% of GDP in 2018,
far above Luxembourg’s Medium Term Objective for 2016-2019 (-0.5% of GDP). Gross
public debt is among the lowest in the OECD, at 21% of GDP by end-2018. The
government’s objective to keep the public debt ratio below 30% and preserve the AAA
rating in the 2018-2023 legislature appears well within reach. Being a small open economy,
it is important for Luxembourg to maintain ample fiscal space. However, there is significant
budgetary room for manoeuvre, which could be used to support the economy in case of a
downturn characterised by weak demand.
Figure 14. The fiscal balance is sound
Percentage of GDP
7 7
6 6
5 5
4 4
3 3
2 2
1 1
0 0
-1 -1
-2 -2
2000 2001 2002 2003 2004 2005 2006 2007 2008 2009 2010 2011 2012 2013 2014 2015 2016 2017 2018 2019 2020
Source: OECD Economic Outlook (database).
StatLink 2 https://doi.org/10.1787/88893395134224 KEY POLICY INSGHTS
The pension system enjoys a comfortable situation in the short to medium term, with a
sizeable surplus of contributions over outlays and considerable accumulated assets.
Luxembourg has a detailed monitoring system in place, including a reassessment of the
financing of the general pension scheme every 5 years. In the future, when some conditions
are met, the authorities will be under a legal obligation to implement reforms, to be decided
and fully specified at the time. For instance, as per the 2012 pension reform, the automatic
indexation of pensions to wage developments is to be reduced (to an adjustable extent)
when contributions no longer cover pension expenditure. The 2012 reform also outlines
other possibilities, such as a suspension of end-of-the-year pensions (“allocation de fin
d’année”). Another mechanism is an increase in contributions, to be decided when the
reassessment taking place every 5 years concludes that, under current parameters, the
financial viability of the system is no longer guaranteed according to pre-defined
thresholds.
However, the relatively high replacement rates and low effective retirement age of the
pension system (OECD, 2017a) will entail considerable fiscal pressure in the long run.
Under the current parameters, ageing-related costs are projected to rise substantially (EC,
2018a; Figure 15): for instance, public expenditure on pensions is estimated to reach 18%
of GDP by 2070, against 11% on average in the EU. In this no-policy-change scenario,
there would be a large impact on public debt (Figure 16). Soaring pension costs stem from
an increasing dependency ratio (due to rising longevity) which is not compensated, unlike
in other EU countries, by an increasing retirement age or decreasing replacement rates (EC,
2018a).
Figure 15. Ageing related costs are projected to rise substantially
Percentage of GDP
30 Public pensions expenditure, gross Public pensions contributions 30
Long-term care expenditure Health care expenditure
25 25
Net ageing related spending
20 20
15 15
10 10
5 5
0 0
-5 -5
-10 -10
-15 -15
2016 2020 2025 2030 2035 2040 2045 2050 2055 2060 2065 2070
Note: Costs are interpolated based on projected figures for every 5 years, assuming no change in the current
parameters of the pension system. Net ageing-related costs amount to public expenditure on pensions, long-
term care and health care minus pension contributions.
Source: European Commission (2018a).
StatLink 2 https://doi.org/10.1787/888933951361KEY POLICY INSIGHTS 25
Figure 16. Debt is sustainable in the long-term provided ageing related costs are dealt with
Gross public debt, Maastricht definition, percentage of GDP
180 180
Baseline
160 160
Without offsetting ageing costs
140 140
Lower growth
120 120
Gross financial assets (in all three scenarios)
100 100
80 80
60 60
40 40
20 20
0 0
2000
2005
2010
2015
2020
2025
2030
2035
2040
2045
2050
2055
2060
Note: The baseline consists of the Economic Outlook No. 105 projections up to 2020, and the long-term
projections of the Economic Outlook No. 105 database afterwards. These long-term projections include a
primary balance gradually converging from 2 to 1% of GDP over the long-term, a real GDP growth rate close
to 2.5% and a real interest rate close to 1%. The "Lower growth" scenario assumes real GDP growth lower by
1% each year compared to the baseline. The "Without offsetting ageing costs" scenario assumes no change in
the current parameters of the pension system, and hence increased net ageing-related costs (reaching 17.8% of
GDP by 2070), in line with European Commission (2018a). All three scenarios assume that over the projection
horizon general government gross financial assets remain constant as a fraction of GDP, which implies that the
change in the general government gross debt-to-GDP ratio is larger than what would be implied by government
net lending and nominal GDP growth only.
Source: Adapted from OECD (2018), OECD Economic Outlook: Statistics and Projections (database), June;
Guillemette, Y. and D. Turner (2018), "The Long View: Scenarios for the World Economy to 2060", OECD
Economic Policy Paper No. 22., OECD Publishing, Paris; and European Commission (2018a), "The 2018
Ageing Report - Economic and budgetary projections for the 28 EU Member States (2016-2070)" Directorate-
General for Economic and Financial Affairs.
StatLink 2 https://doi.org/10.1787/888933951380
To contain these costs and ensure long-term sustainability, Luxembourg should adapt its
pension system, with the involvement of social partners and, if needed, gradual phasing-in
of reforms. Unlike in many other European countries, there are no plans to link the
retirement age to changes in life expectancy (OECD, 2017b), and therefore creating this
link should be considered. Furthermore, the gap between the statutory and effective
retirement age (65 against 61 in 2016) indicates that there is scope to restrict early
retirement schemes. Increasing the retirement age can have a regressive impact since more
educated and richer people tend to live longer; however, when the increase is linked to
longevity, the overall impact depends on how even across socio-economic groups gains in
life expectancy are (OECD, 2017c). Compensatory measures could be taken (or kept) for
those who started to work at a very young age since they are also those who tend to have a
lower life expectancy. In parallel or as an alternative to a higher retirement age, the
generosity of the replacement rate could be reviewed (IMF, 2019a).
Further adjusting corporate taxation to a globalised world
As a highly open economy, Luxembourg is sensitive to taxation developments at the
European and global levels. Luxembourg has been supportive of initiatives for greater tax
transparency and for tackling tax avoidance, such as the OECD/G20 Base Erosion andYou can also read