Māori Impacts from the Emissions Trading Scheme - Detailed Analysis and Conclusions
←
→
Page content transcription
If your browser does not render page correctly, please read the page content below
Māori Impacts from the
   Emissions Trading Scheme

    Detailed Analysis and Conclusions

                         Prepared by
37 Degrees South Limited and Cognitus Advisory Services Limited
Published in January 2008 by the Ministry for the Environment Manatū Mō Te Taiao PO Box 10 362, Wellington, New Zealand ISBN: 978-0-478-30204-2 (electronic) Publication number: 858 This document is available on the Ministry for the Environment’s website: www.mfe.govt.nz
Author Details

Chris Karamea Insley
Director of Strategy, 37 Degrees South

Qualifications
BBS (Finance), Post Grad Diploma Marketing & Logistics, MBA
Finance and Strategy, Harvard Business School

Memberships and affiliations
Sustainable Business Network, NZIF, IOD, NZIM

Tribal affiliations
Te Whanau A Apanui, Ngati Porou, Whakatohea, Ngai Te Rangi

Richard Meade
Principal, Cognitus Advisory Services Limited

Qualifications
BCA, BSc, BSc(Hons)

Memberships and affiliations
AFA, AEA, IAEE, NZIF, IOD, LEANZ

Tribal affiliations
None

Important Notice
In preparing this report the authors have relied upon public information, and information
provided by Ministry for the Environment and others, the accuracy or completeness of which
has not been verified. No warranty or indemnity, express or implied, is given by the authors or
their related institutions, to any party, as to the accuracy or completeness of this report, and no
liability is accepted by the authors or their related institutions for any losses or damages
incurred by any party relying on this report. The views expressed in this report should not be
taken to represent those of the institutions to which the authors are affiliated, or of any clients
for whom they have acted or are currently acting that have an interest in any of the matters
addressed in this report.
Acknowledgements
The authors gratefully acknowledge the co-operation and assistance of a great many parties in
preparing this report. Particular thanks go to the Ministry for the Environment, the Ministry of
Agriculture and Forestry, Treasury, and Landcare Research. The assistance received includes
the provision of information, advice, comments and generation of analysis. A more detailed list
of parties whom the authors wish to acknowledge is as follows, with apologies for any
inadvertent omissions.

Government agencies (in alphabetical order)
•     Agresearch – Peter Benfell
•     Crown Forestry Group – Sandy Rae
•     Landcare Research – Garth Harmsworth
•     Land Information New Zealand – Jean Greedy, Bart van Stratum
•     Māori Land Court – Shane Gibbons, Natasha Dauphin
•     Māori Trustee – Richard Wickens
•     Ministry for the Environment – Phil Gurnsey, Scott Gulliver, Chappie Te Kani
•     Ministry of Agriculture and Forestry – Bryan Smith, Mike Plivelich, Gerard Horgan,
      Alan Griffiths, Gerald Dreaver, George Ria, Rob Millar, Rod Forbes, Darren Austin
•     Scion – Douglas MacCredie, Tupara Morrisson
•     Statistics New Zealand – Andrew McLaren, Graeme Simpson
•     Te Puni Kokiri – Hillmare Schulze, Peter Himona, Doug Heinz, Paul Langham, Jason
      Clark, Tikitu Tutua-Nathan
•     Treasury – Peter Wilson, Amy Kearse, Nick Graham

Iwi organisations (in alphabetical order)
•     Lake Taupo Forest Trust – George Asher, Geoff Thorp, Charlotte Severne
•     Ngai Tahu Property – Edwin Jansen
•     Ngati Awa – Paul Quinn, Waaka Vercoe, Charlie Elliott
•     Ngati Tuwharetoa (Bay of Plenty) Settlement Trust – Elaine Savage
•     Tainui Group Holdings – Mike Pohio, Nathan York
•     Te Runanga O Ngati Porou – Apirana Mahuika
•     Te Runanga O Te Whanau – Rikirangi Gage
•     Te Uri o Hau Settlement Trust – Esther Gray
•     Whangaraa B5 Incorporation – Ingrid Collins

iv       Māori Impacts from the Emissions Trading Scheme
Other organisations and individuals (in alphabetical order)
• Bob Cottrell
• Business New Zealand – Phil O’Rielly, George Ridell
• Canterbury University – Bruce Manley
• Chandler Fraser Keating – Geoff Manners
• Federation of Māori Authorities – Paul Morgan
• Grace Webb Associates – Eli Grace-Webb
• Greenhouse Policy Coalition – Catherine Beard
• Hilton Collier
• MD Capital Management – Debbie Birch, Bruce Scott
• Motu – Suzi Kerr
• NZIER – John Stevenson
• Sara Lunam (on behalf of Solid Energy)
• Seafood Industry Council – Alastair Macfarlane, Victor Goldsmith
• Shell New Zealand – Matthew French, Jackie Maitland
• Te Rau Kupenga
• Waikato University – Frank Scrimgeour, Tamati Reedy
• Whaimutu Dewes
Māori Impacts from the Emissions Trading Scheme vForeword
Tena koutou.
Tena koutou, otira, i nga tini mate, kei tena marae, kei tena marae, e takoto ake nā. Kei te tangi
tonu te ngakau, ki a rātou kua haere ki tua o te ārai.
Heoi ano, tena tātou tonu nei, ā me ngā mihi hoki o te wā, o Matariki e arataki nei, i a tatou.
Arā ngā piki me ngā heke o te mahanatanga o te ao e noho nei tātau. E whakaaro tahi ana a
Aotearoa me era iwi nunui o te ao ki te waihanga kaupapa hei whakapumau i to tatou oranga ki
runga ki te mata o te whenua.
E ngākaunui ana te iwi Māori ki tenei kaupapa nui whakaharahara a, e ngakau nui ana ki nga
kaupapa kua whakaputaina mai e te kawanatanga hei whakatinana i ona ake whakaaro. Ko tona
whainga nui ia, ko te whai wāhi nui tonu o nga Iwi ki roto i ngā whiriwhiringa katoa e pa ana ki
tenei kaupapa.
Ma konei, ka taea e ratou te pupuri i o ratou tikanga me to ratou nei ake mana ki runga ki o
ratou whenua otira ki nga taonga katoa i mahue iho e nga matua tipuna. Ma konei ano ka
whakatipu kaha te oranga whanui o o ratou whanau o o ratou hapu a ka kiia o ratou uri he
tangata
Kia maumahara tatou ki te whakatauaki e kii a nei:
“He aha te mea nui o Te Ao?
he tangata, he tangata, he tangata”
[TRANSLATION] Greetings,
Let us pay respects to the departed from all regions. Let us also rejoice in our lives and in this
season.
Māori embrace the challenge of the Government’s ambitious climate change programme as
New Zealand works with the countries of the world to find new and innovative solutions to
address to the serious climate change problems facing the world today.
In doing so, always holding dear to core values as Māori, preserving our ancestral lands that are
the essence of who we are, to realise the dreams and aspirations of our elders.
Māori are committed to participating fully towards implementation of the of the climate change
programme that may enable our children and grandchildren to face a safe and secure future.
Let’s remind ourselves of a wise Māori proverb:
“What is the most important thing in the world?
It is people, it is people, it is people”
vi Māori Impacts from the Emissions Trading SchemeContents
Acknowledgements iv
Foreword vi
1 Introduction 1
1.1 Purpose of report 1
1.2 Assumed Māori interests 2
1.2.1 Economic sustainability 2
1.2.2 Land sustainability 2
1.2.3 Cultural sustainability – people 2
1.2.4 Other assumed Māori interests 3
1.3 Methodology and data sources 3
1.4 Key sectoral impacts and issues 6
2 Māori Contribution to New Zealand Greenhouse Gas
Emissions 8
3 Māori Economic and Socioeconomic Position 10
3.1 Overview of the Māori economy 10
3.2 Māori land-based activities 11
3.3 Issues with the ownership and use of Māori land 14
3.4 Māori socioeconomic position 16
4 Likely High-Level Generic Impacts of the ETS 17
4.1 Electricity and liquid fuel prices 17
4.2 Pre-1990 forests 18
4.3 Post-1989 forests 19
4.4 Wood processing, and pulp and paper 20
4.5 Agriculture, and food processing 20
4.6 Geothermal electricity generation and industrial processes 22
4.7 Research and development, and innovation 23
4.8 Impacts in perspective 23
5 Likely ETS Impacts on Māori – Absolute 26
5.1 Electricity and motor fuel prices 26
5.2 Fishing 27
5.3 Agriculture 28
5.4 Pre-1990 forestry 30
5.5 Post-1989 forestry 32
5.6 Regional considerations 34
5.7 Geothermal energy 36
Māori Impacts from the Emissions Trading Scheme vii5.8 Employment 36
5.9 Treaty settlement assets 38
6 Likely ETS Impacts on Māori – Relative to Non-Māori 40
6.1 Electricity and liquid fuel prices 40
6.2 Fishing 41
6.3 Agriculture and forestry 42
6.3.1 National level comparisons 42
6.3.2 Regional level comparisons 44
6.4 Geothermal energy 44
6.5 Employment 45
7 Summary of Findings 46
viii Māori Impacts from the Emissions Trading SchemeTables
Table 1.1: Key ETS impacts on and issues for Māori (by sector) 6
Table 3.1: Most significant regions by area in which Māori have interest in major land
uses 12
Table 3.2: Māori and non-Māori exotic forestry interests as at 2001 13
Table 3.3: Māori and non-Māori private indigenous forestry interests as at 2001 13
Table 5.1: Possible divergences of Māori interests within and between six main regions 35
Table 5.2: Predicted emissions charge impacts on Māori and non-Māori employment by
sector (assuming no free allocation of NZUs) 37
Table 5.3: Regional employment impacts of emissions pricing 37
Table 6.1: Relative Māori and non-Māori weekly household energy expenditures 40
Table 6.2: Relative national-level Māori and non-Māori interests in forestry and farming 42
Table 6.3: Relative sectoral support from the Government 2008–2025 43
Table 6.4: Relative Māori and non-Māori interests in each main farming type for regions
with most significant overall Māori land interest by area 44
Table 7.1: Outstanding ETS details with potential implications for Māori 48
Figures
Figure 3.1: Proportion of Māori and non-Māori land in main farm types (by area) 11
Figure 4.1: Motu analysis of per capita distribution of a $25/tonne agricultural emissions
charge 21
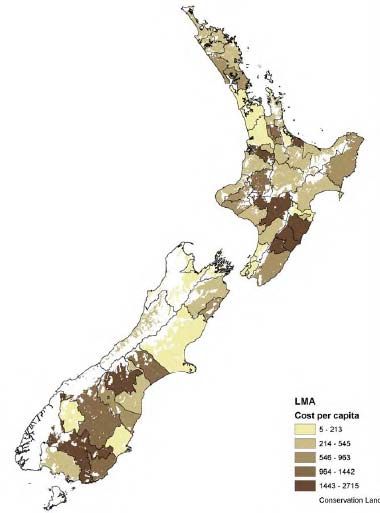
Figure 5.1: Crown forestry licensed lands (mostly pre-1990) available for future Treaty
settlements 39
Māori Impacts from the Emissions Trading Scheme ix1 Introduction
1.1 Purpose of report
This report provides an analysis of the likely impacts of the Government’s proposed emissions
trading scheme (ETS) on Māori. It also considers how the ETS might affect Māori differently
from non-Māori. Both positive and negative effects are considered. It takes the basic details of
the proposed ETS as read, and so does not repeat them here. The purpose of this report is to
inform the consultation process that the Government is undertaking with Māori in relation to the
ETS, and ultimately to inform the finalisation of climate change policy by the Government.
This report does not consider a number of things. Notably, it does not address issues arising in
relation to the ETS under the Treaty of Waitangi, instead focusing on the ownership and use of
assets by Māori. It does not consider the impact of climate change itself on Māori, or the
desirability of a climate change response by New Zealand. It does not consider the relative
merits of climate change mitigation versus climate change adaptation. Nor does it critique the
ETS, or debate alternatives to an ETS (such as a carbon tax), instead taking the ETS, as
proposed, as given. Finally, the report does not attempt to define interests at an iwi level,
instead considering national and (where possible) regional impacts.
Importantly, this report does not provide a comprehensive discussion of the likely absolute and
relative impacts of the ETS on Māori. It has not been possible to prepare such a comprehensive
analysis, not least because important ETS details such as how certain free allocations of New
Zealand Units (NZUs) will be made within the agricultural sector, and how assistance to
households to compensate for rising electricity prices, have not been announced. Furthermore,
details such as carbon accounting methodologies, compliance regimes and ETS-related taxation
are not yet finalised. Additionally, the timeline for the finalisation of ETS details has not
permitted a more detailed examination of the scheme’s impacts.
The report is structured as follows:
• The balance of Section 1 describes the assumed Māori interests of relevance to the ETS
impact assessment, and outlines methodology and data sources.
• Section 2 discusses simple measures of the relative contribution of Māori to New
Zealand’s greenhouse gas emissions.
• Section 3 provides a snapshot of aspects of the economic and socioeconomic position of
Māori.
• Section 4 sets out likely high-level and generic ETS impacts for various sectors relevant
to consideration of the ETS’s impacts on Māori.
• Section 5 discusses the likely impacts of the ETS on Māori in absolute terms.
• Section 6 extends the Section 5 discussion by considering the ETS’s likely impacts on
Māori relative to its impacts on non-Māori.
• Section 7 summarises the report’s findings.
Māori Impacts from the Emissions Trading Scheme 11.2 Assumed Māori interests
This report acknowledges that Māori are keenly interested in the values of sustainability.
Importantly, these values arise under three main heads – economic, social, and environmental.
These, and other assumed Māori interests, are summarised below.
1.2.1 Economic sustainability
Economic sustainability and importantly the ability for Māori to participate fully in any/all
related economic opportunities from the ETS emerged strongly as the most important key theme
from the national series of Māori consultation hui. Sir Apirana Ngata believed that Māori
success was dependent on Māori adaptation and flexibility. He did not see this as conflicting
with the retention of Māori culture. Ngata’s famous proverb (whakatauki) to a young Māori
child reflects his counsel on the importance of Māori pursuit of economic advancement
alongside other core value drivers:
“Grow tender shoot for the days of your world
Turn your hand to the tool of the European for the well being of your body
Turn your heart to the treasures of your ancestors as a crown for your head
Give your soul unto God the author of all things”
1.2.2 Land sustainability
Māori land is so central to Māori cultural values, beliefs and identity many Māori consider it
essential to retain Māori land as a distinct tenure system giving expression to the
whanaungatanga of whanau and hapu ties between people and the land. Māori land is “taonga
tuku iho” or an inheritance to be passed from generation to generation. Further, it is not the
mere passing of the title that is significant, rather it is the network of turangawaewae links that
the land ownership represents that are to be maintained: 1
“Ko te whenua te waiu mo nga uri whakatipu”
(the land will provide sustenance for future generations)
1.2.3 Cultural sustainability – people
Given the historical and cultural ties Māori have with particular regions, Māori are assumed to
have a greater interest in preserving the economic viability of their assets within those regions.
By so doing, Māori are assumed to be concerned with sustaining their communities within those
regions, and also the environment in which those communities live and operate.
He aha te mea nui o Te Ao, he tangata, he tangata, he tangata
What is the most important thing in the world?
It is people, it is people, it is people.
1
Māori Land Tenure Group, Hui Taumata, June 2006.
2 Māori Impacts from the Emissions Trading Scheme1.2.4 Other assumed Māori interests
Māori are also assumed to be interested with their ongoing ability to govern the management of
their assets, and their ability to turn their assets to higher and better use, both now and as future
new technologies allow.
Māori are further assumed to be interested in bearing only a fair, equitable and proportionate
burden of the costs of climate change mitigation in New Zealand. In determining what
constitutes a fair, equitable and proportionate burden Māori are assumed to be concerned with
their level of economic development relative to non-Māori (as a consequence of past Crown
actions or otherwise), as well as their relative contribution to New Zealand’s greenhouse gas
emissions. Māori are also assumed to be keenly interested in the development opportunities that
international emissions trading could offer.
More specifically, Māori are assumed to be interested in the impacts of the ETS on:
a) Māori household living costs – eg, in terms of likely ETS impacts on electricity and
liquid fuel (and gas) prices, and hence on the prices of other goods and services affected
by electricity and fuel prices
b) Māori employment prospects – eg, in terms of likely ETS impacts on sectors in which
Māori employment is concentrated
c) the value, usability, riskiness, and return potential of Māori-owned assets – including
assets acquired by Māori pursuant to Treaty settlements, or future such settlement assets
d) the preservation and protection of ancestral lands
e) the ability of Māori to govern the use of Māori-owned assets.
1.3 Methodology and data sources
This report compares the impact of the ETS on Māori against the counterfactual of no climate
change policy. Clearly it can be argued that absent the ETS the Government will likely
implement some form of climate change policy in the first Kyoto “commitment period” (CP1,
being 2008–2012 inclusive), given its commitments and liabilities under the Kyoto Protocol.
However, since such alternatives are likely to be more costly and/or less effective than an ETS-
like mechanism, it is assumed that even an alternative suite of climate change policies will
eventually need to converge on an ETS-like scheme. Hence, to provide a meaningful distinction
between the ETS and status quo, the status quo is assumed to involve no emissions charge or
carbon sink credit in the economy.
In assessing the economic impacts of the ETS on Māori this report shies away from referring to a
unitary “Māori economy”, given that Māori interests – like non-Māori interests – will not be
homogenous. Instead, to the extent that the available data permits, this report considers Māori
economic interests at a disaggregated level, in an attempt to isolate where Māori economic
interests might diverge under different aspects of the ETS. Thus, for example, Māori with
predominantly forestry interests might experience different ETS impacts from Māori with
predominantly fishing or agricultural interests. Moreover, Māori with mostly pre-1990 forestry
interests might experience different ETS impacts from those with mostly post-1989 forestry
interests. Similarly, among Māori with forestry interests, those with mostly exotic forestry
interests might experience different impacts from those with mostly indigenous forestry interests.
Māori Impacts from the Emissions Trading Scheme 3While preparing this report it was identified that certain key sectors and certain regions account
for the bulk of Māori economic interests. This remained broadly true whether Māori land uses
and economic interests were measured in terms of land areas or dollar values, with the key
exceptions being the major urban centres (in which the value of Māori economic interests is less
tied to owning large areas of land). As it happens, the regions with the largest Māori land
interests are also those with a higher Māori share of population than the national average.
Accordingly, analysis in this report has been directed mainly at the fishing, forestry, farming
and geothermal energy sectors, since they account for most of the Māori economic base, as well
as significant shares of Māori employment. Moreover, focus has also been directed at the six
regions with the largest Māori land interests by area (and relative Māori populations) – in
decreasing order they are Waikato, Hawke’s Bay, Gisborne, Manawatu-Wanganui, Bay of
Plenty and Northland. Finally, focusing on land areas rather than values may distort the actual
importance of each land type to Māori. For example, if dairy farming per hectare is more
valuable than sheep and beef farming per hectare, then the relative Māori interest in each farm
type will be more balanced. For want of better data, analysis in this report proceeds on the basis
of available land area figures.
While focusing on these sectors and regions will account for most of the value of Māori
economic interests, it must be acknowledged that this should not understate the importance of
ETS impacts in regions or sectors where Māori have more limited economic interests. For
example, where Māori have limited economic interests as a consequence of having lost
economic resources due to past Crown actions (as was particularly the case in the South Island),
they may in fact suffer greater adverse ETS-related impacts by virtue of not being able to
diversify those impacts across a wider asset base. Accordingly, there may be certain
disproportionate Māori interests from the ETS – both positively and negatively – not
highlighted in this report.
In preparing this report it has not generally been possible to produce original primary data.
Instead, reliance has been placed on existing data, particularly:
a) “Māori economy” – Māori Economic Development: Te Ohanga Whanaketanga Māori,
NZIER, 2003, and Māori Business and Economic Performance: A Summary Report,
NZIER, September 2005
b) Māori land ownership institutions and statistics – Hui Taumata Māori Land Tenure
Review Group: Discussion Paper, 23 June 2006, National Māori Land Information
Project: Final Report, Land Information New Zealand, 2004, and Māori Land
Administration: Client Service Performance of the Māori Land Court and the Māori
Trustee, Report of the Controller and Auditor General, March 2004
4 Māori Impacts from the Emissions Trading Schemec) Māori land-use details – Māori Perspectives on Kyoto Policy: Interim Results,
Harmsworth G, Landcare Research, 2003, and Māori Land Analysis Version 1.1: Results
by Region, MAF Policy, 2 December 2006 3
d) Māori socioeconomic position – The Social Report: Indicators of Social Wellbeing in
New Zealand, Ministry of Social Development, 2006, and The Net Worth of New
Zealanders: A Report on their Assets and Debts, Statistics New Zealand, 2002
e) other Māori economic and socioeconomic indicators – Census data from Statistics New
Zealand, as well as specialised data requests based on the Household Economic Survey,
Statistics New Zealand, 2004.
Primary data has been obtained in discrete areas, typically based on direct approaches to Māori
asset-owning bodies, and sometimes other bodies with access to industry data. Examples
include holdings of pre-1990 Crown Forestry Licensed lands held by iwi pursuant to completed
Treaty settlements, and fishing quota held by Māori (largely due to the 1992 “Sealords” deal).
Given the absence of comprehensive primary data and lack of time to comprehensively assess
the data to hand, our analysis has been supplemented by discussions with a range of parties and
organisations. These discussions have been directed at filling in data gaps as best as can be in
the time available, and to gain perspectives from affected parties on how the ETS is likely to
affect their interests.
Only limited, incomplete and sometimes contradictory or obviously deficient data is available
on the nature and extent of Māori asset ownership. Of particular note is the understatement of
Māori forest land ownership in certain key data sources, as well as the absence of published data
detailing Māori and non-Māori interests in pre-1990 and post-1989 forests. The absence of such
data weakens the conclusions that this analysis can reach regarding the ETS’s impacts on
different Māori forestry interests. Accordingly, its conclusions will in many instances be
indicative at best.
2
Ministry of Agriculture and Forestry emphasises that the Māori Land Information Base from which this
database was created is not an authoritative database of Māori land use, but simply the best dataset
currently available. It is recognised in this report that this database contains inaccuracies and
inconsistencies, but it is used despite this given the absence of a superior alternative.
3
Note that limited other detailed published research has been undertaken elsewhere within Crown Research
Institutes.
Māori Impacts from the Emissions Trading Scheme 51.4 Key sectoral impacts and issues
Table 1.1 summarises the key sectoral impacts and issues identified in this report.
Table 1.1: Key ETS impacts on and issues for Māori (by sector)
Sector Key impacts Key issues
Post-1989 forestry Opportunities for value-enhancing carbon Liabilities for natural losses.
sequestration on compliant land if landowners Compliance costs and penalties.
elect to enter them into the ETS.
Some post-1989 reversion may qualify for
Alternative schemes available.
credits.
Possible opportunities for Māori to further
differentiate sink credits for additional value.
Pre-1990 forestry Land values to be reduced, relative to Free NZU allocations based on forest land
economy with no emissions charges, to the areas to favour less valuable forests.
extent that land conversion options are made
Forthcoming decisions on the inclusion of
less valuable. Little or no impact likely where pre-1990 indigenous forestry in ETS.
conversion options are limited.
Forestry lessors can be liable for lessees’
Value loss offset to some extent by free NZU carbon emissions if they deforest plantings
allocations, possibly with windfall gain.
after lease expiration before those plantings
reach eight years of age.
Value impact on Crown Forestry Licensed
lands included in completed Treaty
settlements.
Compliance costs and penalties.
Wood processing, Sector may enjoy slight boost due to ETS,
and pulp and with Māori enjoying disproportionately
paper positive employment impacts.
Agriculture Farming profitability and hence land values No decisions yet made on:
are likely to be reduced, relative to an
• points of obligation for emissions liabilities
economy with no emissions charges.
• how liabilities will be devolved to farmers
Value loss offset to some extent by free NZU
allocations. • recipients of free NZU allocations or
• how free NZUs will be devolved to
farmers.
Need for Māori to engage in governance
processes to resolve these important issues.
Not clear whether more or less intensive
farming types to be most affected by ETS, or
how ETS will affect farming development
opportunities.
Food processing Long-term sector growth likely to be lower Māori employment, especially in meat
than in an economy without emissions processing, may be disproportionately
charges. negatively affected.
Fishing Fishing and processing costs to rise, though Māori employment, especially in processing,
perhaps to lesser degree for deepwater may be disproportionately negatively affected.
fishing than for inshore fishing.
Fish processing unlikely to qualify for free
Quota and fishing company values may fall to NZUs to mitigate impacts of higher electricity
some degree as a consequence, relative to costs on processing competitiveness.
an economy with no emissions charges.
Geothermal Electricity generators likely to enjoy windfall Māori non-electricity geothermal energy users
increase in profits due to higher electricity unlikely to qualify for free NZUs to mitigate
prices. impact of emissions charges on asset values.
Non-electricity geothermal energy users to
face higher costs.
6 Māori Impacts from the Emissions Trading SchemeSector Key impacts Key issues
Households Lower-income Māori households to face Relatively low Māori home ownership rates
greater impact of higher electricity prices than mean Māori less able to take advantage of
similar non-Māori households. support measures to improve home energy
efficiency.
Higher-income Māori households to face
greater impact of higher transport fuel prices Measures to reduce impact of higher
than similar non-Māori households. electricity prices on low- to middle-income
families may need more refined targeting.
Māori Impacts from the Emissions Trading Scheme 72 Māori Contribution to New
Zealand Greenhouse Gas
Emissions
In considering whether Māori bear a proportionate or disproportionate share of greenhouse gas
mitigation costs under the ETS, it is relevant to enquire as to the relative contribution of Māori
to New Zealand’s greenhouse gas emissions. To compare Māori and non-Māori emissions it is
necessary to consider both emissions from consumption, as well as from Māori productive
activities (such as deforestation of pre-1990 forests). Furthermore, it is necessary to consider
not just direct emissions by Māori (eg, through electricity and liquid fuel consumption), but also
indirect emissions. These indirect emissions may arise, for example, through the consumption
of goods and services which require electricity and liquid fuels for their manufacture or supply.
Using 2004 household expenditure data from Statistics New Zealand, the total expenditure by
Māori households is 14 per cent of total household expenditure. Given Māori constitute 15 per
cent of the New Zealand population this suggests Māori contribute marginally less to New
Zealand’s total greenhouse gas emissions measured in consumption terms than non-Māori, all
other things being equal, but not significantly so. However, further data presented in Sections 5
and 6 on Māori household electricity and motor fuel consumption suggest that certain Māori
sub-groups have relatively high direct emissions from these sources, so the use of overall
consumption figures may not be an accurate guide as to relative Māori emissions.
In production terms, analysis by NZIER suggests the “Māori economy” constitutes only 1.4 per
cent of total economic value added in New Zealand, 4 which likely reflects a relatively low
proportion of the New Zealand productive sector owned by Māori (eg, only 6 per cent of all
land in New Zealand is Māori land). The distribution of Māori value added is relatively uneven,
however, with Māori value added estimated to constitute 37.1 per cent of total fishing value
added, 7.5 per cent of agriculture value added, 2.0 per cent of forestry value added, and lower
proportions of total value added in other sectors. Assuming these economic value added
statistics correlate with emissions, on a per capita basis Māori contribute a greater share of
fishing-sector related emissions than non-Māori, all other things being equal. However, for all
other sectors, including forestry, Māori contribute less per capita to New Zealand’s total
greenhouse gas emissions than non-Māori, all other things being equal.
4
NZIER, 2003, Māori Economic Development: Te Ohanga Whanaketanga Māori, p.9.
8 Māori Impacts from the Emissions Trading SchemeConversely, Māori emissions based on land use and land-use change data may be relatively high
compared with non-Māori. Data presented in Section 3 suggests there is a relatively high
proportion of Māori land in more emissions-intensive activities such as beef farming, as well as
relatively low Māori interests in lower-emitting sheep farming, compared with the proportion of
non-Māori land in each such activity. While Māori have relatively high interests in pre-1990
forestry (both indigenous and exotic), there is evidence to suggest that the greater part of
emissions relating to deforestation (ie, changing land use out of pre-1990 forestry) comes from
non-Māori sources. 5 Also, while Māori interests in high-emitting dairy farming, and lower-
emitting mixed sheep and beef farming, are relatively comparable to those of non-Māori,
evidence exists for more conservative stocking policies on Māori farms and greater Māori
farming of under-developed or marginal land as compared with non-Māori farms. Given the
significance of mixed sheep and beef farming for total land use, relatively lower Māori
emissions for these farm types may mitigate any greater emissions from other sources, hence the
net relative contribution of Māori to emissions from land use and land-use change is unclear.
Taking these crude approaches into account, there may be reason to speculate that Māori
contribute less to New Zealand’s total greenhouse gas emissions per capita than non-Māori, and
hence could expect to shoulder only a commensurate burden of greenhouse gas mitigation costs.
However, without more reliable data it is not possible to state any definitive conclusion. While
in principle the ETS should only charge Māori for the emissions they actually make, practical
arrangements could hinder or help Māori groups or individuals relative to non-Māori to access
opportunities or mitigate costs from the ETS, thus creating distributional inequalities.
5
Smith B, Horgan G, 2006, Area of Forest ‘at Risk’ from Deforestation, August, www.maf.govt.nz.
Māori Impacts from the Emissions Trading Scheme 93 Māori Economic and
Socioeconomic Position
3.1 Overview of the Māori economy
The most-commonly cited estimate of the Māori asset base and the Māori contribution to New
Zealand’s economy is that provided by NZIER in its 2003 publication Māori Economic
Development: Te Ohanga Whanaketanga Māori. 6 This publication suggests the following:
a) Primary industries (including agriculture, forestry, fishing and mining) accounted for 50
per cent of Māori commercial assets, as compares with 11 per cent of assets of the New
Zealand business sector overall.
b) Only 10 per cent of Māori commercial assets are in secondary industries such as
manufacturing and construction, with the remaining 40 per cent of Māori assets being
involved in tertiary industries.
c) Māori control up to 37 per cent of the domestic fishing quota in New Zealand, making
them a disproportionate participant in this sector per capita.
d) Agriculture, fishing and home ownership account for 75 per cent of the output of the
Māori economy.
e) Māori control around 10 per cent of New Zealand land involved in forestry, but this often
arises through forestry rights owned by third parties.
The Māori primary sector asset base is weighted towards Bay of Plenty, Waikato and
Northland, and also Nelson (presumably Sealord). 7 In terms of total assets by region (ie,
including secondary and tertiary industry assets), 48 per cent of the Māori asset base is located
in Auckland, Waikato and Bay of Plenty. 8 However, as mentioned in Section 1, most of the
Māori land base outside of the main urban centres is located in six key regions, namely
Waikato, Hawke’s Bay, Gisborne, Manawatu-Wanganui, Bay of Plenty and Northland. In
terms of Māori employment the key agriculture, forestry and fishing sectors, as well as
processing in each such sector, are of obvious importance in terms of possible ETS impacts.
6
Updated figures on the size of the Māori economy are provided in Te Puni Kokiri, 2007, Nga Kaihanga
Hou: For Māori Future Makers, October. However, these updated figures do not provide the same degree
of detail as NZIER (2003), hence this report continues to cite the earlier figures.
7
NZIER, 2005, Māori Business and Economic Performance: A Summary Report, September, p.4.
8
NZIER (2005), p.6.
10 Māori Impacts from the Emissions Trading Scheme3.2 Māori land-based activities
We turn now to describing the Māori interest in agriculture and forestry in greater detail. Using
indicative data drawn from the Māori Land Information Base, as summarised in the 2006
Ministry of Agriculture and Forestry publication Māori Land Analysis Version 1.1: Results by
Region, Figure 3.1 summarises the relative proportion of Māori and non-Māori land represented
by each of 14 farm types at a national level. These 14 farm types account for 95 per cent of all
land recorded in the Māori Land Information Base as summarised by Ministry of Agriculture
and Forestry.
From this figure it is evident that sheep and beef farming constitutes the largest use of Māori
land, with forestry (both exotic and indigenous, and both pre-1990 and post-1989), and beef
cattle farming, the next most significant land uses. While sheep and beef farming constitutes
only a marginally higher fraction of Māori land use than for non-Māori, the Māori proportions
for beef cattle farming and forestry are markedly higher.
Figure 3.1: Proportion of Māori and non-Māori land in main farm types (by area)
Percentage of land
35 33.0
Māori
30.4
Non-Māori
30
25 23.2
20 18.2
17.4
15
11.0
10 8.9 8.4
8.0
7.2 7.3
5.2 5.8
5 4.1
2.9
2.2
0.6 0.8 0.7 0.7 0.9 0.8 1.2
0.2 0.2 0.4 0.0 0.1
0
Viticulture, grape growing
Fruitgrowing
Dairy dry stock
Forestry
Native bush
or seed production
people's stock
Dairy cattle farming
Other farm types
Sheep farming
Beef cattle farming
and beef farming
Not farmed (ie, idle land
Tourism
Grazing other
Arable cropping
Mixed sheep
or non-farm use)
and wine
Figure 3.1 suggests a much higher proportion of non-Māori land being in native bush than for
Māori, but this figure includes conservation estate managed by Department of Conservation, so
the non-Māori proportion is biased upwards accordingly. The higher non-Māori proportion in
sheep farming is likely explained by sheep farming in the South Island High Country. Given
evidence of more conservative stocking policies on Māori-owned farms, these area-based
comparisons may overstate the intensity of Māori farming relative to non-Māori farming for like
farm types. 9
9
Eg, see Ussher, G., 2002, A Comparative Study of the Physical and Financial Performance of Māori owned
and European owned Farm and Horticultural Businesses in Northland, www.maf.govt.nz
Māori Impacts from the Emissions Trading Scheme 11Interestingly, according to this database a greater share of Māori land is committed to dairy
cattle farming, although this constitutes the fourth largest use of Māori land behind sheep and
beef farming, forestry, and beef cattle farming. These four farm types account for some 77 per
cent of all Māori land, but only 53 per cent of non-Māori land (although this figure is biased
downwards by the inclusion of Department of Conservation land).
To delve behind the national figures, Table 3.1 disaggregates Māori interests in the main land-
use types for the six most significant regions in terms of Māori land areas. As can be seen, the
Waikato (which also takes in the Central North Island and Taupo areas) ranks consistently high
in terms of total Māori land interests across the major land uses.
Table 3.1: Most significant regions by area in which Māori have interest in major land
uses
Land use Area of Māori land involved Most significant regions by area of Māori land in that land
in main land-use types use
Sheep and 218,612 ha Gisborne (almost 70,000 ha)
beef
Waikato (almost 50,000 ha)
Manawatu-Wanganui (40,000 ha)
Hawke’s Bay (30,000 ha)
Northland (10,000 ha)
Forestry* 120,253 ha Waikato (50,000+ ha)
Hawke’s Bay (20,000+ ha)
Gisborne, Bay of Plenty, Northland, Manawatu-Wanganui
(10,000 ha each)
Beef 115,067 ha Waikato (almost 30,000 ha)
Hawke’s Bay, Northland (20,000 ha each)
Bay of Plenty, Gisborne (15,000+ ha each)
Dairy 58,824 ha Waikato (20,000+ ha)
Bay of Plenty (almost 15,000 ha)
Northland (almost 10,000 ha)
Taranaki, Gisborne, Manawatu-Wanganui (almost 5,000 ha
each)
Tourism 14,727 ha Hawke’s Bay (almost 14,000 ha)
Grazing other 5,961 ha Northland (almost 2,000 ha)
peoples’ stock
Waikato (1,500 ha)
Bay of Plenty (1,000 ha)
Manawatu-Wanganui, Taranaki (almost 500 ha each)
Dry stock 4,704 ha Waikato (3,000 ha)
grazing
Fruit growing 1,476 ha Bay of Plenty (almost 1,200 ha)
Hawke’s Bay, Gisborne (almost 200 ha each)
* Māori forestry interest understated as a proportion of Māori land.
12 Māori Impacts from the Emissions Trading SchemeData from Ministry of Agriculture and Forestry on Māori exotic and indigenous forestry
interests as at 2001 is summarised in Tables 3.2 and 3.3. 10 This data underestimates the Māori
forestry interest substantially, not least because the Māori Land Information Base does not
classify general land owned by Māori for forestry as Māori forestry land. For example, not
reflected in the Māori Land Information Base figures is the fact that Māori own almost 97,000
hectares of formerly Crown-owned Crown Forestry Licensed lands as a consequence of settled
Treaty claims. Furthermore, the Māori Land Information Base data is quite dated – due to
increased deforestation since 2005, as well as low new planting rates, it may not provide an
accurate assessment of the current position.
With these caveats in mind, note that 31 per cent of the total exotic forest estate is located in the
Central North Island. Note also that around 680,000 hectares of new exotic forests, or 38 per
cent of the exotic estate, are estimated to have been planted from 1990 to 2006. This suggests
62 per cent of the exotic estate, or 1.12 m hectares, is in pre-1990 forestry. The vast majority of
the private indigenous estate is likely to be in pre-1990 forests.
Table 3.2: Māori and non-Māori exotic forestry interests as at 2001
Māori Non-Māori Total
North Island 117,062 1,142,938 1,260,000 70%
South Island 3,468 536,532 540,000 30%
New Zealand 120,530 1,679,470 1,800,000
7% 93%
Table 3.3: Māori and non-Māori private indigenous forestry interests as at 2001
Māori Non-Māori Total
North Island 265,900 778,420 1,044,320 73%
South Island 21,621 360,261 381,882 27%
New Zealand 287,521 1,138,681 1,426,202
20% 80%
10
Ministry of Agriculture and Forestry personal communication, plus 2006 National Exotic Forest
Description. Note that widely divergent indigenous forestry figures are available from alternative sources.
For example, see Hammond D, 2001, Development of Māori Owned Indigenous Forests, and Griffiths A,
2002, Indigenous Forestry on Private Land: Present Trends and Future Potential.
Māori Impacts from the Emissions Trading Scheme 133.3 Issues with the ownership and use of Māori
land
Māori land ownership differs in a number of important ways when compared with non-Māori
land ownership. Notably, the Māori Land Act 1993, or Te Ture Whenua Māori 1993, defines
different classes of Māori land, and provides for a range of governance entities and processes
for controlling the use and retention of Māori land. These governance entities include the
commonly-used Ahu Whenua Trusts (covering 50 per cent of Māori land area), as well as
incorporations (covering a further 13 per cent of Māori land area). The processes for controlling
the use and retention of Māori land include requirements for consensus-based rather than
simple-majority based asset management decision-making, as well as the capacity of the Māori
Land Court to intervene in asset management decisions made by Māori asset-owning trusts and
incorporations.
This capacity derives from the distinctive provision in Te Ture Whenua Māori for the retention
of Māori land assets by such bodies, as provided by the Act’s strong restrictions on the
“alienation” of Māori land. Alienation relates not just to the outright sale of such land, but also
to the granting of leases over that land, and the granting of mortgages for raising debt capital,
among other things. A consequence of these strong restrictions is that Māori land-owning
bodies constituted under Te Ture Whenua Māori typically face considerable difficulty in raising
external capital, and it is extremely difficult (ie, prohibitively costly or otherwise impossible) to
rationalise the ownership of Māori land assets.
The difficulty in raising capital is made worse by the fact that much of the land such bodies own
is often of low productive potential and hence security value, is small and often poorly located,
is not surveyed (and hence titled), and has a relatively large number of owners (increasing over
time as succession rules pass ownership to each new generation). It is also made worse by
lenders’ reluctance to lend to such bodies for fear of being unable to realise asset value in the
event their loans go bad, and negative publicity potential where Māori ancestral land is forcibly
sold to repay debts. The capacity of the Māori Land Court to intervene in land management
decisions where the retention of Māori land is at risk raises additional complications and risks
for would-be lenders.
As to the nature of Māori land itself, until recently more than half of Māori land blocks were
thought to be unsurveyed and hence untitled (the Māori Land Court advises that the figure now
stands at 21 per cent). Māori land blocks are typically small (average of 57 hectares, with 68
per cent less than 10 hectares in size), are non-contiguous (hence harder to rationalise), have
multiple owners (average of 80 per block), and a third are landlocked. Furthermore, over 60 per
cent of such blocks have no management structure, and 81 per cent of Māori land is non-arable
(compared with 71 per cent of all land nationally). The 2.3 million ownership interests in Māori
land compare with the total number of interests represented by the other 94 per cent of land in
New Zealand. The implied cross-ownership interests in different Māori land-owning bodies
means for many Māori landowners their share of returns from a given land block constitutes a
negligible part of their overall income, meaning they have little incentive to invest much in the
governance and management of such blocks. 11
11
Figures from Hui Taumata Māori Land Tenure Review Group Discussion Paper, 23 June 2006, and Māori
Land Court personal communication.
14 Māori Impacts from the Emissions Trading SchemeGiven both the institutional peculiarities of Māori land ownership, and the specific
characteristics of Māori land, much Māori land is undeveloped or relatively under-developed. 12
Indeed, as two commentators put it:
“Much Māori land is currently locked out of development although it can be adjacent to
highly productive land and located in a market driven economic environment”. 13
“... Māori land may suffer from fragmentation of development effort, increased transaction
costs and slower development timeframes. The more complicated ownership structure and
possible non-economic drivers for development that differentiate the development process
for Māori land from general land must be recognised as they are central to an
understanding of wider land development issues.” 14
Such factors serve to limit the economic use and ownership rationalisation of Māori land, and
may impede the ability of Māori landowners to take advantage of opportunities under the ETS
and complementary measures (eg, the Permanent Forest Sinks Initiative). On the other hand,
between 40,000–50,000 hectares of marginal Māori land is in pasture, and could be suitable for
reforestation or scrub regeneration such as that envisaged under the ETS in respect of post-1989
forests. Much of this land is located in the Gisborne/East Coast and Northland regions. 15
These factors also serve to affect the value and riskiness of Māori land assets. The alienation
restrictions imposed on Māori land under Te Ture Whenua Māori amount to what in economic
terms are called “liquidity constraints”. Such constraints are commonly found in both
theoretical and empirical studies to impose considerable value discounts relative to comparable
assets without such constraints. 16 This means that Māori land subject to alienation restrictions
should be worth less than comparable land not subject to those constraints. Moreover, a
predicted consequence of the asset illiquidity imposed on Māori land by Te Ture Whenua Māori
restrictions is to make the holding of other, non-constrained assets less risky. 17 Hence, Māori
land should be worth less than otherwise comparable non-Māori land, and ironically other land
should be a less risky investment for its owners by virtue of the Te Ture Whenua Māori
constraints.
12
There is also evidence of Māori-owned farms operating at lower profitability than non-Māori owned farms
in the same region, with more conservative stocking policies on Māori-owned farms, land limitations and
capital constraints offered as partial explanations. See for example, Ussher G, 2002, A Comparative Study
of the Physical and Financial Performance of Māori owned and European owned Farm and Horticultural
Businesses in Northland, www.maf.govt.nz; Livingston P, undated, Farm Performance Variations, research
prepared for Ministry of Agriculture and Forestry by AgFirst Consultants, www.maf.govt.nz; and Hayes,
1999, An In-depth Comparison of the Financial and Physical Performance of Farms in the Gisborne-
Wairoa District, cited in NZIER 2002, Natural Resource Policy and Māori Economic Development, Report
to Te Puni Kokiri, September.
13
Robertson B, 2004, Māori Land Tenure: Issues and Opportunities, paper prepared for the New Zealand
Institute of Surveyors Annual Conference, Auckland, October, p.6.
14
Land Information New Zealand, 2004, National Māori Land Information Project: Final Report, p.5.
15
Harmsworth G, 2003, Māori Perspectives on Kyoto Policy: Interim Results, and Harmsworth G, 2004,
Māori and Climate Change: Carbon Sequestration Opportunities on Māori Land.
16
For example, see Silber W, 1991, “Discounts on Restricted Stock: The Impact of Illiquidity on Stock
Prices”, Financial Analysts Journal, 47(4), July/August, 60–64.
17
Longstaff F, 2005, Asset Pricing in Markets with Illiquid Assets.
Māori Impacts from the Emissions Trading Scheme 15Based on such theory and evidence it might be inferred that any adverse value impacts of the
ETS on Māori land should be less than that on non-Māori land. However, while Māori land
should be worth less than otherwise comparable non-Māori land, it cannot be immediately
deduced that any loss of conversion potential on non-Māori land is also relatively less than for
non-Māori land. This is because the potential conversion value on Māori land may be high
relative to that for comparable non-Māori land, for example due to relative under-development
(whether due to financing constraints, institutional restrictions on land ownership, or otherwise).
Hence, any further constraints on Māori land development as a consequence of the ETS could in
fact result in even higher proportionate value losses for Māori land than non-Māori land.
3.4 Māori socioeconomic position
The socioeconomic position of Māori relative to non-Māori can be measured using various
combinations of indicators. 18 Among these indicators include:
a) a similar urban/rural split to the European population
b) a lower life expectancy than non-Māori
c) the highest unemployment rate of all ethnic groups, and lower employment rate and
median hourly earnings than for European New Zealanders
d) a high proportion of Māori are on low incomes (although this may reflect a younger age
distribution), and Māori have much lower net worth than European New Zealanders
e) a high incidence of household overcrowding, and relatively low home ownership rates.
18
For example, see The Social Report 2006: Indicators of Social Wellbeing in New Zealand, Ministry of
Social Development.
16 Māori Impacts from the Emissions Trading Scheme4 Likely High-Level Generic
Impacts of the ETS
4.1 Electricity and liquid fuel prices
The ETS will lead to increased electricity and liquid fuel (ie, petrol and diesel) prices. At the
indicative levels of carbon prices used in official publications (ie, $15/tonne and $25/tonne), the
price increases are relatively small (ie, 1–2 cents per kWh (or 5–10 per cent) for electricity, and
3.7–6.1 cents per litre (or 2.5–4 per cent) for petrol), 19 especially when compared with historical
price changes in such energy costs.
In fact the ETS will also lead to increased gas prices, and to secondary increases in prices of
goods and services for which electricity, liquid fuel and gas prices are input costs (eg, food
products via higher processing and transportation costs). Whether the price impact of the ETS
is relatively high or low will depend on the level of international carbon prices once the relevant
sectors are introduced into the scheme. Whether the ETS leads to “one-off” or successive
increases in such prices will hinge on the future course of such international carbon prices.
Global carbon prices will evolve according to the demand for carbon credits to offset emissions
liabilities (which relates in part to the evolution of the Kyoto Protocol itself, particularly beyond
2008–2012, as well as global economic growth), and the development of technologies to reduce
emissions (eg, carbon capture and storage).
Higher transportation costs can be predicted to fall relatively more heavily on rural
communities, given the greater travelling distances they face, although numerically their burden
will be less than that for non-rural communities. The burden of higher electricity prices can be
predicted to fall more heavily in those parts of the country that are relatively cold, such as in the
deep south of the South Island, where energy demands for heating are higher (and where Māori
populations are relatively low).
These increased costs will fall at both the consumer and producer levels. Households will face
higher energy costs, although the Government has signalled that support for low- and middle-
income families will be made available to mitigate the impacts of the ETS on electricity prices.
Higher liquid fuel costs will particularly affect industries with high transport cost components,
such as forestry and, especially, fishing. In the case of fishing, there may be different impacts
on inshore and deep-sea fishing, with deep-sea vessels potentially able to skirt around the ETS
by sourcing fuel from countries not imposing emissions charges on fuels. Higher electricity
costs will affect industries reliant on electricity for energy-intensive processing, such as wood,
pulp and paper, meat and dairy processing, and also sectors reliant on refrigeration and cool-
stores (eg, horticulture). The Government has signalled possible relief measures for industries
that are exposed to international trade, that have significant work forces at risk, and/or which
have the potential to relocate to countries that lack greenhouse gas emission pricing.
19
Table 7.2, The Framework for a New Zealand Emissions Trading Scheme, p.111.
Māori Impacts from the Emissions Trading Scheme 174.2 Pre-1990 forests
Devolving deforestation liabilities to owners of pre-1990 forests should encourage the retention
of a greater proportion of such forests in forestry, rather than see them converted into non-
forestry uses, all other things being equal. This should result in a net negative impact on pre-
1990 forest land values relative to no emissions pricing, since it will reduce the opportunities
faced by some pre-1990 forest owners to convert their land into higher and better uses, at the
margin. For example, economic modelling analysis commissioned by the Federation of Māori
Authorities suggests that, at an initial carbon price of $15/tonne and initial milk-solids price of
$4.42/kg, pre-1990 forest value as at June 2005 would be 13 per cent less with deforestation
liabilities devolved to landowners (without any free emissions right allocations) than if they
were retained by the Government. 20 This value loss arose from reduced dairy conversion
options. At an initial carbon price of $25/tonne ($43/tonne) the corresponding value loss was
estimated to be 19 per cent (47 per cent) relative to government retention of deforestation
liabilities. If landowners were assumed to be unable to take advantage of free pre-2008
deforestation – whether due to institutional constraints on land-use changes or otherwise – the
value loss rose to 18 per cent. This figure rose to 26 per cent if only post-2012 deforestation
was assumed possible.
This negative forest value impact will be small or even non-existent, however, where pre-1990
forest lands currently lack higher or better alternative uses (given current land-use
technologies), and/or with free NZU allocations to forest landowners. It will also be small
where forest landowners face other constraints on changing land use. These might include
replanting requirements under the Resource Management Act, or other land-use restrictions
such as those emerging in some parts of the country to manage the nitrification of waterways, or
Department of Conservation opposition to native scrub clearance.
Where pre-1990 forests have essentially no alternative use in the foreseeable future, such as
might be the case with many indigenous forests (if pre-1990 indigenous forestry is to be
included in the ETS) or forestry on extremely marginal land, the ETS’s impact may be
inconsequential. In fact, if the owners of such lands receive a free allocation of NZUs under the
proposed ETS, this could result in an initial windfall gain, which could be important to Māori
who are large stakeholders in this estate. This is because those NZUs can be traded now for
value that was not otherwise attainable, although at the expense of possible future development
options. Importantly, the extent of any such gain will depend on the type of allocation
mechanism, which initially at least will be based on simple forest land area, favouring lower-
valued forests over higher-valued ones.
Another important, related consideration is the extent to which owners of pre-1990 forests are
able to apply for exemptions under the proposed ETS. Notable among these is the provision for
owners of forest blocks of up to 50 hectares to apply for exemption from deforestation
liabilities. This exemption, however, is not available to owners of related bodies which in
aggregate hold more than 50 hectares of pre-1990 forests.
20
Meade R, 2006, Relative Forest Valuation with the Retention and Devolution of Carbon Credits and
Harvest Liabilities under the Kyoto Protocol: Representative Non-Kyoto Forest, report prepared by
Cognitus Advisory Services Limited for the Federation of Māori Authorities. Results cited with
permission. The analysis assumed log, carbon and milk-solids prices evolved according to mean-reverting
stochastic processes. At higher initial milk-solids prices the loss in land value due to deforestation
liabilities would increase, all other things being equal.
18 Māori Impacts from the Emissions Trading SchemeYou can also read