Machine Learning Based Text Document Classification for E-Learning - IJRTE
←
→
Page content transcription
If your browser does not render page correctly, please read the page content below
International Journal of Recent Technology and Engineering (IJRTE)
ISSN: 2277-3878, Volume-8 Issue-5, January 2020
Machine Learning Based Text Document
Classification for E-Learning
Benny Thomas, Chandra J
In the current work intelligent cognitive level identifier
Abstract.: The number of e-learning websites as well as framework is proposed which classifies the e-learning content
e-contents are increasing exponentially over the years and most of based on its difficulty levels. The websites urls are used as
the time it become cumbersome for a learner to find e-content inputs to get the e-content from the web site. The framework
suitable for learning as the learner gets overwhelmed by the
enormity of the content availability. The proposed work focus on collects input data through web scraping. The web scraper
evaluating the efficiencies of the different classification algorithm downloads the web pages and parse to text file. The text files
for the identification of the e-learning content based on difficulty were made to run through many machine learning
levels. The data is collected from many e-learning web sites classification algorithms to find out the best classification
through web scraping. The web scraper downloads the web pages model suitable for achieving the highest score with minimum
and parse to text file. The text files were made to run through
training and testing time.
many machine learning classification algorithms to find out the
best classification model suitable for achieving the highest score The remaining part of the paper is organized as follows,
with minimum training and testing time. This method helps to Section II. Literature review of the existing work in e-learning
understand the performance of different text classification classification, Section III.Methodology of the proposed work
algorithms on e-learning contents and identifies the classifier with with a study of different classification algorithms, Section IV.
high accuracy for document classification.
Implementation of the model V. Result and Discussions and
Keywords: E-Learning, Text Document, Difficulty levels.
Classifications. Section VI. Conclusion.
I. INTRODUCTION II. LITERATURE REVIEW
As the number of online learners increased, the online content Numerous studies have conducted to attain suitable text
availability also increased dramatically. Finding the suitable classifications and recommendation in e-learning space.
learning material become too difficult from the large Sankar Perumal et al., proposes a new method for
collection of content and the contents are so skewed that the recommendation system which provides suitable contents by
learner find it too difficult to get the suitable learning refining the final frequent item patterns evolving from
material. Different methods were used to address this issue. frequent pattern mining technique and then classifying the
One prominent method is recommended systems which helps final contents using fuzzy logic into three levels [3]. K. Tarus
to find items from a large collection of items. Recommended and Zhendong Niu conducted a study to demonstrate that
systems are used in different domains such as entertainments, ontology use for representing knowledge in e-learning
e-learning, news, e-commerce etc. G. Geetha et al., mention recommender systems can bring improvement in the quality
about different types of systems such as hybrid filtering, of recommendations. The Hybridization of recommended
content based filtering and collaborative filtering used in system can also improve the quality of recommendation[4].
Recommend systems[1]. K. I. Ghauth and N. A. Abdullah, P. G. Desai et al., proposed one of the most efficient method
uses one type of content based filtering based on already in text classification is using baysian classifiers which uses
studied learners’ rating is proposed that can bring additional statistical and supervised learning method using machine
similar learning material through content based filtering and learning algorithms. The Naïve Bayes approach is proved to
learners resource help to improve the comprehension Already the most simple and one of the most efficient method of text
studied learner’s resource is equal to collaborative filtering classification. However one of the drawback of Naiye Bayse
approach. Therefore these approach uses content, classification is that it does not consider the morphological
collaborative and hybrid filtering methods for relations of the terms used inside the text. This can be
recommendation. [2] . However the recommended system overcome by using other variants of Naïve Bayes algorithms
does not classify them based on the cognitive levels and [5]. I. Horie et al., has proposed that the cognitive level
classification of e-learning documents based on difficulty identification or difficulty level estimation of the content in
level is not addressed. text document or in a web document is a relevant research
topic today as the number of available materials increased
exponentially. A personalized learning material generator for
Revised Manuscript Received on January 15, 2020
* Correspondence Author beginner English Learner suggest a model based on the
Benny Thomas*, Department of Computer Science, Christ University, difficulty level by understanding the personalized vocabulary
Bangalore, India. of the learner and then
Chandra J, Department of Computer Science, Christ University,
Bangalore, India. recommends suitable leaning
Published By:
Retrieval Number: E5748018520/2020©BEIESP Blue Eyes Intelligence Engineering
DOI:10.35940/ijrte.E5748.018520 194 & Sciences Publication
Machine Learning Based Text Document Classification for E-Learning

material to the students. Level of difficulty was determined as
a ratio of the number of unknown words in a reading material.
                                                                                        Applying different Data mining
The vocabulary level is given to each word which is
estimated from Japanese higher general education guide [6].                              Algorithms on the data set.
Atorn Nuntiyagul et al., used patterned keywords and phrase
along with support vector machine algorithms and feature
selection technique in categorization of items of question                            Identify the Accuracy, training
stored in an item bank and correctly retrieve the same based                        time, testing time, precision, recall
on its difficulty levels [7].                                                        and the f-score of each algorithm
A. A. Yahya et.al., analyzed the cognitive levels of class
room questions based on Bloom Taxonomy levels. The
questions are automatically classified in to different difficulty
levels based on Bloom Taxonomy using Machine learning                                   Plot the graph to show the
techniques such as K-NN, Naïve Bayses and SVM classifiers                               efficiency of each algorithm
using tf as the approach for selection. The results showed that
a better performance for the SVM classifiers in terms of                       Fig 1: Workflow diagram of the framework
accuracy[8]. A. A. Yahya and A Osman constructed different                                  proposed framework
learning paths in e-leaning using Item Response Theory and          The web pages are scraped using scrappy.spider. The Spider
used Blooms Cognitive levels and support vector machine             crawls the website and downloads the content and text files
classification algorithms for question paper classification in      are extracted using the Beautifulsoup parser API and then
automatic text classifications. A set of pre-classified             stored in local system. The difficulty levels are identified for
questions are collected and SVM classifier is applied on these      the content in each of these websites and categorized in to
data set after preprocessing[9]. K. M. Yang et al., proposed        three levels namely- Beginner, Intermediate and Advanced.
constructing different learning path through e-leaning by           Data set with different sizes are created to test the accuracy of
analyzing the depth of the user’s knowledge on each of the          the classifier at varying volume of data. Text files ranging
                                                                    from 600 to 4000 are used to check the frame work with
sub topics. The students are grouped together into different
                                                                    different data size for further processing.
levels and identified the knowledge level of each student to
learn from the web[10].                                                              A. PREPROCESASING
                                                                     Pre-processing is used to reduce the complexity and increase
                   II. METHODOLOGY                                  the accuracy of the data by removing irrelevant and noisy data
                                                                    from the document.
   The most popular e-learning websites for programming             Preprocessing includes removal of unwanted date from the
languages are used for collecting e-contents after understand       documents. The words in the document will be normalized by
its difficulty level by reading through the topics. The websites    converting to any one case and all two letter words are
are categorized in to three based on the difficulty levels level    removed. The documents are converted to list of words after
of the e-content such as beginner level intermediate level and      removing new line and other metadata elements.
advanced level. The web page are collected and parsed and           In the pre-processing phase, the downloaded text files are
stored as text files in to three different folders after studying   loaded into a python programme in Jupyter Notebook.
the quality and the difficulty level of the e-learning content.     Preprocessing starts with removing unnecessary words like
The e-contents are collected from multiple e-learning               tabs, punctuations, numeric strings, and quotation marks,
websites such W3schools, geeksforgeeks, roseindia,                  single and double letter words and stop words.
javaworld, wideskills,        oracledocs,     java2s, javapoint,    The words in the document are normalized by converting to
guru99, studytonight, edureka, codeside, journeldev,                lower case and all two letter words will be removed. The
beginnerbook, tutorialpoint, tutorialride, tutorialcup,             documents are split into number of words through
java2blog, meritcampus, data-flair-training, ibm developer          tokenization and converted to list of flat array of words after
                                                                    removing new lines and other metadata elements
                                                                                   B. FEATURE EXTRACTION
                               Loading the text document            Feature extraction uses data reduction which allows the
                                     strings                        elimination of less important features. The collection of
                                                                    words obtained through tokenization is sorted to find the
                      Pre-processing and Tokenization               unique words. The unique words and the count will be stored
                                                                    separately for further processing.
                                                                    The size of the data is further reduced through the feature
                       Feature Extraction through                   selection method. Feature selection reduces the data size,
                                                                    remove redundancy and irrelevant information.
                         counting the number of
                                                                    Data reduction is applied by taking different percentage of the
                       occurrence of unique words                   total data and applied on the algorithm and check the accuracy
                    Feature Selection based on
                                                                    of the result.
                  frequency of the unique words.

                                                                          Published By:
    Retrieval Number: E5748018520/2020©BEIESP                             Blue Eyes Intelligence Engineering
    DOI:10.35940/ijrte.E5748.018520                             195       & Sciences Publication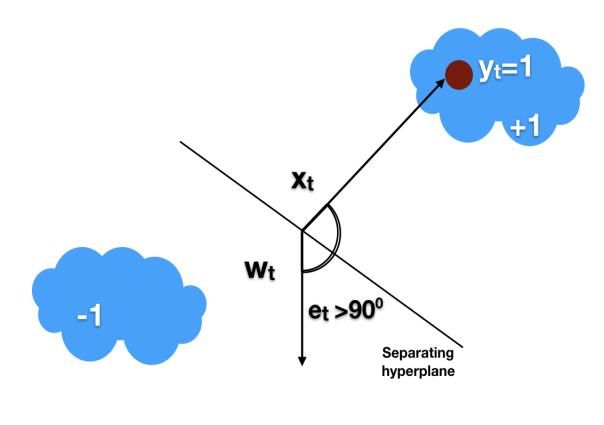
International Journal of Recent Technology and Engineering (IJRTE)
ISSN: 2277-3878, Volume-8 Issue-5, January 2020
The data is checked using N-fold cross validation and the best hyperplane. The update of the classifier follows the
accuracy is obtained when the percentage of the total constraints passive update and aggressive update.
dimension is taken between 15 to 25. The method help to The advantage is that it follows an online learning pattern and
reduce the dimensionality by 75 to 85% of the total data. update the separating hyperplane for the next example and
ensure the performance of the algorithm[13]. Because of the
C. CLASSIFICATION ALGORITHMS
theoretical loss bound, the performance of the classifier can
The classification algorithms are applied on the data after the be easily predicted.
pre-processing and dimensionality reduction. The same data
is made to run through multiple classification algorithms to
compare different classifier performance and to find out the
best classier algorithms. The algorithms are compared with
different data size, varying training and testing data size and
different dimensionality to find out the optimum performance.
Different text classification algorithms are trained with
training data set and compared the results to find out the best
classifier. The classifiers are compared using different data
size, different training and testing percentage and different
dimensionality.
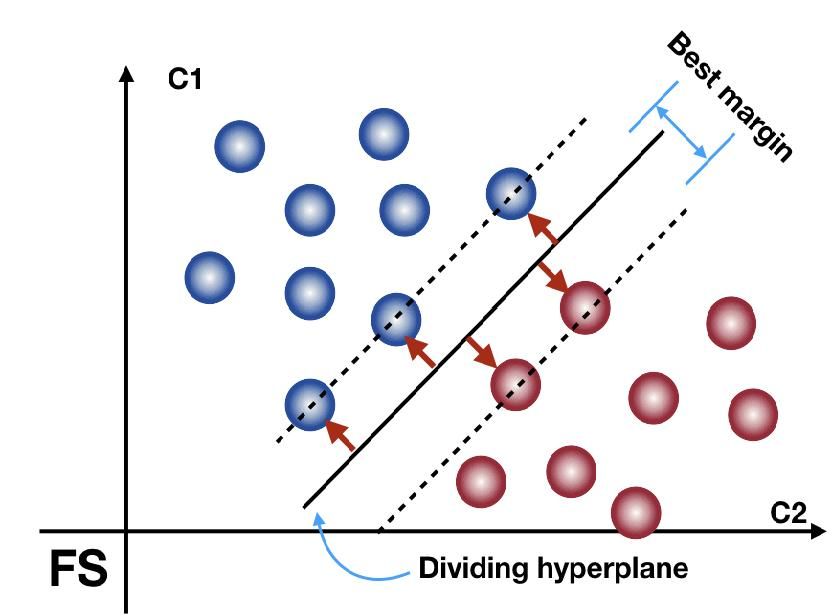
D. Linear SVC
Support Vector Machine classification implementation using Fig 3: Separating Hyperplane
a linear Kernel.is to fit to the data that is provided, returning a Figure shows that when the angle Ɵ>0 the sample is classified
best fit hyperplane that divides, or categorizes, data. From as -1 and its label is +1. In such cases the update rule is
there, after getting the hyperplane, can then feed some aggressive and looks for new weight wt for the sample xt.
features to the classifier to see what the "predicted" class. This Passive-aggressive algorithm
makes this specific algorithm rather suitable for the use, and INITIALIZE: w1 = (0 . . . 0) as parameters of the classifier
the model can be used for many situations[11]. For t = 1, 2…
Receive instance: €
Predict = sign (wt-xt)
Receive correct label yt € {-1, +1}
Suffer loss: lt=Max {0, 1- yt(wt- xt)}
Update:
1. Set Ʈt = 2 (1)
2. Update = wt +1 = wt + (2)
Where wt is the weight of the vector on round t, yt is the
signed margin on round t.
wt+1is set to be the projection of wt in the half-space of
vectors that achieve a hinge-loss of zero. The algorithm
resulted is passive as the hinge-loss is zero, that is, wt+1=wt
when ℓt=0. on those rounds when the loss is positive, the
algorithm forces aggressively wt+1 to gratify the constraint
ℓ(wt+1;(xt,yt)) =0 irrespective of the size required. Therefore
Fig 2: LinerSVC Dividing Hyperplane. the algorithm is named as Passive-Aggressive[14]
From the figur3 we can understand that the linear function in F. RIDGE CLASSIFIER.
the middle confirms the best possible separation between the Ridge Regression is a technique for analyzing multiple
two categories. regression data that suffer from multicollinearity. When
In order to predict whether a document D belong to class C if, Multicollinearity occurs, least squares estimates are unbiased,
D≥ 0. LinearSVC is good when the number of features are but their variances are large so the values may be far from the
high and the number of training examples is small[12] true value. By adding a degree of bias to the regression
estimates, ridge regression reduces the standard errors.
E. PASSIVE AGGRESSIVE CLASSIFIER Multicollinearity, or collinearity, is the existence of
near-linear relationships among
Passive-Aggressive Classifier belong to the family of online The independent variables. Multicollinearity normally occurs
learning algorithms for binary classification. It is similar to due to Data collection from narrow substance of the
support vector machine classifier and can be considered as the independent Variables, Physical constraints of the linear
online version of SVM. It finds a hyperplane to separate the model, Over-defined model. There are more variables than
instance into two halves. The margin of an example is observations or Outliers
proportional to the distance of the hyperplane. The errors in Ridge Classifier uses three phases such as Initialization
predicting examples can be corrected by using margin of the Phase, Fit Phase, and Predict
Phase.
Published By:
Retrieval Number: E5748018520/2020©BEIESP Blue Eyes Intelligence Engineering
DOI:10.35940/ijrte.E5748.018520 196 & Sciences PublicationMachine Learning Based Text Document Classification for E-Learning
Ridge regression avoids over-fitting by regularizing the returns 0. The algorithm[17] gives very stable and high
weights and keep them small, and model selection is straight reading precision and accuracy level.
forward by choosing the value of a single regression
parameter[15].
Following the usual notation, suppose our regression equation
is written in matrix form as Y=1 if (8)
(3)
Where Y is the dependent variable, X represents the
independent variables, B is the regression coefficients to be
estimated, and e represents residual errors. Y=0 if (9)
The regression coefficients are estimated using the formula
Rewriting the above
= X’
(4)
Y=1 if (10)
= X’
(5)
Y=0 if (11)
The estimator is given by,
E ( − B) = [(X'X + X'X − I ]B (6) Where Xi is the number of conditions added to the
perceptron, Wi is the weight of each of the Xi condition. Y is
The covariance matrix is given by the decision taken by the algorithm based on the condition.
V( = [(X'X + X'X [(X'X + (7) I. K-NEAREST NEIGHBORS ALGORITHEM
K-nearest Neighbors algorithm (K-NN) uses non parametric
Where k is the diagonal element of the cross correlation methods. Input is taken as the k closest training samples from
Metrix and R is a constant the feature space.
G. STOCHASTIC GRADIENT DECENT In k-NN classification, object is classified by a group division
CLASSIFIER of its neighbors, the object is assigned to a class most common
In Stochastic Gradient Descent, a few samples are selected in its k nearest neighbors (The values of k is a positive, usually
randomly instead of the whole data set for each iteration In small). If k = 1, the object is assigned to the class of single
Gradient Descent, there is a term called “batch” which nearest neighbor.
denotes the total number of samples from a dataset that is used
for calculating the gradient for each iteration.Suppose, we k-NN is a type of instance-based learning, or lazy learning[18]
where the function is only approximated locally and all
have a million samples in our dataset, so if we use a typical
computation is deferred until classification. KNN finds the
Gradient Descent optimization technique, we will have to use
most similar objects from sample group of objects.
all of the one million samples for completing one iteration
while performing the Gradient Descent, and it has to be done The algorithm usually classifies documents in the Euclidean
for every iteration until the minima is reached. Hence, it space as points. Euclidean distance is the distance between
becomes computationally very expensive to perform. This two topics in Euclidean space. The distance between two
problem is solved by Stochastic Gradient Descent. In SGD, it points in the plane with coordinates p= (a, b) and q=(x, y) can
uses only a single sample, i.e., a batch size of one, to perform be calculated as follows.
each iteration. The sample is randomly shuffled and selected
(12)
for performing the iteration
Where d is the distance between tow pints in the plane, a,b and
SGD algorithms update the weight vector dynamically. The x,y are coordinates of the two points.
algorithm[16] study the current point and thus update the
weight .SGD is useful for large application with many J. NEAREST CENTROID CLASSIFIER.
data-points and problem dimensionality. Optimal
performance on large data-point can be obtained by smaller Nearest centroid classifier is a machine learning classification
number of iterations over the training data. model that assigns the label of the class of training samples
whose centroid is closest to the observation. It is a commonly
used method for text classification because of its simplicity. It
H. PERCEPRTON
construct a prototype vector, or centroid, per class using a
training set of documents[19].
It takes an input, aggregates it (weighted sum) and returns 1
only if the aggregated sum is more than some threshold else
Published By:
Retrieval Number: E5748018520/2020©BEIESP Blue Eyes Intelligence Engineering
DOI:10.35940/ijrte.E5748.018520 197 & Sciences PublicationInternational Journal of Recent Technology and Engineering (IJRTE)
ISSN: 2277-3878, Volume-8 Issue-5, January 2020
A test document is assigned to a class that has the most similar between models is the base for achieving the high accuracy.
centroid [20].Using the cosine similarity measure, a test Random forest picks each tree to randomly sample from the
document can be classified by computing dataset with replacement, resulting in many trees. This is
known as bagging process.The random forest is a
classification algorithm consisting of many decisions
trees. It uses bagging and feature randomness when
building each individual tree to create an uncorrelated
(13) forest of trees whose prediction by group is more
Where Ci is the centroid of the ith cluster of the training data. precise than that of any individual tree.
When dimension reduction is done by the algorithm, the IV. IMPLEMENTATION
centroids of the full space become the columns ei ∈ Rp×1 of
The accuracy, training and testing time, precision, recall
the identity matrix
f-score and confusion Metrix are printed and compared with
K. BernoulliNB results of different classifiers to predict the accuracy. A Graph
is plotted to understand the performance visually. The
The absence or presence of a word in a text document as different classifiers used are RidgeClassifier, Perceptron,
feature to classify the document in this model. The words are Passive Aggressive Classifier, Neighbors Classifier,
considered as binary to indicate presence or absence of a word RandomForestClassifier, LinierSVC Classifier, SGD
in a document[21]. The model treat a document with set of Classifier, Nearest Centroid Classifier, MultinominalDB,
unique words with no relevance on the frequency of the Bernoulli and Pipeline classifier.
word. With 600 documents with 450 documents for training and 150
L. Multinomial NB Classifier for testing and a dimensionality reduction of 85% the below
If the number of documents (n) fit into k categories where k ∈ mentioned results are obtained
{c1, c2, ..., ck} the predicted class as output is c ∈ C [22]. The Table 1 Comparison of different classifiers performance
algorithm can be written as: on the dataset
P(c | d) =P(c)∏w∈d P(d | c)nwd/P(d)
Training Testing
Given class c P(w|c) is calculated as Classifier Time Time Accuracy
Ridge Classifier 1.185s 0.109s 0.847
(14)
Where nwd is devoted to the number of times word w occurs Perceptron 0.187s 0.000s 0.913
in document, and P(w|c) is the probability of observing word
Passive-Aggressive 0.109s 0.000s 0.913
w.
Random Forest Classifier. KNN 0.062s 0.265s 0.687
Random forest classifier is built with decision trees. It consist
Random Forest 0.374s 0.016s 0.987
of many individual decision trees functions as an
ensemble[23]. L2 Penalty (Linear
SVC) 0.140s 0.016s 0.9
SGD Classifier 0.187s 0.000s 0.893
L1 Penalty (Linear
SVC) 0.094s 0.000s 0.92
Elastic-net Penalty 0.998s 0.000s 0.88
Nearest-Centroid 0.000s 0.016s 0.693
MultinominelNB 0.016s 0.000s 0.887
Bernoulli NB 0.016s 0.016s 0.94
LinearSVC with
L1-based feature
selection 0.078s 0.000s 0.873
The table show the result of the classifier with dataset of 600
Fig 4: Decision trees. files and the results shows that the Random forest classifier is
Figure shows different decision trees in the random forest giving the highest performance followed by Bernoulli NB and
classifier. Each decision tree gives one output which is either LinerSVC.
positive or negative. Each tree in the model output a class
prediction and the class with the maximum votes is selected as
the model prediction. The reason that the random forest
model works so well is, a large number of relatively
uncorrelated models trees function as a group will outperform
any of the individual component models. The low relationship
Published By:
Retrieval Number: E5748018520/2020©BEIESP Blue Eyes Intelligence Engineering
DOI:10.35940/ijrte.E5748.018520 198 & Sciences PublicationMachine Learning Based Text Document Classification for E-Learning
Table 2 Comparison of different classifiers with precision,
recall and f-score. Passive-Aggressive 5.370s 0.047s 0.944
Classifier Precision Recall F1-Score KNN 1.340s 34.780s 0.696
Random forest 3.198s 0.047s 0.975
Ridge Classifier
0.88 0.86 0.85 LinearSVC-L2
2.247s 0.033s 0.94
Perceptron 0.91 0.91 0.91 penalty
Passive-Aggressive 0.91 0.91 0.91 SGDClassifier 5.037s 0.031s 0.924
LinearSVC -L1
KNN 0.8 0.69 0.69 1.871s 0.029s 0.96
penalty
Random Forest 0.99 0.99 0.99 SGDClassifier 30.679s 0.031s 0.91
Linear SVC with SGDClassifier-El
0.9 0.9 0.9 31.189s 0.031s 0.926
L2 Penalty astic-Net penalty
SGD Classifier 0.89 0.89 0.89 NearestCentroid 0.164s 0.046s 0.726
L1 Penalty (Linear
0.92 0.92 0.92 MultinomialNB 0.138s 0.045s 0.838
SVC)
Elastic-net Penalty 0.88 0.88 0.88 BernoulliNB 0.334s 0.094s 0.869
Nearest-Centroid 0.77 0.69 0.7 Pipeline 2.233s 0.000s 0.949
MultinominelNB 0.89 0.89 0.89 Table shows the comparison of different classifiers
performance on the dataset with 4000 files. The comparative
Bernoulli NB 0.94 0.94 study made the observation that the random forest classifier is
0.94
LinearSVC with considered as one of the best classifier. Other classification
L1-based feature 0.89 0.87 0.87 algorithm with good performances are LinearSVC with L1
selection Penalty. The performance of Naïve base classifiers-
The table shows the precision, re-call and f-score of different BernoulliNB and MultinominelNB reduced on large data
classifiers in the framework. Through the investigation, the size.
current work finds that the random forest classifier is giving Table 4 Comparison of different classifiers performance
the highest precision, recall and f-score followed by Bernoulli on the dataset with 4000 files
NB and Liner SVC L1 Penalty. Precisi
classifier on Recall F1-Score
RidgeClassifier 0.88 0.88 0.879
Perceptron 0.93 0.93 0.93
Passive-Aggressive 0.94 0.94 0.94
kNN 0.73 0.7 0.7
Random forest 0.97 0.97 0.97
LinearSVC-L2
0.94 0.94 0.94
penalty
SGDClassifier 0.92 0.92 0.92
LinearSVC -L1
0.96 0.96 0.96
penalty
SGDClassifier 0.91 0.91 0.91
SGDClassifier-Elast
0.93 0.93 0.93
ic-Net penalty
NearestCentroid 0.79 0.73 0.74
Fig 5: Graphical Representation of the performance of MultinomialNB 0.86 0.84 0.84
different classifiers with data set size of 600. BernoulliNB 0.9 0.87 0.87
When the data size is increased to 4000 documents the
results are obtained as below Pipeline 0.95 0.95 0.95
Table 3 Comparison of different classifiers performance The precision recall and f-score of different classification
on the dataset with 4000 files algorithms with dataset of 4000 files are shown in the table.
Training Test The Random Forest classifier is giving the best result.
Classifier Time Time Accuracy
RidgeClassifier 24.500s 0.031s 0.881
Perceptron 2.482s 0.031s 0.928
Published By:
Retrieval Number: E5748018520/2020©BEIESP Blue Eyes Intelligence Engineering
DOI:10.35940/ijrte.E5748.018520 199 & Sciences PublicationInternational Journal of Recent Technology and Engineering (IJRTE)
ISSN: 2277-3878, Volume-8 Issue-5, January 2020
different classification algorithms, it is found that the Random
Forest classifier is giving the best performance and can be
used to develop the model frame work for e-leaning content
classification.
REFERENCES
1. G. Geetha, M. Safa, C. Fancy, and D. Saranya, “A Hybrid Approach
using Collaborative filtering and Content based Filtering for
Recommender System,” J. Phys. Conf. Ser., vol. 1000, no. 1, 2018.
2. K. I. Ghauth and N. A. Abdullah, “Learning materials recommendation
using good learners’ ratings and content-based filtering,” Educ.
Technol. Res. Dev., vol. 58, no. 6, pp. 711–727, 2010.
3. S. Pariserum Perumal, G. Sannasi, and K. Arputharaj, “An intelligent
fuzzy rule-based e-learning recommendation system for dynamic user
interests,” J. Supercomput., no. 0123456789, 2019.
4. J. K. Tarus, Z. Niu, and G. Mustafa, “Knowledge-based
recommendation: a review of ontology-based recommender systems for
e-learning,” Artif. Intell. Rev., vol. 50, no. 1, pp. 21–48, 2018.
5. M. K. M, S. D. H, P. G. Desai, and N. Chiplunkar, “Text Mining
Approach to Classify Technical Research Documents using Naïve
Bayes,” vol. 4, no. 7, pp. 386–391, 2015.
6. I. Horie, K. Yamaguchi, K. Kashiwabara, and Y. Matsuda,
“Improvement of difficulty estimation of personalized teaching material
generator by JACET,” ITHET 2014 - 13th Int. Conf. Inf. Technol. Based
High. Educ. Train., 2014.
7. A. Nuntiyagul, K. Naruedomkul, N. Cercone, and D. Wongsawang,
“Adaptable learning assistant for item bank management,” Comput.
Educ., vol. 50, no. 1, pp. 357–370, 2008.
8. A. A. Yahya, A. Osman, A. Taleb, and A. A. Alattab, “Analyzing the
Cognitive Level of Classroom Questions Using Machine Learning
Techniques,” Procedia - Soc. Behav. Sci., vol. 97, pp. 587–595, 2013.
9. A. A. Yahya and A. Osman, “Automatic Classification of Questions Into
Bloom’s Cognitive Levels Using Support Vector Machine,” Proc. Int.
Fig 6: Graphical Representation of the performance of Arab Conf. Inf. Technol., no. December 2011, pp. 1–6, 2011.
different classifiers with data set (sample size of 600) 10. K. M. Yang, R. J. Ross, and S. B. Kim, “Constructing different learning
It is observed that the random forest classifier is giving the paths through e-learning,” Int. Conf. Inf. Technol. Coding Comput.
ITCC, vol. 1, pp. 447–452, 2005.
highest precision, recall and f-score followed by and Liner
11. F. Amato et al., “Challenge: Processing web texts for classifying job
SVC L1 Penalty. The precision recall and f1-score of offers,” Proc. 2015 IEEE 9th Int. Conf. Semant. Comput. IEEE ICSC
BernoulliNB and MultinominelNB are considerably reduced 2015, pp. 460–463, 2015.
on large data size whereas the execution time on training and 12. S. Z. Mishu and S. M. Rafiuddin, “Performance analysis of supervised
machine learning algorithms for text classification,” 19th Int. Conf.
testing remains low.
Comput. Inf. Technol. ICCIT 2016, pp. 409–413, 2017.
13. H. C. et al., “Comparative Experiments on Sentiment Classification for
V. RESULT AND DISCUSSION Online Product Reviews,” issue Circ., vol. 115, pp. 1306–1324, 2007.
14. Koby Crammer∗ Ofer, J. Keshet, and S. S.-S. Y. Singer†, “Engineering
There are many classification algorithms available for support for the spine with spondylolisthesis treatment,” Online Passiv.
classifying unstructured text document. In this work different Algorithms Koby, vol. 7, pp. 349–354, 2014.
classifiers are experimentally evaluated with diffret datasets. 15. A. Singh, B. S. Prakash, and K. Chandrasekaran, “A comparison of
linear discriminant analysis and ridge classifier on Twitter data,”
Through the experimental evaluation, it is observed that the Proceeding - IEEE Int. Conf. Comput. Commun. Autom. ICCCA 2016,
RandomForsetClassifer is giving the highest performance pp. 133–138, 2017.
followed by LinaerSVC and Passive aggressive classifier. 16. T. Zhang, “Solving large scale linear prediction problems using
The naïve base variant BernoulliNB and MultinominelNB are stochastic gradient descent algorithms,” Proceedings, Twenty-First Int.
Conf. Mach. Learn. ICML 2004, pp. 919–926, 2004.
giving good results at small data sets. The performance 17. S. J. Sohrawardi, I. Azam, and S. Hosain, “A comparative study of text
decreases with large data set. The RandomForset Classifier is classification algorithms on user submitted bug reports,” 2014 9th Int.
selected as the best classifier to develop the model to identify Conf. Digit. Inf. Manag. ICDIM 2014, no. May, pp. 242–247, 2014.
the cognitive level of e-learning contents stored in multiple 18. B. Trstenjak, S. Mikac, and D. Donko, “KNN with TF-IDF based
framework for text categorization,” Procedia Eng., vol. 69, pp.
web sites. 1356–1364, 2014.
19. S. Tan, “An improved centroid classifier for text categorization,” Expert
VI. CONCLUSION Syst. Appl., vol. 35, no. 1–2, pp. 279–285, 2008.
20. H. Kim, P. Rowland, and H. Park, “Dimension reduction in text
As the number of e-learning websites proliferated, it become classification with support vector machines,” J. Mach. Learn. Res., vol.
too difficult for a learner to choose the correct learning 6, pp. 37–53, 2005.
content from large collection of web sites. There should be a 21. C. C. Aggarwal and C. X. Zhai, “A survey of text classification
algorithms,” Min. Text Data, vol. 9781461432, pp. 163–222, 2012.
mechanism to find out the difficulty level of the content to 22. K. Kowsari, K. J. Meimandi, M. Heidarysafa, S. Mendu, L. Barnes, and
recommend the best e-learning content to a learner based on D. Brown, “Text classification algorithms: A survey,” Inf., vol. 10, no. 4,
the knowledge level of the learner. Machine learning pp. 1–68, 2019.
classification algorithms can be used for developing a model
to classify e-learning content based on its difficulty levels.
Through the experimental evaluation and comparison of
Published By:
Retrieval Number: E5748018520/2020©BEIESP Blue Eyes Intelligence Engineering
DOI:10.35940/ijrte.E5748.018520 200 & Sciences PublicationMachine Learning Based Text Document Classification for E-Learning
23. Q. Wu, Y. Ye, H. Zhang, M. K. Ng, and S. S. Ho, “ForesTexter: An
efficient random forest algorithm for imbalanced text categorization,”
Knowledge-Based Syst., vol. 67, pp. 105–116, 2014.
AUTHORS PROFILE
Mr. Benny Thomas is a research scholar
from the Christ (Deemed to be University)
Bangalore. He has completed his MPhil in
Computer science from Madurai Kamaraj
University. He got extensive work
experience in industry, as a software
developer and trainer. Currently working as
assistant professor in the department of
computer science, Christ (deemed to be University.) His research interests
include Data mining, Big Data Analytics and Deep Learning.
Dr. CHANDRA. J is an Associate Professor
in Computer Science Department; CHRIST
(Deemed to be University) holds a Masters in
Computer Applications from Bharathidasan
University. PhD from Hindustan University.
Her research interests include Artificial
Neural Network, Data Mining, and Genetic
algorithm, Big data analytics, Genomics,
Deep learning, Convolutional Neural Networks Predictive analytics and
Medical Image Processing.
.
Published By:
Retrieval Number: E5748018520/2020©BEIESP Blue Eyes Intelligence Engineering
DOI:10.35940/ijrte.E5748.018520 201 & Sciences PublicationYou can also read