Machine Learning for Quantitative Finance Applications: A Survey
←
→
Page content transcription
If your browser does not render page correctly, please read the page content below
applied
           sciences
Article
Machine Learning for Quantitative Finance
Applications: A Survey
Francesco Rundo 1, * , Francesca Trenta 2 , Agatino Luigi di Stallo 3 and Sebastiano Battiato 2
 1    STMicroelectronics Srl-ADG Central R&D, 95121 Catania, Italy
 2    IPLAB—Department of Mathematics and Computer Science, University of Catania, 95121 Catania, Italy;
      francesca.trenta@unict.it (F.T.); battiato@dmi.unict.it (S.B.)
 3    GIURIMATICA Lab, Department of Applied Mathematics and LawTech, 97100 Ragusa, Italy;
      distallo@distallo.it
 *    Correspondence: francesco.rundo@st.com; Tel.: +39-095-740-4566

 Received: 27 November 2019; Accepted: 15 December 2019; Published: 17 December 2019

 Featured Application: The described approaches can be used in various applications in the field of
 quantitative finance from HFT trading systems to financial portfolio allocation and optimization
 systems, etc.

 Abstract: The analysis of financial data represents a challenge that researchers had to deal with.
 The rethinking of the basis of financial markets has led to an urgent demand for developing innovative
 models to understand financial assets. In the past few decades, researchers have proposed several
 systems based on traditional approaches, such as autoregressive integrated moving average (ARIMA)
 and the exponential smoothing model, in order to devise an accurate data representation. Despite their
 efficacy, the existing works face some drawbacks due to poor performance when managing a large
 amount of data with intrinsic complexity, high dimensionality and casual dynamicity. Furthermore,
 these approaches are not suitable for understanding hidden relationships (dependencies) between
 data. This paper proposes a review of some of the most significant works providing an exhaustive
 overview of recent machine learning (ML) techniques in the field of quantitative finance showing
 that these methods outperform traditional approaches. Finally, the paper also presents comparative
 studies about the effectiveness of several ML-based systems.

 Keywords: machine learning; time-series; financial domain

1. Introduction
     In recent years there has been increasing interest in predicting the future behavior of complex
systems by involving a temporal component [1]. Researchers have investigated this problem modelling
a convenient representation for financial data, the so-called time series (i.e., numerical data points
observed sequentially through time). Previous studies have highlighted the difficulty studying financial
time series accurately due to their non-linear and non-stationary patterns. In [2] the authors presented
a comparative study in order to demonstrate the inadequacy of classical approaches in capturing
the evolution of real-time time series. Furthermore, they discussed the advantages of applying
machine learning (ML) techniques in the field of quantitative finance. Despite achieving effective
outcomes, classical approaches have been widely employed in stationary systems, which represent an
approximation of the complex real-world observations.
     The progressive automatization of certain processes and rapid development in technology has
led to the use of ML-based methods in several fields, including the financial one. Despite skepticism
about the effectiveness of these approaches, researchers have proven that one of the main benefits

Appl. Sci. 2019, 9, 5574; doi:10.3390/app9245574                               www.mdpi.com/journal/applsci
Appl. Sci. 2019, 9, 5574 2 of 20
of ML solutions is to analyze a large amount of data in a short period of time with greater accuracy
and effectiveness. Due to unclear dependencies within data, identifying significant information from
irrelevant information is a very difficult task that can be tackled properly by ML-based systems.
The remainder of this paper is organized as follows. Section 2 describes how the research
investigation has been conducted. Section 3 introduces main differences between two principal
approaches in which surveyed studies fall into. In Section 4, we discuss the performance of
auto-regressive models developed for financial market applications. Section 5 provides a description of
studies based on Machine Learning algorithm, selected for our review. In addition, we discuss a class of
deep learning algorithm, which achieved impressive results in time series forecast. Section 6 provides an
exhaustive comparison between ML-based approaches and traditional models (such as autoregressive
integrated moving average (ARIMA), generalized autoregressive conditional heteroskedasticity
(GARCH), etc.). Section 7 devises some of significant hybrid approaches to identify the effective
combination for improving accuracy in time-series forecasting. Section 8 lists existing work in the area
of sentiment analysis. Section 9 illustrates reinforcement learning and quantum finance approaches
applied in financial domain. Section 10 illustrates comparison between traditional and ML-based
approaches. In Section 11, we report the final considerations of this paper.
2. Research Methodology
In this survey, we selected studies and/or research works based on the ML-based approach or
classical method in order to analyze time series problem in financial domain.
In this paper, we shed light on the promising results achieved by machine learning approaches for
time-series forecasting in the financial sector. Unlike relevant existing review articles [3], this survey
not only focuses on summarizing several approaches suitable for solving financial market problems,
but also compares ML-based approaches and traditional ones in order to discuss which method could
be more effective considering the current financial scenario.
Also, we provided results of selected studies in order to highlight the better overall performance
of ML-based systems over traditional approaches.
3. Technical and Fundamental Analysis
In the financial field we can distinguish two different approaches: Technical and Fundamental
Analysis. The goal is to identify patterns in order to predict time-series movements and improve
accuracy. The technical approach is based on analyzing stock market considering previous observed
patterns with the aim to determine future time series values. In fundamental analysis (FA), the basic
idea focuses on evaluating intrinsic value (i.e., perceived or calculated value of a stock or a company).
Technical analysis (TA) gained a considerable attention due to the efficient market hypothesis which
claims that stock movements are not a stochastic process but reveal repeated patterns over time. In fact,
this approach is based on studying prices movements through analyzing historical data. Despite being
a basis for several financial applications, TA presents cons related to the fact that market is highly
variable. Although the use of indicators parameters and tools to achieve a high accuracy, using real
data could affect the overall performance in negative perspective. On the other hand, FA consists of
studying factors which may affect the future trend. The main problem regards the fact that it incurs
considerable computational cost due to the poor result in performing rapid decision.
The proposed work illustrated some of the main methods that fall into each category of analysis
in order to define cons and pros of each methods and evaluate what algorithm is convenient to use
according to the current scenario.
4. Autoregressive Models
A considerable amount of literature has examined the most promising techniques for time series
forecasting. The outcomes have highlighted that these approaches could be subdivided into two
separate macro-categories, which include statistical and machine-learning methods.Appl. Sci. 2019, 9, 5574 3 of 20
The ARIMA model represents a generalization of the auto-regressive moving average (ARMA)
model, suitable to describe non-stationary time-series. More specifically, the main benefit in using the
ARIMA model is to transform a non-stationary series into a series without seasonality or trend, by
applying finite differencing of data points [4].
By definition, a time series is stationary if its statistical properties are all constant over time. If a
stationary series has no trend, its variations around its mean have a constant amplitude. Furthermore,
the time-series autocorrelations remain constant over time. Based on these assumptions, a time series
of this form can be considered as a combination of signal and noise. An ARIMA model manages the
signal by separating it from the noise. After removing noise from the signal, the output of ARIMA
model is the signal step-ahead to obtain forecasts. In order to select an appropriate model to improve
time-series forecasting, the Box–Jenkins model [4] has been developed to determine best ARIMA model
to fit to a given time-series.
The Box–Jenkins model has gained momentum in forecasting time-series not only in financial
sector but also to improve prediction of future values of a time-series considering electricity prices or
traffic data observations [5,6].
In order to demonstrate the effectiveness of the ARIMA model, we surveyed a set of works where
the ARIMA process was applied to perform stock price forecasting.
In [7] the authors investigated the problem to produce accurate prediction of stock market time
series data by using ARIMA and the GARCH model. However, they indicate that a major class of
works in literature used these classical approaches for solving a one-step ahead forecasting problems.
In the case of a multi-step or N-step ahead prediction, the aforementioned model does not perform
accurately. In particular, authors have been concerned about the decrease of accuracy and lack of
maintenance of data trend or dynamics. In order to overcome these limitations, a linear hybrid model
combining ARIMA and GARCH was proposed. First, they used a simple moving average filter in
order to decompose the stock-market time series into two different series. One of these data streams is
modeled by using ARIMA and GARCH model respectively. Finally, the outcomes from both models
are then combined to perform the values predictions. Results have shown that the proposed hybrid
model is suitable for multi-step ahead forecasting of high-volatile time-series.
In [8] the authors have applied a statistical model based on ARIMA to the New York Stock Exchange
(NYSE) and Nigeria Stock Exchange (NSE) for predicting future daily stock prices. The experimental
results showed that the model has reached satisfactory results for both stock indexes.
Despite preserving the data trend and obtaining good predictions in terms of accuracy, the ARIMA
model has definite limitations when dealing with financial time series data which present asymmetries,
irregular time intervals and high/low volatility. In fact, the main assumption of the ARIMA model
regards constant variance. Considering this fact, an integrated model represents a suitable solution
when dealing to data which reveal a non-complex structure.
Since we have shed light to the limitation of statistical models for the analyzed time series, the next
step consists in reviewing models of the machine-learning family which achieve effective results for
financial data prediction. Table 1 summarizes surveyed studies in this section.
Table 1. Summary of studies based on auto-regressive models. ARIMA: autoregressive integrated
moving average. GARCH: generalized autoregressive conditional heteroskedasticity.
Article Techniques Main Goal Dataset
Hybrid ARIMA-GARCH Multi-step
Babu et al. (2014) [7] NSE India data
model ahead forecasting
Nokia stock index/Zenith
Adebiyi et al. (2014) [8] ARIMA model Stock price prediction
bank stock indexAppl. Sci. 2019, 9, 5574 4 of 20
5. Machine-Learning Approaches
5.1. Support Vector Machine (SVM)
Support vector machine (SVM) is a technique of Machine Learning for data classification.
The objective of SVM is to find a separation hyperplane to correctly classify data with the maximum
margin [9]. The SVM finds a decision function which maximizes the margin between classes. SVM is a
supervised classification technique; this means that there are two main steps to be performed. First, a set
of labelled data (training data) is provided to the SVM. During this step the algorithms performs a
mathematical optimization based on the labelled data. The train examples that limit the maximum
margin defined by the SVM during the training are called support vectors.
A significant work based on the SVM model is [10], in which the authors aimed to develop an
efficient system to gain high profits by analyzing stock markets. Specifically, the authors employed the
SVM model to select the stock that exceed the percentage return of the market only selecting stocks
that outperform it. The results confirmed the effectiveness of the proposed SVM, in fact the selected
range of stocks reported a total return of 208% over 5 years.
The work developed by Cao et al. [11] was motivated by the fact that SVM achieved consistent
results for forecasting financial time series. This document provides a comparison between SVM,
a retro-propagation multilayer neural network (BP) and a regularized radial base function (RBF) neural
network. These models have been evaluated by taking as input five datasets listed in the Chicago
Mercantile Market. Results showed that SVM excels and achieves effective results considering both
adaptive and free parameters.
Nayak et al. [12] presented a framework which combines the SVM and K-approach (KNN)
for predicting Indian stock indices. Specifically, the authors applied the proposed model by using
different SVM kernel functions for estimating profits and losses. In order to improve the stock value
prediction, the author used the output, computed by SVM, to calculate the best neighbor from a
training set. Furthermore, they used two indices, the Bombay Stock Exchange (BSE Sensex) and CNX
Nifty, to evaluate the proposed model, taking advantages of closing price forecast, volatility and stock
market momentum related to data. To provide a complete study, the authors compared the hybrid
model with Functional Link Interval Type 2 Fuzzy Neural System (FLIT2NS) and Computationally
Efficient Functional Link Artificial Neural Networks (CEFLANN) by analyzing mean squared error
(MSE) results. Despite significantly complex procedure to update weight, the developed SVM-KNN
hybrid model is relatively suitable for solving financial prediction problems.
In [13], the authors explained a new approach called the state box method which consists of
selecting a group of stock points and subdividing them into three different boxes. Each box refers to a
category that indicates the stock status. In this approach, the authors implemented a new method
incorporating the AdaBoost algorithm, the probabilistic vector support machine (PSVM) and the
genetic algorithm (GA) with the aim to improve the classification of status boxes. Each box includes a
limited number of points which indicates the share price trend over a specific time period. The authors
investigated the effectiveness of the proposed model by selecting a group of shares listed in the
Shenzhen Stock Exchange (SZSE) and the National Association of Securities Dealers Automated
Quotations (NASDAQ) as inputs. By analyzing the results, the authors confirm that ensemble classifier
achieves remarkable results and outperforms other approaches based on using only the PSVM or the
back-propagation neural network (BPN).
One of the major issues related to financial field is the limitation in learning the pattern because
of high complexity and strong non-linear trend of stock data. In order to avoid inconsistent and
unpredictable performance on noisy data, Support Vector Machine has been proposed to overcome
limitations of classical approaches. Recently, SVM was not only applied for pattern recognition
problems but also to solve non-linear regression problems. SVM implements the so-called structural
risk minimization principle (SRM) which is an inductive principle used for model selection based on
balancing the model’s complexity against its success at fitting the training data. In fact, the main benefitAppl. Sci. 2019, 9, 5574 5 of 20
of SVM model is due to the fact it achieves higher generalization performance than traditional neural
network models. From the results reported in this section, it can be observed that the performance
of SVM exceeds the overall performance of classical neural networks approaches. In particular, the
superior performance is guaranteed by the fact that SVM implements the SRM principle which is
based on minimizing upper bound of the generalization error instead of minimizing the training
error. This eventually leads to better generalization than other ML-approaches (such as the BP neural
network). Also, advantages in applying SVM model not only includes a major improvement in terms
of generalization of neural networks performance, but also successfully overcome the defeats of other
models. Unlike existing ML models, SVM present a finite number of controlling parameters, prevents
overfitting problem and reaches convergence faster.
In Table 2, we report surveyed studies based on applying SVM model.
Table 2. Summary of studies based on the support vector machine (SVM) model. KNN: K-nearest neighbors.
Article Techniques Main Goal Dataset
Fan et al. Australian Stock Exchange
Support Vector Machine Stock selection
(2001) [10] (1992–2000)
Cao et al.
Support Vector Machine Forecasting Chicago Mercantile Market
(2003) [11]
Nayak et al.
Hybrid SVM-KNN model Stock market prediction Indian stock market indices
(2015) [12]
Status box method (Hybrid AdaBoost
Zhang et al. 20 shares from SZSE/
algorithm, genetic algorithm and Stock trend prediction
(2016) [13] 16 shares from NASDAQ
probabilistic SVM)
5.2. Deep Learning
Deep learning (DL) is a part of the machine-learning methods based on using data to train a model
to make predictions from new data. In general, DL methods allow to perform difficult task without
human involvement. In particular, DL methods represent an effective solution in solving financial
market problems which are different from typical deep learning applications. For example, selecting a
stock that is likely to perform well in future could represent a challenging task for a human. For this
reason, the tools of deep learning may be useful in such selection problems, because deep learning
techniques represent the best solution to compute any function mapping data (which include returns,
economic data, accounting date, etc.) into the value of the return.
This document [14] deals with stock market index forecasting. The experiments were carried out
by considering two indices, namely CNX Nifty and S&P Bombay Stock Exchange (BSE) Sensex of the
Indian stock markets. The main contribution of this work is the development of a two-phase fusion
approach which involves the use of support vector regression (SVR) in the first phase. The second stage
defined three different combination of SVR with other models including an artificial neural network
(ANN), random forest (RF) and SVR. Thus, the authors provide a comparison between the resulting
prediction models and single models ANN, RF and SVR for estimating the accuracy in forecasting
time series 1–10, 15 and 30 days in advance.
The authors of [15] presented a long short-term memory (LSTM) neural networks for modeling
and predicting the return of Chinese shares. Furthermore, they compared their LSTM model with
random forecasting method in order to verify the applicability and superiority of the proposed model.
The input data of the model are data related to Chinese stock market. In order to evaluate the proposed
model, the authors considered 30-day sequences of historical data with 10 learning features and labeling
functions of the earnings rate in 3 days. Results confirmed the superior performance of LSTM over
random forecasting method and its ability to improve the accuracy related to stock returns forecasting.
In this document [16], the authors provided an innovative model called the bat-neural network
multi-agent system (BNNMAS) aimed to perform stock prices prediction. In particular, the goal of theAppl. Sci. 2019, 9, 5574 6 of 20
proposed method is to predict eight years of Deutscher Aktienindex (DAX) stock indices. Furthermore,
the results of BNNMAS have been compared with the results of the genetic algorithm-neural network
(GANN) and teh general regression neural network (GRNN). Efforts have demonstrated the power of
BNNMAS in predicting stock prices in the long term accurately.
In [17] the authors investigated the problem of applying LSTM for financial time series forecasting.
They proposed a cutting-edge technique in order to distribute LSTM for predicting off-directional
movements. Stocks of the S&P 500 from 1992 to 2015 have been used as input data to validate the
proposed model. The results not only reveal that LSTM performs better without taking advantage of
classification methods such as random forest or deep neural network (DNN) but also shedding light
on the common pattern of securities presents high volatility and a short-term inversion return profile.
In Table 3, we summarize surveyed studies based on DL models.
5.3. Recurrent Neural Network (RNN) for Financial Forecasting
Recurrent Neural Networks (RNN) are a class of neural networks which uses internal memory to
process arbitrary sequence of inputs. Recurrent networks differ from feedforward networks by taking
as their input not just the current input example they analyze, but also what they have perceived
previously in time. In fact, recurrent networks preserve sequential information through a hidden state
which allows them to store information about the past efficiently. On the other hand, feedforward
networks transform input examples into an output. For example, considering a supervised learning
problem, the output would be a label, a name applied to the input.
A significant variant of RNN is LSTM which represents a well suitable solution in regression
problem such as forecasting time series. Considering their ability to capture hidden nonlinear
correlations between input data, the model was applied successfully to increase the accuracy forecast.
In this section, we provide a list of works based on using the LSTM/RNN model to solve financial
time-series forecasting.
LSTM architecture has proven to be stable and powerful for modeling long-range dependencies in
various previous studies [18–20]. The major benefit of LSTM is the ability to store useful information
by using its memory cell. In fact, LSTM represents a considerable improvement of the classic RNN
model because not only is it able to evaluate the hidden non-linear correlations between input data but
also it takes advantages of LSTM main unit and “gates” to prevent the so called vanishing gradient
problem which represents a drawback in RNN model.Appl. Sci. 2019, 9, 5574 7 of 20
Table 3. Summary of studies based on machine-learning (ML)/deep-learning (DL) models. ANN:
artificial neural network. SVR: support vector regression. RF: Random Forest.
Article Techniques Main Goal Dataset
Fusion approach involving ANN,
Patel et al. (2014) [14] Stock prices prediction Indian Stock market indices
RF and SVR models
Chen et al. (2015) [15] LSTM model Stock returns prediction China Stock Market data
Hafezi et al. bat-neural network
Stock price prediction DAX stock price
(2015) [16] multi-agent system (BNNMAS)
Fischer et al. Large-scale financial S&P 500
LSTM model
(2017) [17] market prediction (1992–2015)
Yümlü et al. Global, recurrent and Istanbul Stock Exchange
Financial time series prediction
(2005) [21] smoothed-piecewise neural models (1990–2002)
Selvin et al. (2017) LSTM-RNN-CNN sliding NSE listed companies’ data
Short term future prediction
[22] window-ARIMA (2014–2015)
Samarawickrama et al.
RNN model Daily stock prices prediction Sri Lankan Stock Exchange
(2017) [23]
Siami-Namini et al.
LSTM vs. ARIMA Comparison N225, IXIC, HIS, GSPC, DJ
(2018) [24]
ENEL.MI
ISP.MI
Rundo et al.
LSTM model Forecasting UCG.MI
(2019) [25]
CVAL.MI
MPS.MI
Rundo et al. Grid algorithmic trading system
Forecasting FX market (EUR/USD)
(2019) [26] (Non-linear Regression Network)
A significant work that provides a comparative study on evaluating the performance of three
different architectures is [21], in which the authors compare a global, feedback and smoothed-wise
model in order to solve the financial forecast problem. The three models include a multilayer perceptron
(MLP) feedback model by a RNN and smoothed-piecewise model by a “mixture of experts” (MoE)
structure. The evaluation of the aforementioned models is performed considering 12 years (from 1990
to 2002) of the Istanbul Stock Exchange (ISE) index (XU100). Furthermore, the authors implemented
an exponential generalized autoregressive conditional heteroscedastic (EGARCH) model aiming to
provide an exhaustive comparison based on estimating index return series such as hit rate (HR),
positive hit rate (HR+), negative hit rate (HR-), MSE, mean absolute error (MAE) and correlation.
The analysis of experiment results has highlighted that smoothed-piecewise model outperforms the
other ones, including EGARCH model.
Selvin et al. [22] investigated how a DL architecture could be applied to predict stock
index movement. Contrary to existing methods which are based on linear autoregressive (AR),
moving average (MA), ARIMA and non-linear algorithms, the proposed approach is based on three
different neural networks (LSTM, RNN and convolutional neural network (CNN)) to predict National
Stock Exchange of India (NSE)-listed companies. In order to evaluate the proposed methods, the authors
defined a sliding window strategy which includes overlapped data referring to minute wise data.
The results of error percentage value confirm that CNN is able to capture the dynamical change of the
data compared to other models that present a lack of accuracy.
Samarawickrama et al. [23] proposed the use of RNN to improve the accuracy of financial time
series prediction. Closing, High and Low prices of selected listed companies of Colombo Stock
Exchange were analyzed in order to predict future prices considering the past two days values.
In this approach, the comparison involved feedforward, simple recurrent neural network (SRNN),
gated recurrent unit (GRU) and LSTM architecture and make comparison between them. The prediction
results showed that structural recurrent neural network (SRNN) and LSTM neural networks performed
high accuracy contrary to feedforward networks. Despite the effectiveness of the two proposedAppl. Sci. 2019, 9, 5574 8 of 20
models, they present some drawbacks in different contexts whereas feedforward present a lower error.
To conclude, it has been noted that GRU networks do not perform stock price forecasting accurately.
The work proposed by Siami-Namini et al. [24] conducted a comparative study with the aim of
investigating if ML based approaches can be superior to traditional methods in terms of accuracy.
In this work, the authors compared a LSTM, a deep-learning architecture, with the ARIMA model
which falls into the class of statistical models. In this approach, historical monthly financial time series
from Jan 1985 to Aug 2018 from the Yahoo finance Web have been considered as input of the proposed
models in order to predict the trend of the stock exchanges. The experiment results reported that LSTM,
compared to the ARIMA model, provided the best overall performance, confirmed by RMSE values.
Rundo et al. [25] proposed an innovative LSTM-based framework in order to perform careful
stock price prediction. The proposed approach includes two pipelines: the first is defined to perform
Trend prediction and the second is developed to predict stock price values. Regarding stock close
price prediction, the proposed system is based on the usage of LSTM together with mathematical
price correction approach performed by Markov statistical model. Results revealed that the proposed
framework is able to perform stock price forecasting accurately. Furthermore, the proposed method
outperforms statistical model such as SMA, in terms of accuracy.
In [26], the authors presented an innovative framework composed by a non-linear regression
network which performs close price forecasting. The output, computed by Regression Network, is fed
to a trend classifier block which estimates the most probable short-term financial trend. After organizing
the trading grid by analyzing the current state of trading, the block called the basket equity system
manager evaluates the financial exposure of the trading grid.
Despite demonstrating high accuracy in predicting the next lags of time series, Integrated model
represents an inappropriate solution considering the newly developed deep learning-based algorithms
for forecasting time series data.
In particular, the surveyed studies conducted and reported in this article show that deep
learning-based algorithms such as LSTM outperform traditional-based algorithms such as the ARIMA
model. More specifically, the average reduction in error rates obtained by LSTM present a higher
percentage in term of accuracy when compared to auto-regressive models indicating the superiority of
LSTM to statistical models.
6. Comparisons
In literature, there are a huge number of papers which provide comparison between the AR model
with ARIMA methodology or BPANN aiming to define the suitable model for time-series forecasting.
Other related works have also analyzed the performance of SVMs and the traditional back propagation
(BP) model that seem to provide a better overall performance of these models compared to AR models.
In [27], the authors investigated the stock market indices forecasting applying a GARCH model in
order to compare it with standard BP. Defining a proper strategy should be provided to fit an adequate
model for the time series prediction. In the past few decades, several works have applied ARMA
approach for univariate time series forecasting. A time series represents a process where observations
are sequences of equally spaced points in time. But in financial domain, time series present large
volatility and non-linearity which are difficult to process by classical methods which their assumptions
are based on linearity. Several ML techniques were proposed to overcome some drawbacks of classical
methods by taking advantage of their ability to capture hidden patterns between input and output data.
The authors analyzed the performance of ARMA, GARCH and BP models in predicting four stock
market values. The results reported that GARCH and BP models offer a performance superior to the
ARMA model by using deviation performance as a criterion. However, the ARMA model is extremely
effective compared to other models in terms of direction and weighted direction performance criteria.
Finally, the authors observed that GARCH fitting line is closer than BP one except for the Financial
Times (FT) market.Appl. Sci. 2019, 9, 5574 9 of 20
A similar comparison was approached in [28] in which the authors demonstrate that ANN can
be engaged to improve financial time-series forecasting. The authors focused on applying ANN
and ARIMA models to predict PT Aneka Tambang Tbk (ANTM) by using historical daily values.
The authors also referred to previous works in which ANN is employed to predict stock movement with
a satisfactory result. In this paper, the most interesting observation that emerges from the comparison
of the two models is that ANN outperformed the auto regressive method. These experimental
results provide further justification to apply ANN model for solving a time-series forecasting problem
considering its ability to detect non-linear data pattern. In this paper, the authors reported as benchmark
the each sum square (ESS) result achieved by ARIMA and by ANN, confirming the effectiveness of
ML-based methods.
In [29], the ISE Index has been considered to perform time-series forecasting. The authors provide
a complete study for estimating the overall performance of an ANN and SVM model. To evaluate both
models, ten technical indicators have been employed including SMA etc. After establishing the best
combination of parameters for both models, the authors plugged the data into ANN and SVM model
aiming to forecasting the future values of the stock market. The experiments revealed that ANN is
more effective than the SVM model. However, the authors shed light that both models present lower
accuracy in forecasting stock market related to year 2001 in which the economic and financial crises
had an immense adverse impact on the Turkish financial market.
In [30], the authors examine the results of ARIMA and ANN models in forecasting the NYSE stock
data. By comparing all empirical results, ANN are more efficient than the statistical model, ARIMA.
According to [31], a random forest model can be engaged to predict stock market trend achieving
good results. In particular, the authors compared the performance of ANN, SVM, random forest and
naive Bayes using Reliance Industries and Infosys Ltd., in addition to CNX Nifty and S&P Bombay
Exchange (BSE) Sensex. The core idea is based on transforming data from continuous to discrete
values of a fixed number (i.e., 10) of technical parameters. The authors have set up the conversion of
the two first parameters, simple moving average (SMA) and weighted moving average (WMA), by
comparing their value to current price. The trend is determined by setting the discrete value equal to
−1 in case of the parameter value is lower than current price value which indicates a decreasing trend,
+1 otherwise. The experimental results highlighted that ANN, random forest and SVM model present
good performance by using discrete values as input. In general, the results illustrated that the model
produces poor results for the trend prediction when considering continuous data. Technical indicators
provide intrinsic information about the data trend, so they represent the adequate representation of
data as input for each model. Thus, the model must find a relationship between the input trend and the
output trend, which requires a lower level of complexity than that required when analyzing continuous
data. By contrast, when continuous data are used, the model is not able to obtain information about
the trend of the data which represents intrinsic information in these indicators.
Another example of work which focuses on applying artificial neural networks is [32]. A range
of companies listed in the São Paulo Stock Exchange Brazilian Mercantile and Futures Exchange
Bovespa (BM&FBovespa) were analyzed with the purpose to forecast the minimum and maximum
daily prices of the shares. In particular, the proposed pipeline is based on extracting relevant attributes
for improving the forecast prediction. The authors tested the developed algorithm by using MAE,
mean absolute percentage error (MAPE) and root mean square error (RMSE) metrics. Results showed
that the model is effective.
Li et al. [33] compared the use of LSTM and SVM in predicting the price movements of stocks.
The authors focused on analyzing a range of stocks including Shanghai Stock Exchange 50 (SSE 50)
Index and which are affected by different volatility. The overall performance reveal that SVM model
achieves significant results for all stocks including the SSE 50 which presents values that does not
fluctuate dramatically. Despite the effectiveness of SVM, it has been noted that the LSTM presents
consistent results in forecasting SSE 50 Index affected by high volatility. Considering the low-volatilityAppl. Sci. 2019, 9, 5574 10 of 20
stock exchanges, LSTM reported an averaged accuracy of 51.78% which is higher than the SVM
results (50.82%).
The surveyed studies of this section are reported in Table 4.
Table 4. Summary of comparative studies. GARCH: Generalized Autoregressive
Conditional Heteroskedasticity.
Article Method Main Goal Dataset
Hossain et al. GARCH vs. Nikkei 225, Hang Seng,
Comparison
(2008) [27] Neural Network FTSE 100 and DAX
Wijaya et al. Indonesia Stock data
ARIMA vs. ANN Comparison
(2010) [28] (ANTM)
Kara et al. Stock price index
ANN and SVM model Istanbul Stock Exchange (ISE)
(2011) [29] movement prediction
Adebiyi et al.
ARIMA vs. ANN Comparison New York Stock Exchange
(2014) [30]
Patel et al. ANN, SVM, RF, Comparison
Indian Stock Exchange
(2015) [31] Naïve Bayes (direction of movement for stock)
Laboissiere et al. São Paulo Stock Exchange
ANN Forecasting
(2015) [32] BM&FBovespa.
Li et al. Shanghai Stock Exchange
RNN, SVM Stock prediction
(2017) [33] 50 (SSE 50)
7. Hybrid Systems
A new hybrid approach [34] have been devised in order to forecast trend by using Taiwan stock
exchange weighted stock index (abbreviated TSEWSI). The hybrid system was developed by combining
a RNN model which uses features extracted by ARIMA model as input data. To improve the overall
performance, neural networks have been fed with the difference of predictions sequence in order
to adjust the connection weights during backpropagation training. Experiments revealed that the
prediction performed by the proposed model was significant and reliable. In fact, it has the capability
to predict 6 weeks ahead the market trend.
Another work that takes advantages from both linear and non-linear models is [35]. In this work,
the authors developed a hybrid method involving ARIMA and ANN models. The results confirmed
that the proposed model is well suited to improve forecasting accuracy. The aim of the proposed
models was to predict 35 and 67-period ahead. Results reported that neither the neural network nor the
ARIMA model have the capability to understand the patterns within data. But it has been noted that
the hybrid model combining two models is able to reduce the overall forecasting errors for 67-period
forecasting. With regard to 35-period forecasting, the ANN achieved better results.
The authors of [36] presented a new hybrid asymmetric volatility approach based on artificial
neural networks. In particular, they focused on improving the forecasting ability of derivative securities
prices. The benefit of using the proposed method is due to not only its ability to capture asymmetric
volatility but also the ability to reduce the stochastic and non-linearity of the error term sequence.
Lee et al. [37] provides a mixture of the SVM model and hybrid feature selection method aiming
to predicting the trend of stock markets. To improve the trend prediction, a hybrid selection approach
has been defined as a method to select the optimal features. The experiments were carried out by
performing a comparison between SVM model with F-score and supported sequential forward search
(F_SSFS) feature selection methods and BPNN along with information gain, symmetrical uncertainty,
and correlation-based feature selection. The final results indicated not only that SVM achieved better
results than BPN in terms of stock trend prediction but also the proposed SVM incorporating F_SSFS
shows a reliable level of accuracy.Appl. Sci. 2019, 9, 5574 11 of 20
In [38], the authors present a hybrid system to forecast financial time-series. The proposed method
combines an ARIMA model and fuzzy logic in order to demonstrate that proposed model could
overcome data limitations of individual ARIMA model.
A reliable work based on applying hybrid method to solve stock index forecasting is [39]. Since ESM,
ARIMA and BPNN models have been widely used with remarkable results to forecast time-series, this
document proposed a hybrid approach involving the aforementioned models. In particular, the authors
shed light on hybrid methods performs better than all three models in a single scenario in which they
have been considered in the original form. Also, the proposed model achieves better results than the
equal weight hybrid model (EWH), and the random walk model (RWM).
In [40] the authors have devised a hybrid system by using a genetic fuzzy system with an
ANN model. The main contribution of this work is the stepwise regression analysis which has been
developed to identify the factors that affect stock prices. To evaluate the overall performance of the
proposed model, the experiments were carried out considering the data related to the stock of IBM and
DELL corporations as well as Ryanair data, already used in previous studies. In general, it has been
noted that the artificial neural networks as well as the fuzzy algorithms have been applied successfully
to solve forecasting problems since they are able to obtain better results than using a single model.
In [41], the authors assembled a new hybrid approach combining the ARIMA with ANN model
in order to predict financial time-series. Before applying the proposed hybrid model, the nature of
financial time series has been explored in order to analyze its volatility. Numerical results showed
that the hybrid model excels over the individual ARIMA and ANN models, and existing hybrid
ARIMA-ANN models.
Panigrahi et al. [42] have elaborated a high-efficiency methodology combining ETS and ANN
model. The proposed hybrid model takes advantages of linear as well as non-linear modeling capability.
In this approach, the ETS model performs prediction of a given time series in order to capture data
linear patterns. To evaluate the accuracy of predictions, the authors calculated the residual error by
considering the difference between ETS predictions series and original time-series. The second stage
used ETS-predictions and ANN-predictions in order to merge them. To verify the applicability and
superiority of the proposed model, the authors compared this approach with some existing methods
such as ARIMA, ETS, MLP and other ARIMA-ANN models. The experiments confirmed the promising
results achieved by the ETS-ANN model.
In [43], the authors presented an innovative hybrid system which consists of a long short-term
memory (LSTM) to forecast stock price volatility with GARCH-type models. In order to conduct the
experiments, the authors used KOSPI 200 index data. The prediction performance confirmed that the
proposed model yield to consistent results.
In Table 5, we reported the surveyed studies based on applying hybrid systems.
Table 5. Summary of studies based on hybrid models. IBM: International Business Machines NASDAQ:
National Association of Securities Dealers Automated Quotation ESM: Exponential Smoothing Model.
Article Techniques Main Goal Dataset
Wang et al. ARIMA-based Recurrent
Market trend prediction Taiwan stock exchange
(1996) [34] Neural Network
Zhang et al. Wolf’s sunspot data, Canadian lynx
Hybrid ARIMA-ANN model Forecasting
(2003) [35] data/British Pound/USD exchange rate data
Hybrid asymmetric
Wang et al.
volatility approach Forecasting Taiwan stock index
(2009) [36]
(Grey-GJR–GARCH)
Ming-Chi Lee SVM with Hybrid feature
Stock trend prediction NASDAQ Index
(2009) [37] selection method (F_SSFS)
Exchange rate (US dollars/Iran Rials),
Khashei et al. Hybrid ARIMA-ANN-Fuzzy
Forecasting Gold price (Gram/US dollars),
(2009) [38] Logic model
Exchange rate (Euro/Iran Rials)Appl. Sci. 2019, 9, 5574 12 of 20
Table 5. Cont.
Article Techniques Main Goal Dataset
Wang et al. Shenzhen Integrated Index (SZII),
ESM, ARIMA, BPNN Forecasting
(2012) [39] Dow Jones Industrial Average Index (DJIA)
Hadavandi et al. Hybrid Genetic Fuzzy
Stock price forecasting IBM, British Airlines, RyanAir, DELL
(2013) [40] Systems–ANN model
Babu et al. Sunspot data, electricity data,
Hybrid ARIMA–ANN model Forecasting
(2014) [41] L&T stock market
Panigrahi et al.
Hybrid ETS–ANN model Forecasting IBM
(2017) [42]
Kim et al. Hybrid LSTM–multiple
Volatility prediction KOSPI 200 index
(2018) [43] GARCH-type model
8. Sentiment Analysis
As already mentioned, social media usage has increased over the last 10 years, becoming the
first place to obtain news. In particular, it has been noted that social media can affect not only public
opinion but also political and economic events. Many researchers have investigated how social media
could affect financial market in order to gain information for forecasting financial time-series.
Satisfactory results have been achieved by analyzing textual analysis of breaking financial news.
The proposed method [44] collected more than 9000 financial news articles and 10,000,000 S&P 500
stock quotes for a period of 5 weeks. The core idea is to estimate a discrete share price by analyzing
news 20 min after its release. Several textual representations have been used to analyze news accurately:
bag of words, noun phrases and named entities. Furthermore, the authors developed a SVM-based
system to perform discrete numerical prediction. The experiments demonstrated not only that Bag of
Words is the representation that works better than others but also SVM is extremely accurate according
to MSE values.
Another significant work in which a machine learning-based system is applied to analyze Twitter
data in the financial domain is [45]. The authors suggest that the stock market trend is high correlated
with public opinion. In particular, they focused on analyzing users’ tweets using two different textual
representations, called Word2vec [46] and N-gram [47]. The first representation was used to map each
single word in a vector, the second one is used to match the corpus of a text. The experimental results
confirmed the strong correlation existing between stock market trend and public opinion expressed in
tweets. In Table 6, we provide a summary of surveyed studies focused on sentiment analysis.
Table 6. Summary of studies based on sentiment analysis.
Article Techniques Main Goal Dataset
Schumaker et al.
SVM Discrete stock price estimation S&P 500
(2009) [44]
Pagolu et al. Dow Jones Industrial
Sentiment Analysis Stock market movements prediction
(2016) [45] Average Index (DJIA)
9. Reinforcement Learning (RL)
In this section, we surveyed some considerable approaches based on reinforcement learning.
Reinforcement learning refers to a machine-learning paradigm which involves an “agent” in order to
perform a task. The goal of agent is to maximize a numerical reward by interacting with an unknown
environment. In financial field, this emerging paradigm has gained attention due to their ability to
develop portfolio construction including prediction in one integrated step. Basically, the goal of the
agent is to include some constraints such as liquidity and transactions cost when a decision-making
process is performed.Appl. Sci. 2019, 9, 5574 13 of 20
In [48] the authors presented a time-driven feature-aware jointly deep reinforcement learning
(RL) model (TFJ-DLR) in order to learn features representation considering noisy financial time series.
Furthermore, the proposed method is developed to perform a decision-making system by taking
advantage of environmental representation. Specifically, the authors selected various features of
financial time series in order to summarize the useful values through analyzing historical data. Results
demonstrated the robustness and effectiveness of the proposed TFJ-DLR system by using real-world
financial data. In particular, the proposed method is able to increase investment returns.
A recent work is [49], in which the author implemented an algorithm based on supervised
DL and reinforcement learning algorithm. The main goal is to forecast the short-term trend in the
currency FOREX (FOReign EXchange) market with the aim to maximize the return of investment in a
high-frequency trend (HFT) algorithm. Also, the author proposed a grid trading engine to perform
high frequency operations. In order to validate the proposed model, the trading system has been
validated over several financial years and on the EUR/USD cross. The value of return of investment
(98.23%) and reduced drawdown (15.97%) confirmed the effectiveness of the proposed trading system.
Table 7 reports surveyed articles based on RL approach.
In [50], the author proposed a model that combines dynamic programming (DP) and RL techniques.
The proposed Q-Learner in the Black-Scholes (QLBS) model is developed to estimate future changes
for stock market using Black–Scholes–Merton’s model. After comparing fitted Q iteration to the DP
model in order to evaluate the performance, the author formulated an inverse reinforcement learning
(IRL) setting for the QLBS model aimed at analyzing prices and actions. Finally, the author discussed
the usage of QLBS model for option portfolios.
Recently, the increasing request of developing intelligent financial systems has led to the
development of trading systems which integrate quantum finance theory to solve financial
problems [51,52]. The main benefit of applying quantum technology to financial problem is related
to the ability of making calculations that reveal dynamic arbitrage possibilities that competitors are
unable to see. Quantum computing not only could be applied to an asset management or trading
problem, but it could perform trading optimization, risk profiling and prediction.
Table 7. Summary of studies based on reinforcement learning (RL) models. TFJ-DRL: Time-Driven
Feature-aware Jointly Deep Reinforcement Learning.
Article Techniques Main Goal Dataset
Lei et al.
TFJ-DRL model Financial signal representation S&P 500
(2020) [48]
Rundo Deep Learning/
Forecasting EUR/USD
(2019) [49] Reinforcement Learning
Halperin Dynamic Programming/
Trading Simulated stock price histories
(2019) [50] Reinforcement Learning
Baaquie
Quantum Finance Range accrual swap 90-day Libor
(2019) [53]
Lee (2019) Data provided by Quantum
CT2TFDNN model Financial prediction
[54] Finance Forecast Center (QFFC)
Lee (2019) Data provided by Quantum
COSMOS model Forecasting
[55] Finance Forecast Center (QFFC)
In this context, the work of Baaquie [53] represents an innovative solution. The objective of this
study [53] consists in taking advantage of quantum finance theory to price the rate range accrual swaps
which refer to the exchange of one set of cash flows for another.
With the exponential growth of RL solutions, several hybrid systems based on fuzzy logic,
genetic algorithms and chaotic theory have become a crucial topic in the fintech field. One of
the most recent work is [54], in which the author presented a chaotic type-2 transient-fuzzy deepAppl. Sci. 2019, 9, 5574 14 of 20
neuro-oscillatory network with retrograde signaling (CT2TFDNN) to perform financial prediction.
The proposed model is intended as extension of the prior work of the same author in which a chaotic
oscillatory multi-agent-based neuro-computing system (COSMOS) has been proposed [55].
In [54], the main contribution consists in providing an effective solution to preserve systems
by dealing with deadlock problems which are very common in recurrent neural networks solution.
Moreover, a chaotic deep neuro-oscillatory network with retrograde signaling (CDNONRS) is designed
to improve time-series prediction.
10. Discussion
In this survey, we described some of the most promising directions adopted to solve financial
problems. We started our investigation selecting the main approaches based on traditional methods,
commonly used for time-series forecasting. In Table 1, we summarized studies based on ARIMA and
GARCH models. First, linear models have been suggested to perform time-series forecasting taking
advantage of their effectiveness and quite simple implementation. Then, non-linear models (such as
ARIMA) have drawn attention due to their ability to transform non-linear data into stationary one.
By comparing the results, it can be observed that surveyed methods based on traditional models,
showed several weaknesses in processing a huge set of heterogenous data and identifying specific
hidden patterns. This has led to an increasing demand to adopt more efficient algorithms which are
able to capture hidden relationships between data, such as Machine Learning algorithms.
In recent years, several machine-learning methods have been developed for modeling financial
time-series. The SVM model belongs to this category of algorithms. In SVM, the basic idea is to define
an optimal hyperplane through mapping the data into higher-dimensional spaces, in which they are
linearly separable.
Despite achieving remarkable results, SVM presents some problem concerning the definition of
its hyper-parameters along the issue of selecting SVM training data from large datasets which could
increase the time complexity and affect the overall performance of the SVM classifier in practice.
Considering these facts, other ML approaches (including ANN, LSTM and RNN) have gained a
considerable uptake for time-series forecasting in last few years. One of the primary approaches was
the ANN model. ANNs have been developed in order to mimic the intelligence of the human brain
automatically. More specifically, ANNs try to recognize patterns in the input data attempting to provide
generalized results based on their known previous knowledge. As confirmed by reported results,
ANNs have largely applied in the financial domain. Their main advantage consists in not providing
any a priori assumption about the data. In fact, the model is suitable to fit a given time-series by
analyzing the features extracted from complex data, as opposed to traditional models, such as ARIMA.
Recently, a considerable amount of literature has investigated the use of RNN and its variants,
such as LSTM, for time-series forecasting. Compared to the classical ANN model, these models achieved
better results in forecasting problems due to their powerful ability to capture hidden relationships
within data. More specifically, LSTM architecture has been designed to learn long-term dependencies.
LSTM is able to manage the input/output data flow through its fundamental unit: the cell. A LSTM cell
is composed by three different “gates”, called input, forget and output gate, which establish to store or
discard data by using sigmoid function, called “activation function”. Also, the input and status of the
cell is updated through applying the “tanh function”.
Advances in natural language processing (NLP) and DL fields have brought the development of
sentiment analysis approaches to transform upcoming web news, tweets and financial reports into
relevant features. After extracting useful information from data in textual format, they are processed
as input time series to perform forecasting.
The studies reported in this work confirmed further the effectiveness of sentiment analysis
methods in predicting financial trend.Appl. Sci. 2019, 9, 5574 15 of 20
Finally, we investigated the problem to define a profitable trading system by applying RL
approaches. Thus, recent development in this field combing both DL and RL approaches taking
advantage of their powerful ability to elaborate complex data.
In particular, RL approaches have been applied to deal with the prediction of medium-short term
trend which represents an issue of the HFT systems. In Figure 1, we reported a timeline of strategies
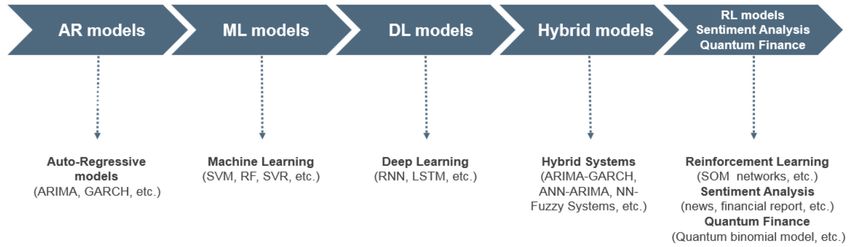
adopted for financial time-series modelling.
Figure 1. Timeline of adopted approaches for time-series analysis. AR: Auto-Regressive. ML: Machine
Learning. DL: Deep Learning. RL: Reinforcement Learning. SVM: Support Vector Machine. RF: Random
Forest. SVR: Support Vector Regression. ARIMA: Autoregressive Integrated Moving Average.
GARCH: Generalized Autoregressive Conditional Heteroskedasticity. RNN: Recurrent Neural Network.
LSTM: Long Short-Term Memory. SOM: Self-Organising Map.
The objective of this survey has been to discuss how machine-learning approaches outperform
methods based on non-linear algorithm underlying their pros and cons. The main benefit on applying
ML-based systems is to automatize trading operations and reduce computing time, ensuring to perform
with high level in terms of accuracy. For this reason, we focused on ML algorithms such as SVM or
random forest and DL models (LSTM or RNN). We compared some of these methods and evaluated
the approaches, which obtained the best results related to time-series modeling.
Our investigation suggested that a quite considerable number of investigated studies provide an
evaluation by using the following stock market data:
• Bombay SE: The Bombay Stock Exchange (BSE) is one of the largest exchanges in the world which
includes around 6000 companies. A large part of these companies is also listed on the National
Stock Exchange of India.
• S&P 500: Standard & Poor’s 500 Index is a market-capitalization-weighted index of the 500 largest
U.S. publicly traded companies.
• DAX indices: DAX is a stock index for German companies that trade on the Frankfurt Exchange.
In order to calculate the DAX Index, an electronic trading system, called Xetra, is used. Unlike
most indexes, the DAX is updated using futures prices for the next day.
• In a different twist from most indexes, the DAX is updated with futures prices for the next day,
even after the main stock exchange has closed.
• Shangai stock exchange: The Shanghai Stock Exchange (SSE) represents the largest stock exchange
in China. It is a non-profit organization run by the China Securities Regulatory Commission
(CSRC). Stocks, funds, bonds, and derivatives are all traded on the exchange.
• NASDAQ index: The NASDAQ is the world’s fast electronic stock exchange which operates
through computer and telephones, as opposite to traditional method. NASDAQ lists only
technology-based companies.
However, the proposed investigation highlighted the need to define a unique benchmark
dataset. We observed that investigated methods conducted experiments by using different datasets.
Benchmarks are important for researchers in order to measure the performance of an algorithm on a
specific problem. Without the definition of a unique dataset and appropriate performance indicators,
researchers cannot make a complete comparison between the proposed studies in order to select aYou can also read