Macroeconomic Predictions using Payments Data and Machine Learning
←
→
Page content transcription
If your browser does not render page correctly, please read the page content below
Macroeconomic Predictions using Payments Data and
Machine Learning∗

James Chapman and Ajit Desai
June 11, 2021
Big Data and Machine Learning in Finance Conference - Milan (Virtual)

∗
    The opinions here are of the authors and do not necessarily reflect the ones of the Bank of Canada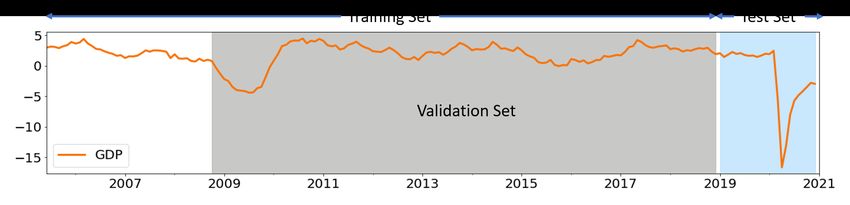
Objective

   Demonstrate the usefulness of payments data and machine learning (ML):

     • Use payments data from Canada’s retail and large value payments systems
     • Use the following ML models: elastic net, artificial neural network, random forest,
       and gradient boosting
     • Estimate current period (nowcast) GDP, retail, and wholesale trade sales

   Address the associated challenges: interpretability and overfitting

     • Shapley value-based approach to interpret ML model predictions
     • Improved cross-validation strategy to alleviate the overfitting

                                                                                             1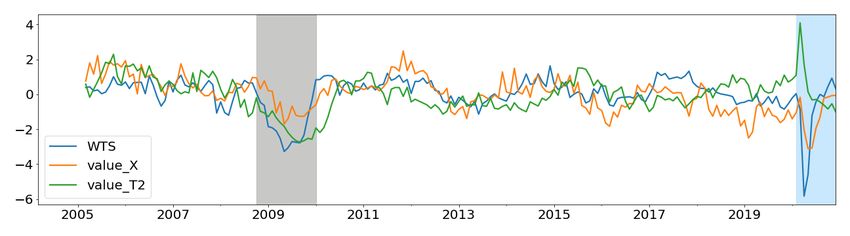
Motivation

  Macroeconomic Nowcasting:
    •   Delay: official estimates are released with a substantial lag
    •   Uncertainty: undergo multiple revisions sometime after years
    •   Unprecedented economic impacts of the crisis
    •   Unreliability of traditional models due to their reliability on the lagged data

  Payments Data & Machine Learning:
    •   Payments data is gathered electronically hence, available promptly
    •   Payments data is error-free: Has no measurement or sampling error
    •   Payments data captures a broad range of the economic activities
    •   ML models can efficiently handle wide data and manage collinearity and
        they can help capture nonlinear interactions
                                                                                          2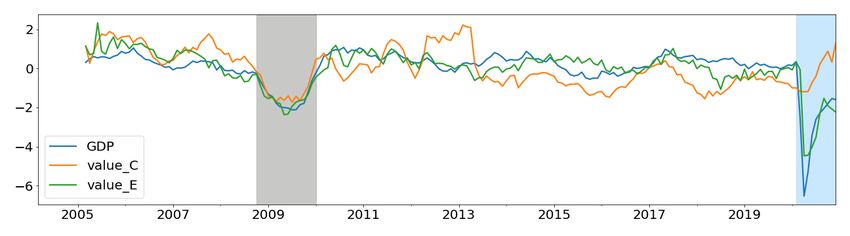
Results Preview

   Payments system data and ML models can lower nowcast errors significantly1 :

       • 35 to 40% reduction in RMSE for predicting GDP, retail and wholesale sales over
         a benchmark2 and 15 to 25% reduction over payments data with factor model
       • Out-of-sample model performance is relatively higher during the COVID-19 crisis
         period than the pre-COVID “normal” period
       • Model interpretation reveals that, a few payments streams are important over
         entire nowcasting periods and their importance increases during crisis periods3
       • Proposed cross-validation strategy help to reduce nowcasting RMSEs (6-12%)
   1
     Gradient boosting model performed consistently better than other models
   2
     Our benchmark is mixture of lagged and timely indicators in a linear model
   3
     Adjusted paper stream, sum of all ACSS streams, AFT and POS debits streams contribute more
                                                                                                  3
Literature
Payments Data for macroeconomic prediction:
• Galbraith & Tkacz (2018): Nowcasting with payments system data
• Aprigliano et al. (2019): payment system data to forecast the economic activity
• Chapman and Desai (2021): Nowcasting with retail payments data during crisis
Machine Learning for macroeconomic prediction:
• Richardson et al. (2020): Nowcasting GDP using machine learning
• Maehashi and Shintani (2020): GDP prediction using factor models and ML
• Coulombe et al. (2021): Can machine learning catch the Covid-19 recession?
4Outline
1. Data
2. Methodology
3. Interpretability
4. Overfitting
5. Results
5Data
Canadian ACSS and LVTS Data

   ID    Label                     Short Description
   C     AFT Credit                Direct Deposit: payroll, account transfers, social security
   D     AFT Debit                 Pre-authorized debit (PAD): bills, mortgages, utility
   E     Encoded Paper             Paper bills: cheques, bank drafts, paper PAD, etc.
   N     Shared ABM                Debit card payments to withdraw cash at ABM
   P     POS Payments              Point of sale (POS) payments using debit card
   X     Corporate Payments        Exchange of Corporate-to-Corporate and bill payments
   All   Allstream                 It is the sum of all payments streams settled in the ACSS
   T1    LVTS-T1                   Time critical payments and payments to Bank of Canada
   T2    LVTS-T2                   Security settlement, foreign exchange and other obligations
     Automated clearing settlement system (ACSS) and the large-value transfer system (LVTS)
     First six streams are representative of twenty payments instruments processed separately in the ACSS
                                                                                                            6
Payments Data for Prediction Standardization year-over-year growth rate comparisons of targets and payments streams. C-AFT Credit, E-Encoded Paper, X: Corporate Payments, T2: LVTS-T2 and WTS: Wholesale Trades 7
Payments Data: Opportunities & Challenges

  Opportunities:
    • Timely: available immediately after the end of the period
    • Precise: carry no sampling and measurement error
    • Comprehensive: capture a broad range of financial activities across the country

  Challenges:
    • Many changes in the ACSS streams (mainly due to technological advancements)
    • Not all retail payment schemes are in our data set (no credit card payments)
    • On-us transactions are not captured (if payer and payee have same banks)
    • Underlying data are non-stationary (who uses cheques anymore?)
    • Payments data have a strong seasonal component (need seasonal adjustments)

                                                                                        8
Methodology
Models

  List of model employed:
    • Ordinary least squares (OLS): Minimizing the sum of the squares of the
       differences
    • Dynamic Factor Model (DFM): Captures dynamics of large set of predictors
       into small number of latent factors
    • Elastic Net Regularization (ENT): Minimizing the sum of the squares of the
       differences with penalty factors
    • Artificial Neural Network (ANN): Multiple layers of artificial neurons
       sandwiched between input and output layers
    • Random Forest Regression (RFR): Forest of many independent regression trees
       each built from subset of the training set
    • Gradient Boosting Regression (GBR): Sequence of small trees are built on a
       repeatedly modified training dataset
                                                                                    9
Machine Learning Models: Opportunities & Challenges
Opportunities:
• Handle non-traditional and large-scale datasets and manage collinearity
• Capture sudden, large, and nonlinear relationships
• Emphasis on improving prediction accuracy
Challenges:
• Interpretability
• Overfitting
• Large-scale data
10Interpretability
Shapley Values: SHAP4

  Example: Consider nowcasting is a “game” then the Shapley values can be used to
  fairly distribute the payout (= the prediction) among the players (= the predictors)

   4
       Lundberg et al. (2017). SHAP: A unified approach to interpreting model predictions.   11
SHAP: Advantages & Disadvantages
Advantages:
• Theoretical foundation
• Model independent
• Local and global interpretation
Disadvantages:
• Computationally expensive with increasing number of predictors
• Parametric models suffer from collinearity in the predictors
• It is possible to create intentionally misleading interpretations5
5
Slack, Dylan, et al. (2019): Fooling LIME and SHAP: Adversarial attacks on post hoc explanation methods
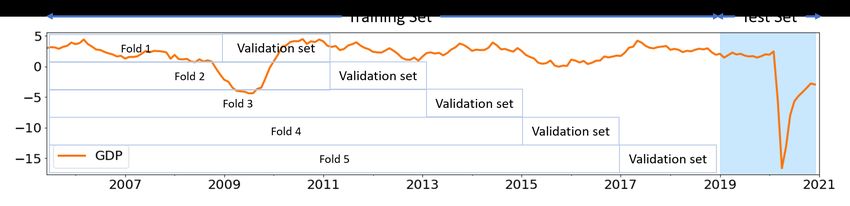
12Overfitting
K-fold Cross-validation: Randomized expanding window

   Standard approach for time-series:

   Proposed approach for macroeconomic time series:

                                                       13
Randomized Expanding Window:
Advantages & Disadvantages:
• Distribution of each validation set is similar to the test set
• Help avoid breaking the order of data (autocorrelation)
• Could sample many validation sets (no constrains)
• Some observations may get selected more than once, and some may never get
selected in the validation set
14Results
Nowcasting Models: Case specifications

   The nowcasting horizon (t + 1) is based on the payments data availability t

   To predict May’s GDP growth rates on June 1st , i.e., at t + 1, we use payments data
   for May (at t), and other latest available macro indicators:

        • Base case (benchmark): OLS (5 predictor)6
                          [ t+1 = F(GDP t−2 , CPI t−1 , UNE t−1 , CFSI t , CBCC t )
                          GDP

        • Main case (of interest): DFM, ENT, RFR, GBR, ANN7 (23 predictors)
                [ t+1 = F(GDP t−2 , CPI t−1 , UNE t−1 , CFSI t , CBCC t , Payments t ).
                GDP

   6
       CPI: Consumer Price Index, UNE: Unemployment, CFSI: Canadian Financial Stress Indicator, CBCC: Consumer Board’s Confidence Index
   7
       OLS: Ordinary Least Squares, DFM: Dynamic Factor, ENT: Elastic Net, RFR: Random Forest, GBR: Gradient Boosting, ANN: Neural Network

                                                                                                                                             15
Nowcasting Models: Results
RMSE on out-of-sample testing perioda
Target Benchmarkb Main-DFMc Main-MLd % RMSE Reductione
GDP 3.97 2.98 2.43 39*
RTS 8.47 6.36 5.32 37*
WTS 7.18 5.93 4.28 41*
a
Training: Mar 2005 to Dec 2018 and testing: Jan 2019 to Dec 2020
b
Benchmark: OLS using first available lagged target and other base case variables
c
Main-DFM: Payments data along with the benchmark variables in the DFM model
d
Main-ML: Payments data along with the benchmark variables in the ML model
(only the best among ENT, RFR, GBR, ANN is showed)
e
% reduction in RMSE using ML model with payments data over the benchmark model
*
denote statistical significance at the 10% over benchmark
16ML Models: Interpretation
Local interpretation: GDP nowcast using gradient boosting (train: Mar 05 to Dec 20)
Force plots for Feb and Mar 2020. Red are positive Shapley values and blue are negative
Shapley values. f (x) is the model prediction and the base value is average of all predictions
17ML Models: Interpretation
Global interpretation: Left: full sample and Right: Covid-19 period (Mar to Dec 20)
18Conclusions
This paper substantiates the use of payments data and ML models for macroeconomic
prediction and provides a set of tools to overcome associated challenges:
• Payments data provide economic information in real-time and help reduce
dependence on lagged variables (during normal times and crisis periods)
• Machine learning provide set of econometric tools to effective process various
payments streams and capture sudden and large effects of crisis
• Shapley value-based SHAP approach is useful to get insights into the ML model
predictions (local and global interpretations)
• Proposed cross-validation technique can help reduce overfitting and improve
prediction accuracy in macroeconomic nowcasting models
19Thank you!
20You can also read