MAL 2019 DRAFT PLAN key facts 26 October 2018 - HSL
←
→
Page content transcription
If your browser does not render page correctly, please read the page content below
MAL 2019
DRAFT PLAN
key facts
26 October 2018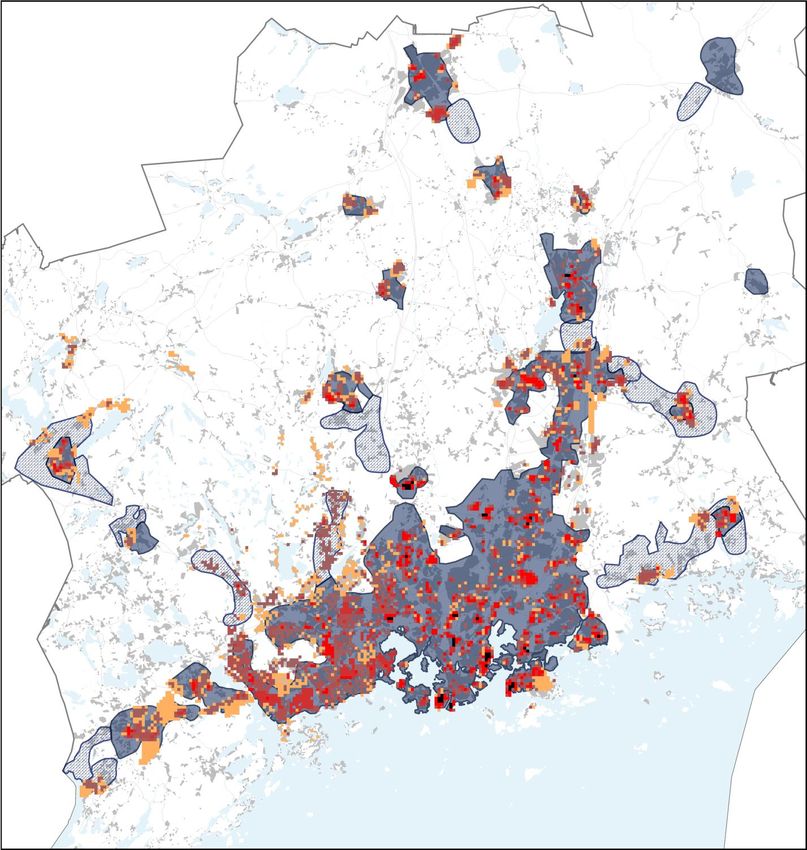
Helsinki region municipalities,
number of residents and jobs
The region is home to 1,478,000 people and 709,000 jobs. The region
prepares for population growth.
 Capital region       Kuuma region         Vihti
 Helsinki                                  Population 29,094
 Population 645,179                        Jobs 8,069
 Jobs 379,518
                       HSL area
                                           Hyvinkää
 Espoo                                     Population 46,739
 Population 279,529    Kirkkonummi         Jobs 19,179
 Jobs 116,246          Population 39,232
                                           Mäntsälä
 Vantaa                Jobs 10,536
                                           Population 20,777
 Population 223,600    Kerava              Jobs 6,055
 Jobs 109,779          Population 35,635
                                           Järvenpää
 Kauniainen            Jobs 12,101
                                           Population 42,656
 Population 9,602      Sipoo               Jobs 12,238
 Jobs 2,371,           Population 20,299
                                           Pornainen
                       Jobs 5,532
                                           Population 5,120
                       Tuusula             Jobs 1,048
 Siuntio               Population 38,650
                                           Nurmijärvi
 Population 6,149      Jobs 14,105
                                           Population 42,211
 Jobs 1,444
                                           Jobs 11,731
                                                               The 14 Helsinki region municipalities and Siuntio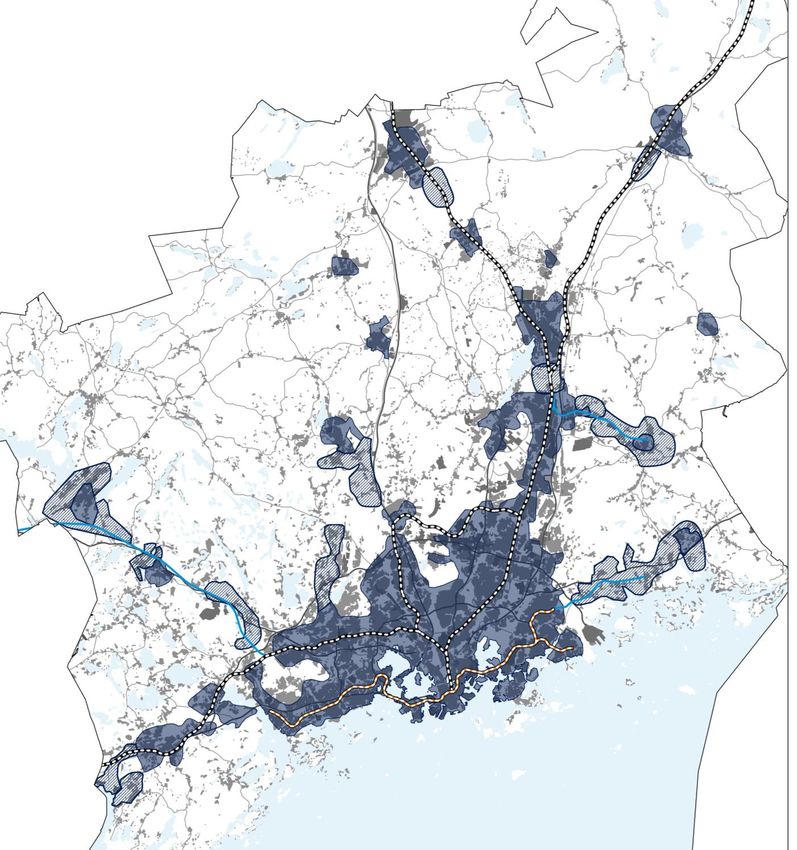
MAL 2019 objectives

    Low-emission         Attractive             Vibrant                Healthy
 The region grows     An internationally   Economic efficiency A safe and healthy living
  sustainably and     connected region         ensures the      environment enables
   emissions are        attracts new        development and      everyone to lead an
effectively reduced    businesses and       functioning of the   active everyday life
                          residents               region
3
MAL 2019 core indicators and
   target levels

                                          Luonnos

   Greenhouse           Labor force       Differences         Socio-economic    At least 90%     The modal          At least 85% of
   gas emissions        accessibility     between areas       efficiency: the   of new           share of           the population
   from traffic         improves at       decrease from       cost/benefit      housing          sustainable        is located in
   decrease by at       least by 10% by   the current level   ratio of system   developments     modes of           sustainable
   least 50% by         2030 from the     and social          level             are located in   transport          mobility zones.
   2030 against         current level.    segregation         development
                                                              activities is
                                                                                the primary      (walking,
   2005 levels                            does not
                                                              over 1            land-use         cycling, public
   [CO2]                                  increase from
                                                                                development      transport) in
                                          the present
                                          situation by                          zones            the region is at
                                          2030.                                                  least 70%.

Decisive target level
In 2030, the goals are achieved by an effective
and concrete set of measures

   Growth in the            Enough new              Major investments in      Emissions are
   region is directed       housing units are       rail transport and        reduced by
   to the existing          built and the           cycling; road             implementing road
   structure and to         quality of the living   transport developed       pricing, which
   areas that are           environment is          with a focus on           reduces vehicle
   competitive in           ensured                 freight transport and     mileage, and by
   terms of public                                  public transport          renewing the vehicle
   transport                                                                  fleet
                                                    Investments:
   At least 90% of
                                                    Public transport €1.8bn   The plan reduces
   housing located in the
                            16,500 housing          Cycling €0.3bn            greenhouse gas
   primary development
   zones                    units a year            Road transport €0.3bn     emissions from traffic by
                                                                              50%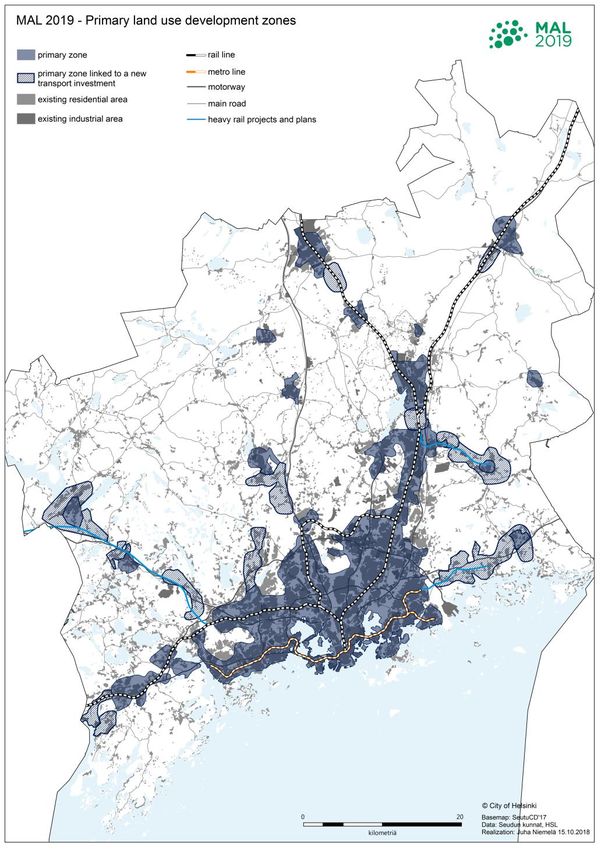
New land use is located sustainably in areas
with good accessibility and infill development of
the existing urban structure is enabled

The quality of housing and the living
environment in a compact urban structure is
ensured

The potential of areas around stations is
harnessed
Availability and affordability of housing is
ensured

Diversity of housing is promoted

The quality of living environments is
enhanced

The quality of the housing stock is ensured

Energy-efficiency of the building stock is
promoted
Getting the most out of the current system

Using data to optimize the transport system

New networked links as enablers of sustainable growth

Share of cycling up through strong joint efforts

New mobility services and technologies support sustainable
mobility

Road transport network is developed with a focus on freight and
public transport

Provisions are made for nationally important rail links

Road traffic pricing is an effective measure for
emission reduction, funding and improved flow
of traffic

Parking policy steers people towards
sustainable mobility

The share of electric cars and low-emission
vehicles is increased by joint means
MAL 2019 Primary land use development zones
Primary zone
Primary zone linked to a new transport investment
Existing residential area
Existing industrial area
Metro line
Rail line
Motorway
Main road
Heavy rail projects and plans
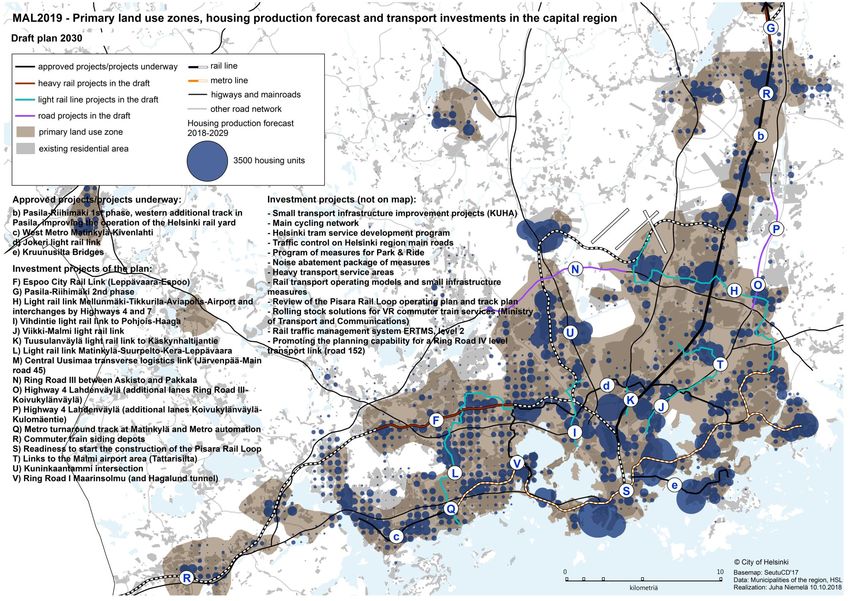
Housing production 2018-2029, as estimated
by municipalities
Housing units to be completed on a 250 x
250m grid
Primary development zones (updated zone
boundaries)
Forecast enabling housing
construction 2018-2029                    Completed                            Forecast                             Target
                                                                               Average     Average     Altogether
                                    2016          2017     2018     2019     (2020-2024) (2025-2029)   2018-2029    2019
             Espoo                  2,474        3,269     3,688    4,079      3,303        3,160       40,080      3,300        Espoo
            Helsinki                4,395        4,890     4,274    6,020      6,989        6,979       80,137      6,600       Helsinki
          Kauniainen                 27           187       15       102        154         107          1,424       80        Kauniainen
            Vantaa                  2,943        3,289     4,530    4,043      3,042        2,100       34,281      2,640        Vantaa
   Helsinki Metropolitan Area       9,839        11,635    12,507   14,244     13,489      12,346       155,922     12,620      Pk-seutu
           Hyvinkää                  288          365       204      283        328         493          4,591       396        Hyvinkää
           Järvenpää                 721         1,023      575      760        735         610          8,058       566       Järvenpää
            Kerava                   354          314       703      753        501         278          5,351       514         Kerava
          Kirkkonummi                345          298       400      435        426         453          5,230       434      Kirkkonummi
           Mäntsälä                  165          134       50       150        133         177          1,749       212        Mäntsälä
           Nurmijärvi                355          356       464      376        313         300          3,901       434       Nurmijärvi
           Pornainen                 18               14    35       35          35          35           420        80        Pornainen
             Sipoo                   344          170       368      637        559         554          6,569       434         Sipoo
            Tuusula                  357          282       62       373        476         429          4,960       462        Tuusula
              Vihti                  140          184       193      299        164         209          2,359       344          Vihti
KUUMA municipalities (Keski-
Uusimaa Region municipalities)      3,087        3,140     3,054    4,101      3,670        3,537       43,188      3,876    Kuuma-kunnat

        Helsingin seutu             12,926       14,775    15,561   18,345     17,158      15,882       199,110     16,496   Helsingin seutu

Target Helsinki Metropolitan Area   10,325       11,090    11,855   12,620     12,620      12,620
 Target KUUMA municipalities        3,174        3,408     3,642    3,876      3,876        3,876
Primary zones,
location of housing
developments and
transport investments,
Helsinki region
13Primary zones,
location of housing
developments and
transport
investments,
Capital region
14MAL 2019 assessment framework
Low-emission Attractive Vibrant Healthy
Competitiveness and conditions
Greenhouse gas emissions Socio-economic efficiency Segregation
for business and industry
Need to travel and sustainable Functioning of the housing market Impacts on public finances Number, variety and location of
modes of transport housing units
Functioning of the labor market Agglomeration
Energy consumption Service supply
Agglomeration Functioning of the labor market
Resource efficiency Mobility options
Internal and external accessibility Link between transport and land
Urban structure of the region use Transport costs
Use of resources Other pull factors, such as health Wider socio-economic impacts Health and safety
and safety
Biodiversity Exposure to local emissions from
Ease of day-to-day life traffic
Landscape and built
environment Housing supply Traffic safety
Waterways Service supply Living environment and comfort
Adaptation Mobility options Health benefits and wellbeing
Local accessibility Areas of assessment
Flow of traffic and ease of travel
Overarching themes in the assessmentMeasures to reduce greenhouse gas emissions from traffic
in the Helsinki region by 2030
Emission reduction potential
Changes in CO2 emissions
of individual measures(1,000t)
from traffic up to 2030
2005
Changes
so far 160 Rapid increase of electric and low-emission cars
2015 -19%
60 Road pricing
Changes
Assumed changes in vehicle emissions per unit
Without Completed transport projects and projects underway
the measures Intensifying land use which affects car ownership
set out in 45 Helsinki region bus services are emission neutral
the draft
-33% 27 Investment aid for heavy transport technology
23 Transport projects and concentrating land use in key areas
Measures The measures set out in the draft reduce CO2 emissions 17 Shared rides
set out from traffic by 17 percentage points, or about 400,000 tons 16 Influencing employee parking and commuting
in the Draft 15 Expansion of parking zones
MAL 2019 15 Environmental zone for heavy traffic in the city center
13 Cutting public transport ticket prices by 15-30%
11 Regional main cycling network, electric bikes and city bikes
2030 Target -50% 6 Development of centers, stations and nodes
5 Increasing Park & RideMAL 2019 core indicators and
target levels
Luonnos
Greenhouse Accessibility of Differences Socio-economic Housing Share of Location of
gas emissions labor between areas efficiency production sustainable population in
from traffic decrease and located in the modes of sustainable
social primary transport mobility zones
segregation development
does not zones
increase Target 85%
Target -50% Draft: the Target >1.0 Target 90% Draft 90%
Draft -50% Target +10% measures Draft 2.9 Draft 94% Target 70% (0 ALT 82%)
contribute to
(0 ALT -33%) Draft +14% positive changes Draft 65%
(0 ALT +8%) (0 ALT 57%)Measures after 2030
Greenhouse gas emissions are reduced from the 2030 levels so that Helsinki region is
carbon neutral by 2050
• by land use and transport planning
• by economic steering tools
• by developing and utilizing new services and technologies
• by local production of food and energy
• by emission compensations and carbon sinks
New land use is located sustainably in the primary development zones and their infill areas
• Potential expansion areas are used if a binding decision has been made on the required transport investment
Ensuring sufficient housing to meet the needs of the growing population that enables high-
quality housing for all population groups
Integrated public transport, beginning with the train and metro network
• The transport system is developed to be increasingly based on sustainable modes of transport by creating a
long-term rail vision and implementation path for the entire region.19 16.11.2018
Abstract of the impact assessment of
         the Draft MAL 2019
           5 November 2018
Impact assessment is an
integral part of planning
Planning Modelling
3x Continuous
interaction
Impact
assessmentThe emission reduction target for transport is
achieved • Greenhouse gas emissions
from traffic can be reduced
by half if the proposed
CO2 emissions from road transport measures are adopted
2000 -19% quickly and efficiently.
1800 • According to the goal
-33%
1600 -35% proposed in the National
1400 -44% Energy and Climate
Tavoite
-50% -50% Strategy for 2030, there
CO2e, 1,000 t
1200
should be at least 250,000
1000
fully electric vehicles and
800
rechargeable hybrids in
600 2030. This is also the point
400 of departure when drafting
200 MAL 2019.
0
2015 2030 ve0 2030 ve1 2030 ve2 2030 ve3 Tavoite
• The assumption in MAL 2019
Henkilö- ja pakettiautot Linja-autot Kuorma-autot Yhteensä
is that 20% of the vehicles in
the region will be powered by
electricity in 2030. The
emissions calculated for an
Private cars and vans Buses and coaches Trucks Total Target -50% Target electric car are 15 g CO2 per
vehicle kilometer.The share of sustainable modes of transport will
increase throughout the region, especially in new
rail corridors.
• Urban structure will become more
100% compact as land use focuses on
90% centers, areas around stations,
80% and areas with good accessibility.
70%
70% 65%
58% 57% 57% 59%
63%
• Walking, cycling and the use of
60%
public transport for everyday
50%
journeys will become easier.
40%
30% • Motor vehicle traffic mileage will
20%
almost remain at the present level
in spite of considerable growth in
10%
the region.
0%
2030 ve0
2030 ve1
2030 ve2
2030 ve3
2030 ve0
2030 ve1
2030 ve2
2030 ve3
2030 ve0
2030 ve1
2030 ve2
2030 ve3
2030 ve0
2030 ve1
2030 ve2
2030 ve3
2012
2018
2018
2018
2018
• Car density will decrease
considerably. Vehicle mileage per
Helsingin seutu - Kantakaupunki - Muu PKS - Kehyskunnat
Joukkoliikenne Pyöräliikenne Jalankulku Tavoite Tavoite
inhabitant will also decrease.• Introducing a more compact
urban structure and making
efficient use of the transport • Concentrating land use
system is sensible in view of development will save
the use of resources. natural areas and support
the maintenance of the
• A more compact urban green network.
structure will also reduce the
use of natural resources in • In further planning, it is
the long term. possible to significantly
affect the formation and
intensity of impacts through
area borders and planning
solutions.Dependence on private cars will continue to high outside rail centers As the population increases and the urban structure becomes more compact, local recreational areas may be threatened and there is pressure on their use. Noise and local emissions may also increase. Pressure will be imposed on landscape areas and the built environment, especially in central Helsinki and close to the rail network. Residential areas and new transport projects will be located in flood risk areas in places. There will also be some pressure on groundwater areas. A compact structure increases rainwater risk and strengthens the urban heat island phenomenon.
More labor closer to jobs
The measures listed in the draft improve the
operating conditions for business and industry.
Labor accessibility will increase by 6 Labor accessibility
160000
percentage points, the reliability of +15 %
140000
transportation will improve, and travel times +14%Target
+8%+8%+8%
+14 %
120000
will shorten. 100000
Population growth, locating population in the 80000
core areas and rail transport zones of the 60000 +9%
region and improving the flow of traffic (e.g. 40000
the road charges) will improve labor 20000
0
accessibility. Helsingin seutu
Helsinki region
Kantakaupunki Muu PKS Kehyskunnat
Central city area Other capital region Surrounding
94% of the planned housing production will 2018 2030 ve0 2030 ve1 2030 ve2 2030 ve3 municipalities
Tavoite
focus on the primary regional development 2018 ALT0 ALT1 ALT 2 ALT3 Target
zones close to the region's urban centers and
rail corridors.
The measures outlined in the draft will improve
accessibility by different modes of transport,
which in part will sustain economic growth.Smoother travel and everyday
life
The settlement of inhabitants in zones readily accessible by
sustainable modes of transport.
90% of the region's population and jobs are
100%
located in areas where it is possible to use 90% 84%
90%Target
85%
82% 83%
public transport or to walk or cycle to make 80%
72%
everyday journeys. 70%
60%
The share of new inhabitants settling in the 50%
rail zones is approximately 71%. 40%
30% Helsinki region Central city area Other capital region Surrounding
The use of private cars will become easier 20% municipalities
and travel times more predictable as 10%
congestion decreases. 0%
Helsingin seutu Kantakaupunki Muu PKS Kehyskunnat
Helsinki region Central city area Other capital region Surrounding
People can reach their jobs and leisure 2018 2030 ve0 2030 ve1 2030 ve2 2030 ve3 Tavoite
municipalities
activities faster.
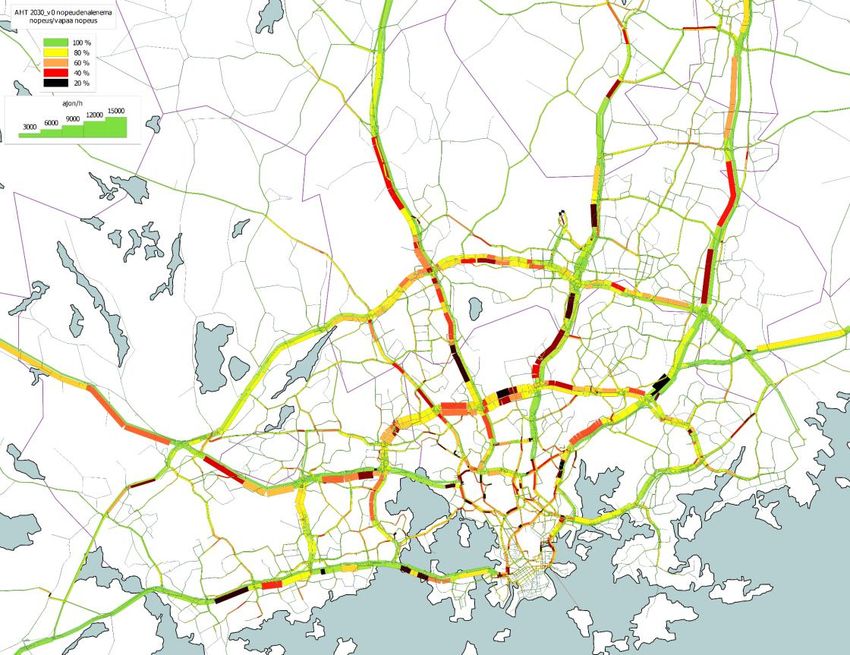
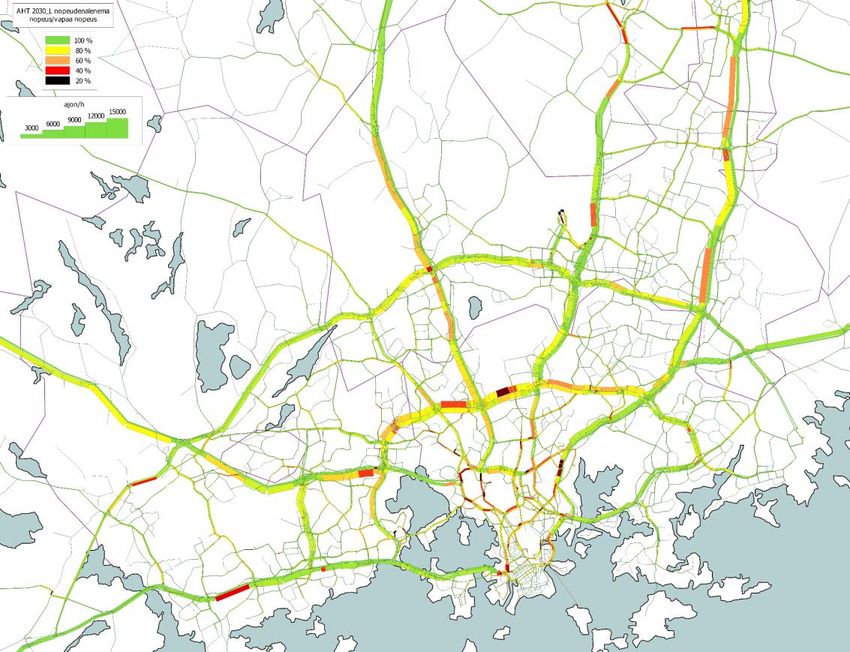
2018 2030 ALT0 2030ALT1 2030ALT 2 2030ALT3 TargetCongestion on the road network will
decrease and the reliability of
transportation will improve.
Road pricing will considerably reduce congestion on the
region's road network. Road pricing is a very
efficient, flexible way of
• Congestion will decrease by almost half, compared to the cutting CO2 emissions from
base alternative. traffic, promoting the use of
Road pricing will also reduce travel times by approximately sustainable modes of
transport, reducing
10%. congestion, and ensuring the
They will also improve the reliability of transportation. availability of transport
system development
The fees will affect less than 20% of the region's inhabitants
resources.
travellng during the morning rush hour.Faster travel – easier day-to-day life
The zero alternative 2030 Draft 2030
Congestion on the road and street network /morning peak
hourChallenges with attractiveness are connected with improved accessibility. Road pricing and parking fees in part impair labor accessibility by increasing mobility costs. Together with improved transport links and reduced public transport fares, however, the combined effect on accessibility will be positive. Labor accessibility in the surrounding municipalities will not increase in the same way as elsewhere in the region. The higher the population growth in the region, the more important beginning to implement these measures becomes. This is also connected with housing production. Improving accessibility depends on when the measures are implemented and infrastructure projects completed.
Sustainable and strong public finances create
basic conditions for the whole plan
As a whole, the transport project program in the draft plan
is socio-economically efficient.
The socio-economic efficiency of the draft plan is 2.9 when Benefits/costs
described as a benefit-to-cost ratio. ratio
The computational time and costs savings as well as the 2.9
revenues of public finances are markedly higher than the ALT3 2030
investment costs. ALT 2: 2.3
ALT1: 0.7
This is especially due to road pricing and parking fees,
but also to the choice of efficient investments. Target>1
Relying on the current infrastructure is also cost-
Socio-economic efficiency describes
effective.
the relationship between the benefits
The computational time and costs savings as well as the of the transport projects produced by
revenues of public finances are markedly higher than the the draft and the resources used for
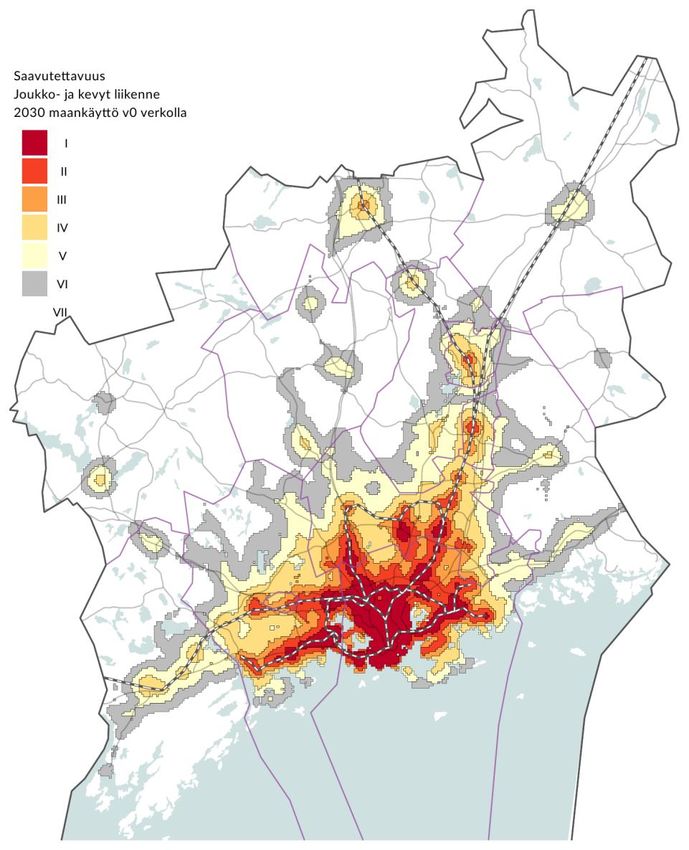
investment costs. them, i.e. overall profitability.The measures presented in the draft will improve regional accessibility by public transport, walking and cycling. Current 2030 Zero alt 2030 Draft Accessibility Public transport, walking and cycling 2014-2016 land use with the 2018 network 2030 land use with the 0 alternative network 2030 land use with the draft network
The most important thing is the infill development of the existing structure and making it more compact The proposed zones are justified, considering that the aim is to locate regionally important housing construction in them during the entire planning period. Land use within the zones must be directed to areas that are highly accessible by sustainable modes of transport and where land use potential has not yet been fully utilized. Attention must be paid to less densely built-up centers and areas around stations. Land use development in the expansion zones must be closely connected to developing public transport.
The measures have many interdependencies. The successful implementation of the measures set out in the plan and the scope of its benefits depend on several interconnected aspects that can impair viability. An increase in transport project costs impairs efficiency and delays to them reduce benefits, thereby further impairing viability and public finances. The socio-economic efficiency of the plan only accounts for cost/benefit ratio of the transport project program and not the efficiency of the entire MAL plan.
A high standard of housing production and regionally correctly targeted housing production ensure moderate pricing and responding to different housing needs. The draft estimates that the need for sufficient housing will be 16,500 housing units a year, which will mean almost 200,000 housing units by 2030. More compact land use will allow the provision of a variety of local services for more people. The measures set out in the draft will help to mitigate the segregation trend in the Helsinki region. The draft identifiess infill development, new construction, and demolition and additional construction as instruments for mitigating segregation.
Housing and jobs will be located in
areas with good accessibility by
public transport, walking and
cycling.
The preconditions for a car-free lifestyle improve with
compact housing in centers, improved conditions for
walking and cycling and improved public transport
links.
Cutting public transport ticket prices will remove
financial obstacles to mobility.
Decreased road traffic translates into a more healthy
and pleasant living environment. In addition, the draft
proposes various measures for improving well-being
and the pleasantness of the living environment.
Personal injuries in road traffic will decrease.
36 Name of presentation 16.11.2018The volume of road traffic must be Roads especially to be considered in terms of health
hazards
reduced according to plans in order Air noise envelope 2025
to deliver positive health effects. 60dB
55dB
conservation and green areas
Approved transport projects / projects under construction
Planned transport projects
Dependence on private cars will continue
high in the area outside of rail centers.
Compact construction beside busy roads Over 500
poses a challenge to providing a healthy
environment. On the other hand, infill
development also offers opportunities for
combating the current adverse health
impacts of traffic.
In further planning, it is possible to
effectively control the intensity of the
impacts through area borders and planning
solutions.
16.11.2018The measures in the 2050 plan support the achievement of the MAL 2019 goals The measures identified are strategically important in view of regional developments. Reducing greenhouse gas emissions and achieving the carbon neutrality goal by 2050 require the use of strong mitigation measures, which must begin immediately. The preparation of the rail vision and the related implementation path provide a good starting point for developing the region and for prioritizing transport projects after 2030. Improving regional, national and international accessibility must also be taken into consideration in the long term. 38
Critical issues after 2030 that must be already be prepared for and anticipated through planning: Mitigating climate change and implementing carbon neutrality in all fields of urban planning Adapting to extreme weather conditions Enabling population growth beyond predicted levels Controlling social changes Technological and service development 39 16.11.2018
Identifying risk factors in the plan
                            Delay in the introduction
 Vehicle stock renewal          of road pricing         Uncertainties in financing
          rate

   Preconditions for
 implementing land use                                  Rise in transport project
                            Speed of climate change               costs
                               (CO2 emissions)

Failure to achieve more                                    Fluctuations in the
compact urban structure                                     macro-economy

     Speed of population           Increased            Uncertainties in housing
          growth                  segregation                 production
40
The 2030 operating environment prepared for through
MAL planning
The city becomes more compact and Effects of climate change materialize
shifts to rail Environmentally efficient solutions are utilized.
Urbanization continues and the urban structure Extreme weather conditions become more
becomes more compact. common.
An increasing number of journeys are made by Incident management and preparedness are
foot or bicycle. strengthened.
There is more demand for rail links. Prices of fossil fuels rise.
The population is more aged and multicultural.
Ways of working are diversified.
New financing methods and modes of Digitalization is part of the everyday
transport life
Public sector financing opportunities decrease. Telecommunication connections replace some of
New ways of financing are found for investments the need to travel.
and maintenance. Services are based on up-to-date information.
New transport services are developed. Different modes of transport are combined
Barriers between passenger transport and logistics seamlessly.
41 change. Automation of transport has proceeded to the road
and street network.You can also read