MALAYSIA IN FOCUS: JUNE 2018 - HVS.com

Page created by William Williamson
 
CONTINUE READING
MALAYSIA IN FOCUS: JUNE 2018 - HVS.com
JUNE 2018

          IN FOCUS:
          MALAYSIA
          REINVIGORATED OPPORTUNITIES

                                                         Jeremy Teo
                                                         Analyst

                                                         Chee Hok Yean
                                                         President

HVS.com           HVS Singapore | 137 Market Street, #04-02 Grace Global Raffles, Singapore 048943
MALAYSIA IN FOCUS: JUNE 2018 - HVS.com
MALAYSIA   IN FOCUS: MALAYSIA | PAGE 1
MALAYSIA IN FOCUS: JUNE 2018 - HVS.com
MALAYSIA – COUNTRY OVERVIEW

The Federation of Malaysia, located in
Southeast Asia, comprises 13 states and three
federal territories covering a total area of
329,847 square kilometres across Peninsula
Malaysia and East Malaysia.
                                                           Tourism Highlights
Malaysia’s population is approximately 31.4
million (2017 government estimate) with 62%
being of Malay heritage. The country’s diversity        Total number of hotel guests increased by
is reflected in the share of different ethnic      1        6.8% y-o-y to record 77.3 million
groups, such as Chinese, Indians and
Indigenous, in its total population.

According to the World Travel & Tourism
Council (WTTC), the direct and total                   Uplift in nation-wide hotel performance
contribution of Travel & Tourism to Malaysia’s          with increase in both occupancy and
                                                   2
Gross Domestic Product (GDP) was 4.9% and                             average rates
13.4%, respectively of the total GDP in 2017,
making tourism one of the key supporting
industries by the economy.
                                                           Tourism Tax of MYR10 per night per
In May 2018, Pakatan Harapan (PH) took over                room implemented from September
                                                   3
the office from the United Malays National                    2017 for all accommodation
Organisation (UMNO) party and its Barison                      establishments nationwide.
Nasional (BN) coalition government who has
been in office since independence in 1957.

The change in government has ushered in a new             Removal of the country’s Goods and
era filled with optimism but uncertainty about     4     Services Tax (GST) of 6%; to be replaced
the direction that the country is headed for. As            by Sales and Services Tax (SST) in
of June 2018, GST has been abolished and                            September 2018
several major infrastructural projects are under
review as PH demonstrated a stern stance
towards fiscal commitment.

                                                                   IN FOCUS: MALAYSIA | PAGE 2
MALAYSIA IN FOCUS: JUNE 2018 - HVS.com
Economy Highlights
                                             Figure 1: Key Economic Indicators
                                                     Actual                                             Forecast
                                     2013     2014     2015      2016     2017            2018   2019       2020   2021   2022

Real GDP Growth (% change p.a.)       4.7      6.0       5.0      4.2      5.9             5.5    5.4       5.1     5.6    5.4
Consumer Price Index (av; %)          2.1      3.1       2.1      2.1      3.8             2.9    2.7       2.5     2.9    3.4
Budget Balance (% of GDP)            29.7     30.2     30.7      31.2     31.6            32.0   32.5      32.9    33.3   33.7
Current-account Balance (% of GDP)    3.1      2.9       3.2      3.5      3.4             3.4    3.4       3.5     3.3    3.2
Lending Interest Rate (%)             3.5      4.4       3.1      2.3      2.7             2.8    2.3       3.1     3.1    2.6
Exchange Rate (av; MYR:USD)           3.2      3.3       3.9      4.1      4.3             4.1    4.2       4.1     4.0    3.9
                                        Source: Economist Intelligence Unit, April 2018
Economic Performance & Outlook                                    International Relations
In 2017, Malaysia’s economy rebounded after the
                                                                  Malaysia’s relations with Singapore improved in
decline in 2016 and recorded GDP growth rate of
                                                                  recent years, particularly in the area of economic
5.9%, on the back of stronger global economic
                                                                  ties. The Johor Bahru-Singapore Rapid Transit
performances. The growth was driven by the
                                                                  System (RTS) Link Bilateral Agreement was signed
increase in manufacturing and services, as well as
                                                                  in early 2018 and joint development projects such
rebound in the agriculture sector. Seven states
                                                                  as Marina One project at Marina South and the DUO
grew at a faster pace than the national growth
                                                                  project at Ophir-Rochor were completed and met
(5.9%) in 2017 namely Sabah (8.2%), Melaka
                                                                  with great success.
(8.1%), Pahang (7.8%), WP KL (7.4%), Selangor
(7.1%), Johor (6.2%) and WP Labuan (6.1%).
                                                                  In 2017, Malaysia strengthened relationship with
                                                                  US with both nations pledging to improve defense
Going forward, real GDP is expected to grow by an
                                                                  ties, including in the areas of maritime security,
annual average of 5.4% from 2018 to 2022 with
                                                                  counterterrorism, and information sharing
comparatively subdued demand for electronic and
                                                                  between security forces. China remains Malaysia’s
electrical goods, the nation’s largest export
                                                                  largest trading partner since 2009.
category.
Currency Exchange Outlook                                         Following the election held in May 2018, Malaysia
                                                                  underwent a change in government and the
Since 2016, a myriad of factors such as weak                      outlook for international relations is uncertain as it
economic growth, decline in crude oil prices,                     remains to be seen whether the incumbent
depleting foreign exchange reserves and a                         government will take a different approach.
protracted political crisis over 1MDB has
                                                                 Outlook
contributed to the weakening of the Malaysia
Ringgit (MYR).                                                    Since taking over office, the ruling Pakatan
                                                                  Harapan (PH) coalition has abolished goods and
However, since the Trump administration assumed                   services tax (GST) and reviewed spending pledges.
control in 2017, the United States (US) dollar has                Various infrastructural projects are under scrutiny
                                                                  with some possibly facing abandonment.
depreciated in an attempt towards reinvigorating
the country’s manufacturing and exports. As a
                                                                  With the elimination of the MYR21 billion revenue
result, the US Dollar Index (USDX) declined by                    expected to be generated by GST in 2018, the
11.2% in 2017. With the slide in greenback,                       economy could be left overly reliant on the
Malaysian ringgit recovered from the 19-year low                  recovering global oil prices, a major source of
of 4.5 MYR:USD in January 2017 and ended the                      revenue for the nation through petroleum tax and
year with 4.3 MYR:USD.                                            royalties.

                                                                                          IN FOCUS: MALAYSIA | PAGE 3
MALAYSIA IN FOCUS: JUNE 2018 - HVS.com
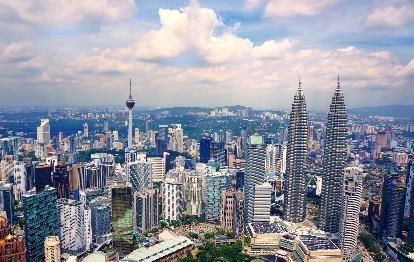
Tourism Market Overview
In 2017, Malaysia remained the second most-visited South East Asian country after Thailand despite
decreasing tourist arrivals. Travel and tourism directly contributed MYR66 billion to the country’s GDP, an
increase from the MYR62 billion the year before, an equivalent of 4.8% of the nation’s total GDP, according
to the World Travel and Tourism Council’s data.
                                            Figure 2: Total International Tourist Arrivals and Tourist Receipts

                               40                                                                                              200

                               35                                                                                              175
                                                                                                                       168
                               30                                                                            151               150

                                                                                                                                     Tourism Receipts
                                                                                                                                     (MYR, in billions)
                                                                                                   134
      International Arrivals

                               25                                                                                              125
           (in millions)

                               20                                                                                              100
                                           65                                           82
                               15                                                                                              75

                               10                                                                                              50

                               5                                                                                               25

                               0                                                                                               0
                                    2013        2014      2015        2016       2017        2018T       2019T     2020T

                                      International Arrivals           Tourist Arrivals Forecast            Tourism Receipts

                                                                 Source: Tourism Malaysia

International Arrivals                                                          Tourist Receipts
Despite a weak ringgit that was perceived to boost                              Despite a decrease in total tourist arrivals, tourist
inbound tourism and having hosted the Southeast                                 expenditure increased marginally by 0.1% in 2017
Asia Games, international arrivals in 2017                                      to reach MYR82.2 billion.
decreased by 3.0% year-on-year to 25.9 million,
short of the 31 million target set for the year. The                            Along with the increase in total tourist receipts in
decline could be attributed to a lack of advertising                            2017, average per capita expenditure increased by
and promotional activities, as reflected by the                                 3.2% to reach MYR3,166.
lower budget allocated for 2016 and 2017.                                       While the average length of stay decreased from
Going forward, the Tourism Malaysia Integrated                                  5.9 nights (2016) to 5.7 nights (2017), average
Promotional Plan 2018-2020 has been formulated                                  spent per diem increased by 6.9% to reach MYR556
to tackle existing challenges and to improve                                    in 2017.
Malaysia’s tourism performance. The plan                                        Going forward, Tourism Malaysia (“TM”) has set
highlights six strategies which includes optimising                             ambitious targets of MYR134 billion in tourist
the use of techonology, leverage on upcoming                                    receipts for 2018, MYR151 billion in 2019 and
major events, synergising with development of                                   MYR168 billion for 2020. In order to achieve 2020
mega projects, enhancing initiatives made under                                 target of MYR168 billion, tourism receipts must
the NKEA, maximising integrated marketing                                       increase by 104.5% from the MYR82 billion
campaigns and promotion Malaysia as a filming                                   achieved in 2017.
destination.

                                                                                                         IN FOCUS: MALAYSIA | PAGE 5
MALAYSIA IN FOCUS: JUNE 2018 - HVS.com
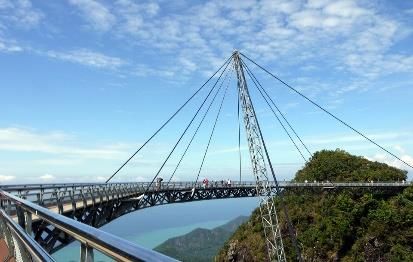
International Source Markets in 2017
                                                                                                Figure 3: Top Five Feeder Markets in 2017 (% share)
❑ Asian countries account                                        for      92%    of
  international arrivals
❑ Top five source markets account for 79% of                                                                      21%
  international arrivals in 2017
❑ Changes to Top 10 source markets:
                                                                                                                                                                  46%
• Highest 2017 Y-o-Y increase: Brunei with                                                                  6%
  19.4%
• Highest 2017 Y-o-Y decrease: India with                                                                    7%
  13.4%, decrease for the third consecutive year
❑ UK is the strongest European country with                                                                       9%
  359,000 arrivals, representing 1.3% of total                                                                               10%
  arrivals
❑ Singapore and Indonesia, the top two source                                                              Singapore         Indonesia                            China
  markets, both recorded Y-o-Y decline in 2017                                                             Thailand          Brunei                               Others

Visit Malaysia 2020 Target                                                                                        Source: Tourism Malaysia

➢ Welcoming 36 million international passengers
  (expected 38.7% increase from 2017)

➢ Increasing arrivals from China to 8 million, a 300%
  increase from 2017

Hotel Guests and Tourism Promotion
Although international arrivals decreased in 2017, total hotel guests in Malaysia increased by 6.8% y-o-y to
77.3 million from 72.3 million in 2016. Of the total 4.9 million increase in hotel guests, 2.1 million are
increase in foreign hotel guests while 2.8 million are increase in domestic hotel guests. Historically,
domestic hotel guests have always accounted for majority of the total guests and continue to do so in 2017
with 49.2 million, 64% of total hotel guests.

                                                             Figure 4: Hotel Guests in Malaysia (2013-2017)
                                             90                                                                                    32%
                                             80                                                                                    28%
            No. of Hotel Guests (Millions)

                                                                            25.4%
                                                                                                                       64%

                                             70                                                                                    24%
                                                                                                                                         Y-o-y Growth Rates (%)
                                                                                                     64%
                                                                    63%

                                                                                      64%

                                             60                                                                                    20%
                                                     60%

                                             50                                                                                    16%
                                             40                                                                                   12%
                                             30                                                                              6.8% 8%
                                                                                                           1.2%
                                                                                                                       36%

                                             20                                                                                    4%
                                                                    37%

                                                                                                     36%
                                                                                      36%
                                                     40%

                                                                                            -0.2%
                                             10                                                                                    0%
                                             0                                                                                     -4%
                                                    2013           2014             2015            2016              2017

                                                  Foreign Hotel Guests          Domestic Hotel Guests               Growth Rate (%)
                                                                          Source: Tourism Malaysia

                                                                                                                  IN FOCUS: MALAYSIA | PAGE 6
MALAYSIA IN FOCUS: JUNE 2018 - HVS.com
Hotel Supply
From 2016 to 2017, hotel supply in Malaysia                                          As of May 2018, an addition of 100 hotels, with
increased by 19 classified hotels to reach 4,980                                     25,589 classified rooms have been publicly
hotels and 325,700 rooms.                                                            announced for the period of 2018-2022.
To accommodate the estimated growth in tourist
demand projected for the upcoming years (as
highlighted in Figure 1), a significant number of
hotel projects is expected to enter the market.
                    Figure 5: Existing tourism accommodation and future classified** hotel supply in Malaysia (2016-2022)

            5,200                                                                                                                       400

                                                                                                                                              Room Inventory (in thousands)
            5,100                                                                                                                       350

            5,000                                                                                                                       300
No. of Hotels

            4,900                                                                                                                       250

            4,800                                                                                                                       200

            4,700                                                                                                                       150

            4,600                                                                                                                       100

            4,500                                                                                                                       50
                        2016              2017               2018           2019             2020         2021                2022
                                                             Existing Hotel Supply                   New Supply
                                                            Source: Tourism Malaysia, HVS Research
                                        * tourism accommodation refers to hotels, hostels and guest houses
                        * * classified hotels refers to economy, midscale, upper midscale, upscale, upper upscale and luxury hotels

      Classified Hotel Supply by Segment

  Of the 100 hotels that will commence operation in                                  While new luxury supply are only limited to 14
  Malaysia by 2022, majority belongs to the Upscale                                  hotels, these includes debut for international
  segment. Both Upscale and Upper Upscale hotels                                     brands such as Banyan Tree and W Hotels.
  accounts for 62% of total additional hotel supply,                                 Economy supply makes up the minority of new
  amounting to a total of approximately 16,600                                       supply with two hotels, 270 rooms.
  rooms.

                                       Figure 6: Future Classified Hotel Supply by Segment (2018-2022)

                                   Hotel Supply                                                        Room Supply
                                                 Economy                                                            Economy
                                                    2%                                                                 1%

                                 Luxury                                                                  Luxury    Midscale
                                                 Midscale
                                  14%                                                                     10%        8%
                                                   9%

                                                  Upper Midscale                                                       Upper Midscale
                                                      15%                                    Upper Upscale                 16%
                      Upper Upscale                                                              25%
                          24%

                                                  Upscale                                                            Upscale
                                                   36%                                                                40%

                                                                      Source: HVS Research
                                                                                                             IN FOCUS: MALAYSIA | PAGE 7
MALAYSIA IN FOCUS: JUNE 2018 - HVS.com
Classified Hotel Supply by State
In order to set the focus on regional highlights by State, the following tables highlight the six States with the
most upcoming supply, accounting for 85% of total future hotel supply and 54% of new room supply.

                                                    Figure 7: Future classified Hotel Openings by State (2018-2022)
                                      HOTELS                                          2018         2019     2020        2021         2022     Total
                                      Kuala Lumpur & Petaling Jaya                     13            5        4           6            8       36
                                      Johor                                             8            3        2           1            2       16
                                      Sabah                                             4            4        2           -            2       12
                                      Penang                                            1            1        2           1            2        7
                                      Melaka                                            -            2        3           2            1        8
                                      Langkawi                                          -            3        2           1            -        6
                                      Total                                            26           18       15          11           15       85
                                      ROOMS                                           2018 2019 2020 2021 2022                                Total
                                      Kuala Lumpur & Petaling Jaya                   2,885 1,180 903 1,771 2,238                               8,977
                                      Johor                                          1,720 683    586   318   800                              4,107
                                      Sabah                                          1,113 937    666     -   557                              3,273
                                      Penang                                          135    98   408   288   320                              1,249
                                      Melaka                                            -   525   530   710   300                              2,065
                                      Langkawi                                          -   625   600   200     -                              1,425
                                      Total                                          5,853 4,048 3,693 3,287 4,215                            21,096
                                                                              Source: HVS Research
Hotel Performance

Despite the decrease in international arrivals in 2017, the increase in hotel guests to Malaysia translated
into higher demand for tourist accommodations. As a result of accommodating the 77.3 million hotel guests
with limited growth in supply (20 classified hotels in 2017), occupancy increased from 64% to 67% with
average daily rates of hotels increasing by 5.4% y-o-y to MYR 365.

As of the first quarter of 2018, demand has remained strong with occupancy increasing by 21 basis point
and average rate 0.7% higher y-o-y. Looking ahead, with main bulk of the supply coming on board in the
second half of 2018, it remains to be seen if the demand will continue outweighing supply for the year.

                                                       Figure 8: Malaysia Overall Hotel Performance (2013-2017)

                                500                                                                                                                       70.0%

                                400             68%                                                                                                       68.0%
                                                                                                                  67%                               67%
                                                                                                                         374

                                                                                                                                            371
                                        369

                                                                                                          365
                                                          360

                                                                                                                                                                  Occupancy (%)
                                                                       354

                                                                                       346
     Average Daily Rate (MYR)

                                300                              66%                                                                                      66.0%
                                                                                                                                 65%
                                                                                               64%
                                              250

                                                                                                                                                  249
                                                                                                                245

                                                                                                                               244
                                                                237

                                200                                                                                                                       64.0%
                                                                                             223
                                                                             221

                                                                               63%
                                100                                                                                                                       62.0%

                                 0                                                                                                                        60.0%
                                        2013             2014          2015            2016               2017          Q1 2017         Q1 2018

                                                     Average Daily Rate            Revenue per Available Room                   Occupancy

                                                                               Source: HVS Research

                                                                                                                                IN FOCUS: MALAYSIA | PAGE 8
MALAYSIA IN FOCUS: JUNE 2018 - HVS.com
Destination Highlights – Johor Bahru
                                                           Johor Bahru is the capital of the Malaysian state of Johor located on the southern tip of
                                                           Peninsular Malaysia. Acting as the Southern Gateway to Malaysia. With a land area of
                                                           1,064 km2 and population of approximately 1.33 million, the Johor Bahru district is
                                                           famed for its rich culture and diversity in food. In terms of accessibility, Johor Bahru is
                                                           well connected with Senai International Airport providing connection to 11 domestic
                                                           cities in Malaysia and eight international cities in the Asia region.
Hotel Guests
In 2017, total hotel guests in Johor Bahru increased by a 6.5% y-o-y, recording 5.3 million in 2017. Johor
Bahru hotel guests are predominantly driven by the domestic market which accounts for 60% of total
share, and represents 245,000 of the 324,000 increase in hotel guests in 2017.
                                                                           Figure 9: Hotel Guests in Johor Bahru (2015-2017)
                                                           7                                                                                 7%
                                                                                                                                     6.5%
                No. of Hotel Guests (Millions)

                                                           6                                                                                 6%

                                                                                                                                                   Y-o-y Growth Rates (%)
                                                           5                                                                                 5%
                                                                                                                          60%
                                                                                                    59%
                                                                            59%

                                                           4                                                                                 4%
                                                           3                                                                                 3%
                                                           2                                                                                 2%
                                                                                                                          40%
                                                                                                    41%
                                                                            41%

                                                           1                                                1.2%                             1%
                                                           0                                                                                 0%
                                                                          2015                     2016                 2017

                                                                   Foreign Hotel Guests         Domestic Hotel Guests            Growth Rate (%)
                                                                                          Source: Tourism Malaysia
Classified Hotel Supply and Hotel Performance
From 2015 to 2017, total classified hotel supply in Johor Bahru increased by 15.2% to approximately
12,300 rooms. Most of the existing hotel supply are in the midscale segment with 66% share, while
there is still no luxury supply in Johor Bahru. Occupancy in Johor Bahru decreased from 66.6% to
62.7% with the influx of new supply.
                                                                     Figure 10: Classified Hotel Supply in Johor Bahru (2015-2017)
                                                           14                                                                               67%
                                                                                    66.6%          11,900               12,300
                             No. of Units (in thousands)

                                                           12                                                                               66%
                                                                           10,600
                                                                                                   25%                  25%
                                                           10                                                                               65%
                                                                                                                                                  Occupancy (%)

                                                                           26%
                                                               8                                            63.8%                           64%
                                                               6                                                                            63%
                                                                                                   66%                  66%         62.7%
                                                               4           67%                                                              62%
                                                               2                                                                            61%
                                                               0            7%                      8%                  9%                  60%
                                                                           2015                    2016                 2017

                                                                       Economy      Midscale     Upscale    Luxury        Occupancy
                                                                                        Source: HVS Research
                                                                                                                                  IN FOCUS: MALAYSIA | PAGE 9
Supply Pipeline
With an increase in visitations to Johor Bahru translating to the increase in hotel guests, more international
operators are also set to enter the region as they identify the rising demand for accommodation. Within the
next three years, hotel brands such as Melia, Shama, Pan Pacific, Novotel, Hilton Garden Inn, Citadines,
Holiday Inn and ibis Styles are set to debut in Johor Bahru.
                                                  Figure 11: Pipeline Classified Hotel Supply in Johor Bahru (Existing – 2020F)
                                             16
                                                                                                      13,900               14,200
                                             14                                  13,200
               No. of Units (in thousands)

                                                           12,300
                                             12                                                       31%                   32%
                                                                                 28%
                                                            25%
                                             10
                                             8
                                             6
                                                            66%                  64%                  62%                   60%
                                             4
                                             2
                                             0              9%                    8%                    8%                   7%
                                                          Existing               2018F                2019F                 2020F

                                                                     Economy      Midscale    Upscale        Luxury
                                                                               Source: HVS Research
Infrastructural Projects
Two key infrastructural projects that will provide a boost to the destination have been highlighted below:

      ▪ Malaysia-Singapore Rapid Transit                                                        ▪ Iskandar Malaysia Bus Rapid
        System (RTS)                                                                              Transit (IMBRT)
          ✓ MYR4 billion investment                                                                 ✓ MYR2.6 billion investment
          ✓ Reduce congestion at border                                                             ✓ Improve connectivity from Johor
             crossings between Singapore                                                               Bahru to Skudai, Johor Jaya and
             and Malaysia                                                                              Nusajaya
          ✓ Slated to complete by 2024                                                              ✓ Phase 1 slated to complete by
                                                                                                       2021

Outlook

                                                                          •Momentum for growth in hotel guests is expected
                                                                           to continue
                                                                          •Supply pipeline indicates operators’ confidence in
                                                                           demand growth going forward
                             Outlook
                                                                          •Key infrastructural projects to drive demand
                                                                           growth and popularity of destination

                                                                          •Improvement in flight connectivity to the region
                                                                          •Increase in destination marketing of Johor Bahru
         Recommendation(s)

                                                                                                                      IN FOCUS: MALAYSIA | PAGE 9
Destination Highlights – Kuala Lumpur
                                                        Kuala Lumpur is the national capital of the Malaysia and is located centrally in the state
                                                        of Selangor. With a land area of 243 km2 and population of approximately 1.79 million,
                                                        Kuala Lumpur is often considered the cultural centre of Peninsular Malaysia. In terms of
                                                        accessibility, Kuala Lumpur is accessible via Kuala Lumpur International Airport which
                                                        is located 50 metres south of the capital and caters for 49 different international
                                                        airlines.
Hotel Guests
As the national capital, Kuala Lumpur is also the state with the most hotel guests in the nation. In 2017,
total hotel guests increased by a 11.3% y-o-y, recording 18 million in 2017. Kuala Lumpur is the only state
in Malaysia that has more foreign hotel guests than domestic hotel guests.
                                                                   Figure 12: Hotel Guests in Kuala Lumpur (2015-2017)
                                                        20                                                                        20%
                                                        18                                                                        18%
                No. of Hotel Guests (Millions)

                                                                                                                   40%

                                                                                                                                         Y-o-y Growth Rates (%)
                                                        16                                                                        16%
                                                                                               42%
                                                                       41%

                                                        14                                                                        14%
                                                        12                                                                        12%
                                                                                                                            11.3%
                                                        10                                                                        10%
                                                                                                                   60%

                                                         8                                                                        8%
                                                                                               58%
                                                                       59%

                                                         6                                                                        6%
                                                         4                                                                        4%
                                                         2                                            1.6%                        2%
                                                         0                                                                        0%
                                                                     2015                    2016                 2017

                                                             Foreign Hotel Guests         Domestic Hotel Guests          Growth Rate (%)
                                                                                    Source: Tourism Malaysia

Classified Hotel Supply and Hotel Performance
From 2015 to 2017, total classified hotel supply in Kuala Lumpur increased by 9.2% to approximately
39,000 rooms. Majority of the existing hotel supply are in the upscale and midscale segment with 44% and
43% share respectively. Occupancy in Kuala Lumpur decreased from 67.1% to 66.1% with the influx of new
supply.
                                                             Figure 13: Classified Hotel Supply in Kuala Lumpur (2015-2017)
                                                        45                                                                        69%
                          No. of Units (in thousands)

                                                        40                                   37,600               39,000          68%
                                                                    35,700
                                                                              67%            10%                  11%
                                                        35           10%                                                         67%
                                                                                                                                        Occupancy (%)

                                                        30                                             66%                   66% 66%
                                                        25                                   44%                  44%             65%
                                                                     46%
                                                        20                                                                        64%
                                                        15                                                                        63%
                                                        10                                   43%                  43%             62%
                                                                     40%
                                                         5                                                                        61%
                                                                              3%                       3%                    3%
                                                         0                                                                        60%
                                                                     2015                    2016                 2017

                                                                 Economy      Midscale     Upscale    Luxury        Occupancy
                                                                                  Source: HVS Research
                                                                                                                           IN FOCUS: MALAYSIA | PAGE 9
Supply Pipeline
The hotel industry in Kuala Lumpur is set to increase in competitiveness as existing hotels undergo
renovations to remain competitive and new internationally-branded hotels enter the market. Within the
next three years, four thousand additional rooms are set to be added, and the capital will welcome its first
Park Hyatt, Four Seasons, Banyan Tree and W hotels.
                                                  Figure 14: Pipeline Classified Hotel Supply in Kuala Lumpur (Existing – 2020F)
                                             50
                                                                                                      42,600              43,000
                                             45                                  41,600
                                                            39,000
               No. of Units (in thousands)

                                             40                                  12%                  12%                  12%
                                                            11%
                                             35
                                             30
                                                                                 44%                  43%                  42%
                                             25             44%
                                             20
                                             15
                                             10             43%                  41%                  43%                  43%
                                             5
                                             0                        3%                  3%                   3%                  3%
                                                          Existing               2018F                2019F                2020F

                                                                     Economy      Midscale     Upscale      Luxury
                                                                               Source: HVS Research
Infrastructural Projects
Two key infrastructural projects that will provide a boost to the destination have been highlighted below:

      ▪ High Speed Railway (HSR) Project*                                                       ▪ Mass Rapid Transit (MRT) 2
          ✓ MYR65 billion investment                                                               ✓ MYR32 billion investment
          ✓ Reduce travel time between                                                             ✓ Improve        chronic    traffic
             Singapore and Kuala Lumpur to                                                            congestion in Kuala Lumpur
             1.5 hours                                                                             ✓ Slated to complete by 2022
          ✓ Slated to complete by 2026                                                             ✓ MRT 3 scrapped after election
       *Under review post May 2018 election.
Outlook

                                                                           •Hotel guests to continue increasing with
                                                                            improved connectivity
                                                                           •Entry of internationally known brands and
                                                                            renovated hotels to improve attractiveness of
                             Outlook                                        destination
                                                                           •Key infrastructural projects to drive demand
                                                                            growth and popularity of destinations

                                                                           •Increase in MICE marketing effort for the destination
         Recommendation(s)

                                                                                                                     IN FOCUS: MALAYSIA | PAGE 9
Destination Highlights – Langkawi
                                                        Langkawi, the Jewel of Kedah, is a district and an archipelago of more than a hundred
                                                        islands that is located west of the northern tip of Peninsular Malaysia. With a land area
                                                        of 479 km2 and population of approximately 86,000, Langkawi is a tropical paradise
                                                        that is recognized for its natural beauty and is Southeast Asia’s first UNESCO World
                                                        Geopark. Langkawi is accessible via Langkawi International Airport which is currently
                                                        served by six international and one domestic airlines.
Hotel Guests
Besides Kuala Lumpur, Langkawi is the region with the second highest increase in hotel guests in 2017. The
distribution of foreign and domestic hotel guests have remained at similar proportions since 2015 with
both segments experiencing the similar level of growth throughout this period.
                                                                     Figure 15: Hotel Guests in Langkawi (2015-2017)

                                                        3.5                                                                          14%
                No. of Hotel Guests (Millions)

                                                        3.0                                                                          12%

                                                                                                                                            Y-o-y Growth Rates (%)
                                                                                                                      53%
                                                        2.5                                                                          10%
                                                                                               54%

                                                                                                                              9.0%
                                                                        53%

                                                        2.0                                           8.0%                           8%
                                                        1.5                                                                          6%
                                                                                                                      47%

                                                        1.0                                                                          4%
                                                                                               46%
                                                                        47%

                                                        0.5                                                                          2%
                                                        0.0                                                                          0%
                                                                       2015                   2016                  2017

                                                              Foreign Hotel Guests          Domestic Hotel Guests           Growth Rate (%)
                                                                                     Source: Tourism Malaysia

Classified Hotel Supply and Hotel Performance
Approximately half of total classified hotel supply in Langkawi are from the midscale segments, which
comprises mainly of independent branded hotels located in Kuah and Cenang vicinity. In 2017, Ritz-Carlton
opened and increased luxury supply with 119 units. Over the last three years, occupancy has increased
from 57% to 65%, indicating increasing demand for accommodation supply in Langkawi.
                                                                 Figure 16: Classified Hotel Supply in Langkawi (2015-2017)
                                                        7                                                                            69%
                                                                                                                    6,100
                          No. of Units (in thousands)

                                                                     5,900                   6,000
                                                        6                                                                            67%
                                                                      9%                     10%                    12%
                                                        5                                                                      65% 65%
                                                                                                                                           Occupancy (%)

                                                                     31%                     31%                    30%
                                                        4                                            63%                             63%
                                                        3                                                                            61%
                                                        2            51%                     50%                    49%              59%
                                                        1                     57%                                                    57%
                                                        0             8%                      8%                    8%               55%
                                                                     2015                    2016                   2017

                                                                  Economy      Midscale     Upscale    Luxury          Occupancy
                                                                                   Source: HVS Research                   IN FOCUS: MALAYSIA | PAGE 9
Supply Pipeline
Over the next three years, total classified hotel supply in Langkawi will increase by 20% to 7,400 units.
These include the additions of PARKROYAL, aloft, ibis Styles, Wanda and Mercure which will further expand
on both the upscale and midscale hotel supply. As of now, no new luxury supply is expected to enter into
Langkawi for the foreseeable future.
                                                 Figure 17: Pipeline Classified Hotel Supply in Langkawi (Existing – 2020F)
                                             8
                                                                                                                         7,400
                                             7                                                    6,800                  10%
                                                                             6,100
               No. of Units (in thousands)

                                                        6,100                                      11%
                                             6
                                                        12%                  12%
                                             5                                                                           36%
                                                                                                   34%
                                                        30%                  30%
                                             4
                                             3
                                             2          49%                  49%                   47%                   47%

                                             1
                                             0           8%                   8%                   7%                     7%
                                                      Existing              2018F                 2019F                 2020F

                                                                 Economy      Midscale     Upscale        Luxury
                                                                           Source: HVS Research
Infrastructural Projects
Two key infrastructural projects that will provide a boost to the destination have been highlighted below:

      ▪ Langkawi International Airport                                                       ▪ Tropicana Cenang
        Expansion Phase 1                                                                        ✓ MYR1.94        billion     gross
          ✓ MYR89 million investment                                                               development value
          ✓ Expansion of the parking area                                                        ✓ 1,102 residences and 350 hotel
          ✓ To be completed in 2018                                                                rooms with retail components
          ✓ Phase 2 to include construction                                                      ✓ Slated for 2023 completion
            of aerobridge
 Outlook

                                                                        •Momentum for increase in hotel guests is
                                                                         expected to continue
                                                                        •Limited luxury supply in the pipeline
                                                                        •Entry of international brands expected to
                             Outlook                                     increase awareness of the destination

                                                                        •Improvement in flight connectivity to Langkawi
         Recommendation(s)

                                                                                                                   IN FOCUS: MALAYSIA | PAGE 9
Destination Highlights – Penang
                                                     The state of Penang is situated on the northwest coast of Peninsular Malaysia. The
                                                     region comprises of Penang island, where capital city George Town is located, and
                                                     Seberang Perai. With a land area of approximately 1,048 km2 and a population of 1.75
                                                     million, Penang is renowned for its diversity in ethnicity, culture, language and religion.
                                                     In terms of accessibility, Penang International Airport provides direct access with 18
                                                     international airlines.
Hotel Guests
Hotel guests in Penang has experienced limited growth from 2015 to 2017. The state has approximately 2.9
million foreign hotel guests and 3.5 million domestic hotel guests throughout all three years.
                                                                    Figure 18: Hotel Guests in Penang (2015-2017)

                                                     7                                                                                4%
                 No. of Hotel Guests (Millions)

                                                     6                                                                                3%

                                                                                                                      54%
                                                                                           54%
                                                                   55%

                                                                                                                                            Y-o-y Growth Rates (%)
                                                     5                                                                                2%
                                                     4                                                                                1%
                                                                                                  0.5%
                                                     3                                                                         0.0%   0%
                                                                                           46%

                                                                                                                      46%
                                                                   45%

                                                     2                                                                                -1%
                                                     1                                                                                -2%
                                                     0                                                                                -3%
                                                                 2015                    2016                       2017

                                                          Foreign Hotel Guests          Domestic Hotel Guests                Growth Rate (%)
                                                                                 Source: Tourism Malaysia
Classified Hotel Supply and Hotel Performance
Along with the stagnation in hotel guests in Penang, classified hotel supply has remained fairly stable from
2015 to 2017. Over the three years, the addition to supply are the 10-key Jawi Peranakan Mansion and the
222-key Lexis Suites Penang. Market-wide occupancy decreased from 64% in 2016 to 62% in 2017 to
reflect the lack of demand growth and the increase in supply.
                                                               Figure 19: Classified Hotel Supply in Penang (2015-2017)
                                                     14                                                                               69%
                                                                 12,600                  12,800                     12,800
                                                                   7%                     7%                         7%
                       No. of Units (in thousands)

                                                     12                                                                               67%
                                                     10           32%                     31%                       31%               65%
                                                                                                                                            Occupancy (%)

                                                                           64%                       64%
                                                      8                                                                               63%
                                                                                                                                62%
                                                      6                                                                               61%
                                                                  51%                     52%                       52%
                                                      4                                                                               59%
                                                      2                                                                               57%
                                                                  11%                     10%                       10%
                                                      0                                                                               55%
                                                                  2015                   2016                       2017

                                                              Economy      Midscale        Upscale         Luxury      Occupancy
                                                                                  Source: HVS Research
                                                                                                                              IN FOCUS: MALAYSIA | PAGE 9
Supply Pipeline
The Penang hotel market will receive a boost from the additions of several internationally-branded hotel
supply over the next three years. These include brands such as Doubletree Resort by Hilton, OZO, Angsana,
Courtyard, Citadines and Capri by Fraser. As of 2017, approximately 60% of total existing supply are
operated by non-international operators.
                                                  Figure 20: Pipeline Classified Hotel Supply in Penang (Existing – 2020F)
                                             16                                                                          14,300
                                                                                                   13,900
                                                                              13,600
                                             14         13,100
               No. of Units (in thousands)

                                                                                                     7%                   7%
                                                          6%                   6%
                                             12
                                                                               34%                 35%                   37%
                                             10          33%
                                             8
                                             6
                                                         50%                   50%                 49%                   47%
                                             4
                                             2
                                                         10%                   10%                 10%                    9%
                                             0
                                                       Existing               2018F                2019F                 2020F

                                                                  Economy      Midscale    Upscale        Luxury
                                                                            Source: HVS Research
Infrastructural Projects
Two key infrastructural projects that will provide a boost to the destination have been highlighted below:

      ▪ Penang’s mega projects                                                               ▪ Penang     International   Airport
          ✓ MYR46 billion investments                                                          Expansion
          ✓ Construction of underwater                                                           ✓ MYR700 million investment
            tunnel, three major highways,                                                        ✓ Double capacity to 12 million
            Southern Penang reclamation                                                            passengers
            projects, Penang Sky Cab and                                                         ✓ All three phases to complete by
            Light Rail Transit (LRT)                                                               2029

Outlook

                                                                       •The entry of new internationally branded hotels
                                                                        will improve awareness of the destination
                                                                       •Positive infrastructural projects will drive
                                                                        demand growth
                           Outlook                                     •Remains to be seen if the mega projects will be
                                                                        affected by the change in government

                                                                       •Increase in destination marketing of Penang
         Recommendation(s)

                                                                                                                   IN FOCUS: MALAYSIA | PAGE 9
Investment
In 2017, total volume hotel investments across                                The most noteworthy findings in 2017:
Malaysia recorded a new high of approximately
                                                                              ▪ Four Seasons Resort Langkawi
MYR1,974 million. The sale of the Renaissance
                                                                                  ✓ First Langkawi transaction in 5 years
Kuala Lumpur for MYR765 million accounted for
                                                                                  ✓ MYR4,224,000 per key, highest per key
38.8% of the total amount. All 6 publicly available
                                                                                     value historically
hotel transactions in the year took place across the
four regions covered in our destination highlights,                           ▪ Transactions in Penang
possibly indicating investors’ interest in these area.                            ✓ Most number of transactions in a state
                                                                                  ✓ Transaction average MYR892,000 per key,
                                                                                    higher than the MYR831,000 per key for
                                                                                    Renaissance Kuala Lumpur
                  Figure 21: Publicly Available Hotel Transactions Across Four Selected Regions (2013-2017)
                  (Number of transactions per year)

                                       2,500
                                                                                                            6
                                       2,000
                       Million (MYR)

                                       1,500

                                       1,000                                   5
                                                       5           5                          5
                                        500

                                          0
                                                  2013          2014         2015            2016          2017

                                               Johor       Kuala Lumpur        Langkawi           Penang
                                                            Source: HVS Research, RCA 2018

                                                               OUTLOOK
Despite recording a slide in international tourist                            The strong growth and performance was reflected
arrivals to 25.9 million in 2017, the Malaysia                                in the performance of both Kuala Lumpur and
Ministry of Tourism and Culture has set an                                    Langkawi as demand continues to outpace supply.
ambitious target of 33.1 million arrivals for 2018,                           However, in Langkawi, limited connectivity and the
reflecting confidence for growth in arrivals in the                           lack of infrastructural investments could curb the
near term. Contrary to international tourist                                  demand growth going forward.
arrivals, the domestically driven tourism market in
Malaysia remains buoyant with total hotel guests                              Elsewhere, in Johor Bahru, hotel guests have
increasing by 6.8% to 77.3 million.                                           increased significantly in 2017 and with exciting
                                                                              supply in the pipeline, the region is well primed to
The year also saw the introduction of 19 new hotels                           realise its potential as a regional hub. At the
bringing 3,728 keys into the market. Notable                                  eclectic Penang, the hotel market has remained
additions include the first Element and first Sofitel                         level for the past three years. However, the area
hotel in Kuala Lumpur, and the 119-key luxury                                 will be revitalised with the improvement in
Ritz-Carlton Langkawi. Hotel performances across                              accommodation        supply     and    the     mega
the nation demonstrated strong growth, with                                   infrastructural projects enhancing connectivity.
improved occupancy and average rate as compared
to 2016 with RevPAR increasing by a significant                               Going forth, the outlook for tourism industry
9.9% to MYR 245.                                                              remains optimistic. The market will likely benefit
                                                                              from the myriad of factors, including the
                                                                              abolishment of GST and improvement in flight
                                                                              accessibility to the country.
                                                                                                           IN FOCUS: MALAYSIA | PAGE 12
About HVS                                                         About the Authors
HVS, the world’s leading consulting and services organization                          Jeremy Teo is an Analyst with
focused on the hotel, mixed-use, shared ownership, gaming,                             HVS Singapore. He graduated
                                                                                       with a Bachelor of Science
and leisure industries, celebrated its 35th anniversary in                             degree in Real Estate from
2015. Established in 1980, the company performs 4,500+                                 National       University   of
assignments each year for hotel and real estate owners,                                Singapore. He has conducted
operators, and developers worldwide. HVS principals are                                numerous assignments across
                                                                                       regional markets that includes
regarded as the leading experts in their respective regions of                         Australia, Indonesia, Japan,
the globe. Through a network of more than 50 offices and                               Malaysia, Maldives, Papua
more than 300 professionals, HVS provides an unparalleled         New Guinea, Vietnam and Singapore. jteo@hvs.com
range of complementary services for the hospitality industry.
HVS.com                                                                                   Hok Yean Chee is the President
                                                                                          of HVS Asia Pacific. She has over
                                                                                          30 years of experience in more
                                                                                          than 30 markets across 23
    Superior Results through Unrivalled Hospitality                                       countries      in   Asia    Pacific,
                                                                                          providing real estate investment
              Intelligence. Everywhere.                                                   advisory services for a wide
                                                                                          spectrum of property assets. Her
                                                                                          forte lies in providing investment
                                                                                          advisory on hotels and serviced
HVS ASIA PACIFIC is represented by eight offices in               apartments including brokerage, strategic analyses,
Singapore, Bangkok, Beijing, Hong Kong, Mumbai, New Delhi,        operator search, market feasibility studies, valuations
Shanghai and Shenzhen. HVS also hosts main annual industry        and litigation support. hychee@hvs.com
events in the region, such as the China Hotel Investment
Conference (CHIC). Additionally, HVS publishes a wide range
of leading research reports, articles and surveys, which can
be downloaded from our online library (HVS.com/Library).

HVS SINGAPORE has worked on a broad array of projects
that include economic studies, valuations, feasibility studies,
operator search and management contract negotiation,
development strategies for new brands, asset management,
research reports and investment advisory for hotels, resorts,
serviced residences and branded residential development
projects.

HVS.com                        HVS Singapore | 137 Market Street, #04-02 Grace Global Raffles, Singapore 048943
You can also read