Managing urban heat in
water sensitive cities:
research and policy responses
Dr Kerry Nice
May 2021
←
→
Page content transcription
If your browser does not render page correctly, please read the page content below
Managing urban heat in water sensitive cities: research and policy responses Dr Kerry Nice May 2021
2 | Managing urban heat in water sensitive cities: research and policy responses

Managing urban heat in water sensitive cities: research and policy responses

Authors
Dr Kerry Nice (CRCWSC, Monash University, University of Melbourne)

Acknowledgments
A/Prof. Briony Rogers, Malcolm Eadie, Jamie Ewert

© 2021 Cooperative Research Centre for Water Sensitive Cities Ltd.
This work is copyright. Apart from any use permitted under the Copyright Act 1968, no part of it may
be reproduced by any process without written permission from the publisher. Requests and inquiries
concerning reproduction rights should be directed to the publisher.

Publisher
Cooperative Research Centre for Water Sensitive Cities
PO Box 8000
Monash University LPO
Clayton, VIC 3800
e. admin@crcwsc.org.au
w. www.watersensitivecities.org.au
Date of publication: May 2021
An appropriate citation for this document is:
Nice, K. (2021). Managing urban heat in water sensitive cities: research and policy responses. Melbourne,
Australia: Cooperative Research Centre for Water Sensitive Cities.
Disclaimer
The CRC for Water Sensitive Cities has endeavoured to ensure that all information in this publication is
correct. It makes no warranty with regard to the accuracy of the information provided and will not be
liable if the information is inaccurate, incomplete or out of date nor be liable for any direct or indirect
damages arising from its use. The contents of this publication should not be used as a substitute for
seeking independent professional advice.
CRC for Water Sensitive Cities | 3

Contents
Introduction                                                                          4
PART A: Synthesis of key information                                                  5
PART B: Overview of urban heat causes and impacts                                     6
PART C: Overview of urban cooling metrics and goals                                  14
PART D: Overview of urban cooling assessment methods                                 19
PART E: References                                                                   22
4 | Managing urban heat in water sensitive cities: research and policy responses

Introduction

Urban heat is an increasing threat to the liveability and             nuanced approach is required reflecting the specific
productivity of cities, made worse by more frequent and               dimensions of urban heat relevant to the policy’s boundary
extreme heat days and heat waves caused by climate                    (area of application) and unique urban context. This requires
change. Exacerbated by population growth and urban                    policy makers to have a deeper understanding of urban
densification, urban heat has emerged as a key policy and             heat beyond the often referenced and used Urban Heat
planning issue for governments around the world.                      Island (UHI) effect, which in itself is not particularly useful
                                                                      for formulating locally relevant mitigation and adaptation
The design of cities, the conversion of vegetated surfaces            responses. More importantly, this focus can be a limitation.
to hard surfaces with higher heat storage capacity, surfaces          Through careful management of surfaces, shading, and
with lower albedos (heat reflectivity), reduction of available        vegetation, urban areas have the potential to provide greater
water, waste heat from buildings and transport, and reduced           thermal comfort and reductions in heat stress compared
shading and reduced canopy cover have altered the energy              with unmitigated rural areas.
balances in urban areas. This has left cities vulnerable to
extreme heat.                                                         This paper explains urban heat science in a way intended to
                                                                      inform good evidence based urban heat policy. The paper
The impact of urban heat manifests at a range of spatial and          draws from the extensive portfolio of urban heat research
temporal scales and is influenced by climatic, biophysical            conducted by the Cooperative Research Centre for Water
and social variables. There is no “one size fits all” approach        Sensitive Cities (CRCWSC) and from the broader published
to good evidence-based urban heat policy. Rather, a locally           scientific literature.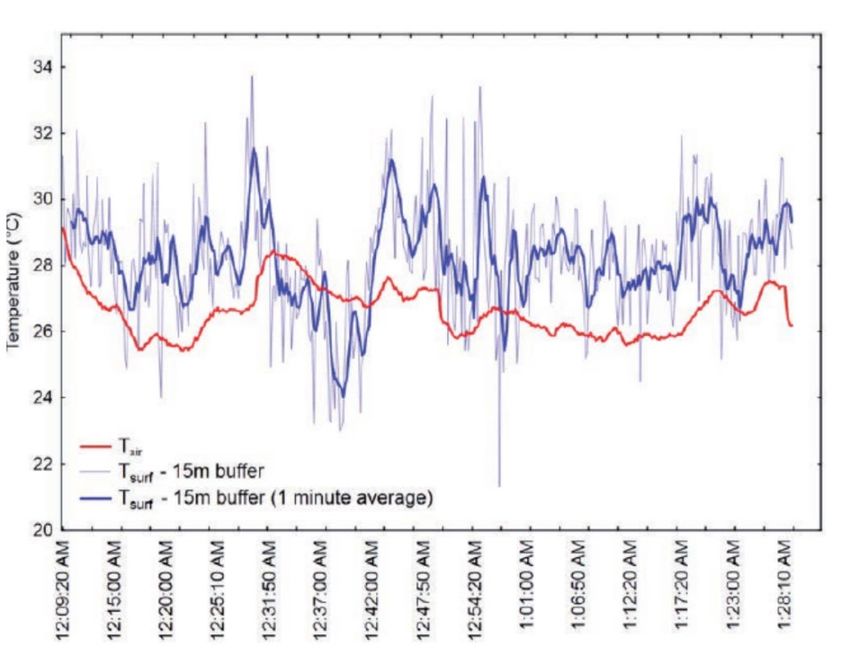
CRC for Water Sensitive Cities | 5

PART A: Synthesis of
key information
This PART summarises key information and scientific             Waterbodies can reduce air temperatures by 1–2°C,
evidence from the published scientific literature to inform     although these cooling plumes extend only a short distance
good evidence-based urban heat policy and procedures.           (downwind) from the waterbody. Similarly, irrigation can be
It is intended primarily for use by local government policy     a highly effective method of cooling, with low to moderate
makers and city planners to gain a sufficiently detailed        amounts of irrigation resulting in 0.5°C air temperature and
understanding of urban heat causes, impacts and                 20°C surface temperature reductions. Heavy amounts of
management responses at different spatial and temporal          irrigation can reduce air temperature by up to 2.5°C. For
scales to formulate tailored policy and planning responses.     emergency cooling during heat waves, irrigating very dry soil
                                                                or even impervious surfaces (streets or pavements) can be
Mitigating excess urban heat can bring multiple benefits but
                                                                very effective for high efficiency cooling.
is especially important to reduce public health impacts such
as sharp increases in mortality and morbidity rates when        All urban green infrastructure must be well watered and
temperatures exceed certain heat thresholds.                    maintained to perform most effectively. Green roofs provide
                                                                only limited benefit for street level cooling, but green walls
Urban heat is best examined at two scales: a neighbourhood
                                                                can provide some cooling relief for areas where street trees
scale that incorporates wind and air temperature, and a
                                                                are not viable.
street scale that incorporates radiant temperatures and
human thermal comfort.                                          Urban cooling strategies can be quantified through a number
                                                                of temperature metrics. Air temperature is the simplest and
Urban heat island (rural/urban temperature differences)
                                                                reasonable expectations of reductions are in the range of
has become a common shorthand for urban heat but
                                                                1–2°C. Surface temperatures can show wide variations of
does not accurately measure excess heat due to urban
                                                                20–30°C between nearby shaded and unshaded surfaces.
forms. Alternative methods to analyse urban heat are
                                                                Linking air temperatures to surface temperatures is difficult.
recommended.
                                                                The use of human thermal comfort indexes (such as
CRCWSC urban heat research examined these two scales
                                                                UTCI) allow many elements of urban heat (including air
using observations, remote sensing, database mapping and
                                                                temperature, radiant temperature, wind and humidity) to be
modelling.
                                                                incorporated into a ‘feels like’ temperature and levels of heat
Trees are a key means to enable urban cooling, providing        stress. These indexes also allow transferability of results to
shading of urban surfaces and evapotranspiration cooling.       different types of climates (i.e. from a low humidity to high
Large increases in canopy cover can result in 1°C or more of    humidity area).
air temperature reductions as well as localised UTCI (thermal
                                                                The CRCWSC has developed several urban cooling
comfort index) reductions of 5–15°C.
                                                                assessment tools and methods, including the TARGET and
Temperature reductions will be highly localised so              VTUF-3D models. The TARGET model has been incorporated
interventions should be evenly spread through an area to        into the WSC Scenario Tool and assesses urban heat
provide the widest benefit. In addition, the local context      outcomes alongside other urban water cycle outcomes such
should be considered (such as street width and orientation)     as water demand, infiltration and stormwater runoff.
to maximise the benefit.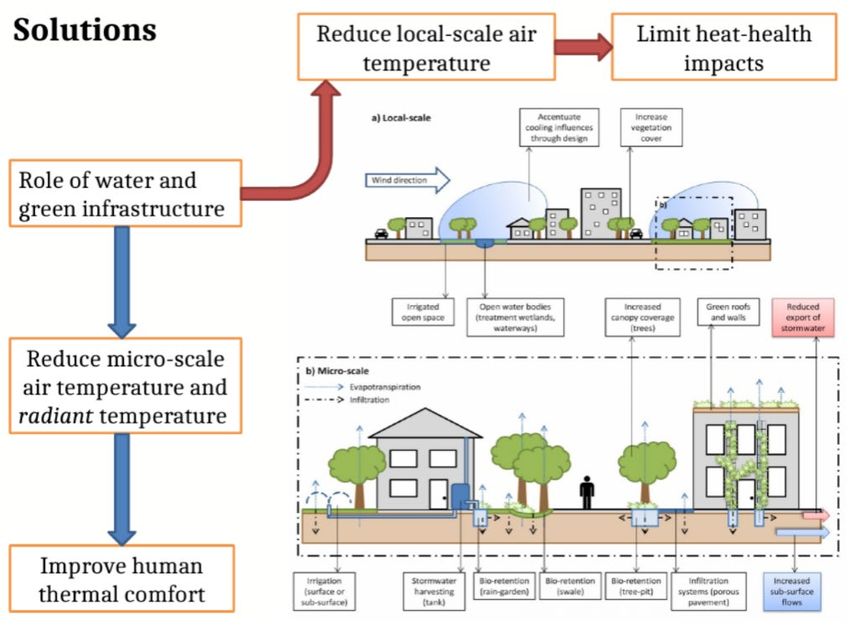
6 | Managing urban heat in water sensitive cities: research and policy responses

PART B: Overview of urban
heat causes and impacts

1         Urban heat
The design of cities, the conversion of vegetated surfaces             and pulse of climate change trends are leading to population
to hard surfaces with higher heat storage capacity, surfaces           collapses of a wide variety of Australian biota (Harris et al.,
with lower albedos, reduction of available water, waste heat           2018), such as when temperatures over 42°C caused high
from buildings and transport, and reduced shading and                  rates of mortality in Australian flying foxes (Welbergen et al.,
reduced canopy cover, have altered the energy balances in              2008).
urban areas. This has left cities vulnerable to extreme heat.
                                                                       While urban heat is a problem with wide-ranging
                                                                       implications, CRCWSC (and other) research shows heat
                                                                       impacts on human health can be especially costly. Extreme
1.1       Impacts of urban heat                                        heat events cause more deaths in Australia than any other
Excess heat in Australia has significant impacts and                   natural hazard (4555 in the period 1900–2010) (Coates et
costs across a wide range of concerns (Zuo et al., 2015).              al., 2014), with risk disproportionately borne by the elderly
The effects of extreme heat are seen through impacts on                and the very young (Nicholls et al., 2008). Predicting the
mental health, domestic violence, strains on emergency                 exact health impacts of urban heat is difficult. In the long
and health services, damage to urban infrastructure,                   term, annual heat-related mortality in China is predicted to
economic disruptions, and in many other areas (Harlan and              increase under climate change from 32 per million persons
Ruddell, 2011). The 2009 heat wave in southern Australia               to 48–67 per million with 1.5°C warming and 59–81 per
affected 1 million people and caused 420 casualties, in                million with 2.0°C warming (Wang et al., 2019). For short
addition to costs of AU$800 million from power disruptions,            term heat wave impacts, health impacts depend on local
transportation outages (from infrastructure damage                     acclimatisation and other factors. Nicholls et al. (2008) found
from heat), and response costs (Kiem et al., 2010). PWC                heat thresholds where mortality increases significantly. In
(2011) reports building material failures (e.g. concrete or            Melbourne, for over 64-year-olds, mortality rates increased
steel structure) during extreme heat. Costs to agriculture,            from 12per 100,000 persons to 13 per 100,000 then 15 as the
livestock, and forests during the 2003 European heatwave               daily mean temperature increased from 28°C to 30°C and
was estimated to be US$15 billion (Stern, 2008). The press             32°C respectively (Figure 1).

Figure 1: Median and lower upper quartile points (boxes) and ranges (whiskers) of daily death rates (per 100,000 persons) of over 64-year-
olds in Melbourne for 2°C ranges of mean temperature. Source: Nicholls et al. (2008).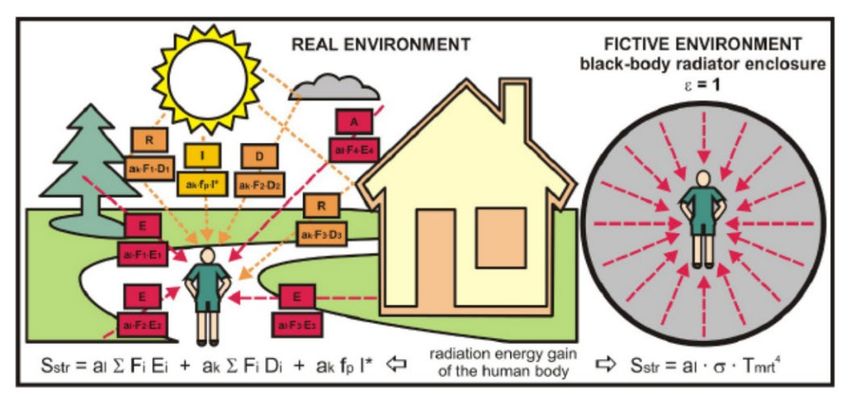
CRC for Water Sensitive Cities | 7
1.2 Urban scales
Analysis of urban heat can proceed at multiple scales. canopies supported by increased irrigation provide shade to
Figure 2 shows the two scales most relevant to cooling surfaces and reduce the amount of radiative heat on people.
strategies using water sensitive urban design (WSUD). At Decreased heat is stored in the surfaces during the day,
a neighbourhood (local) scale, cooling strategies will be reducing the amounts of heat re-radiating at night.
manifested in air temperature reductions. Cooling plumes
These hot surfaces and stored heat are a major factor
from waterbodies and irrigated parks and other green
in urban heat island (UHI), the relative differences in
spaces can be seen downwind.
temperatures between urban areas and rural surroundings
At a micro-scale, the impacts of WSUD can be seen through (Oke, 1995), which can be substantial. Coutts et al. (2010)
increased human thermal comfort with the processes found a peak air temperature difference of about 4°C
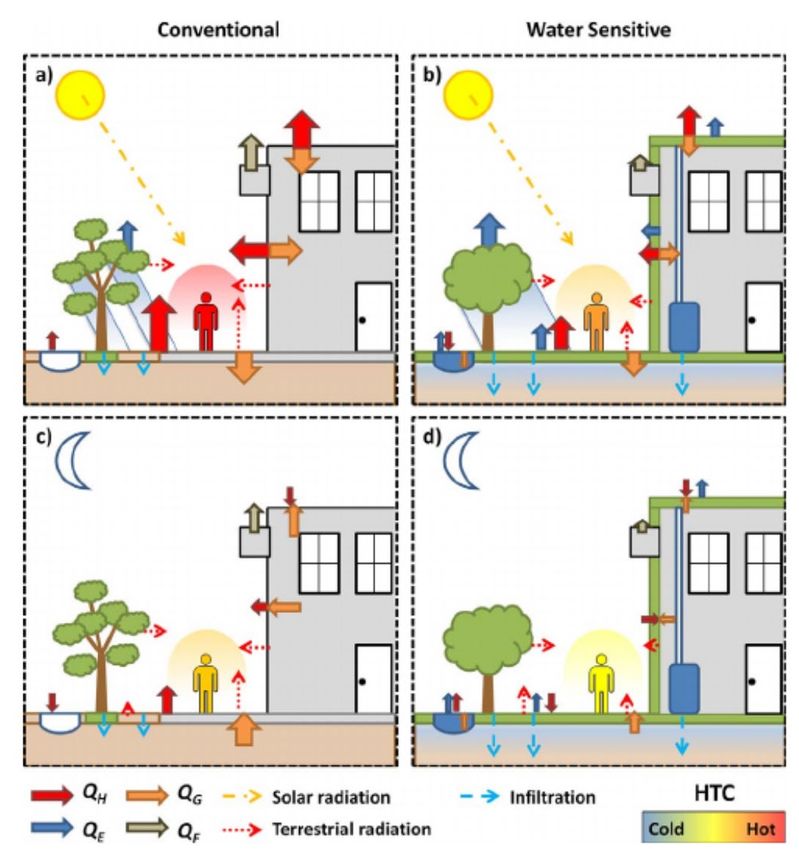
illustrated in Figure 3. As cities shift from a conventional between inner city and rural outskirts at 1am on 23 March
design to a water sensitive one, important changes occur in 2006. Torok et al. (2001) observed a peak UHI intensity of
the energy balances during the daytime and at night. Denser about 7.1°C at 9pm on 26 August 1992.
Figure 2: Schematic representation of widespread implementation of stormwater harvesting and water sensitive urban design elements
at the micro-scale in the restoration of a more natural water balance, along with increased vegetation cover. This enhances urban
evapotranspiration and shading resulting in local-scale cooling effects that can improve human thermal comfort. Adapted from
Coutts et al. (2012).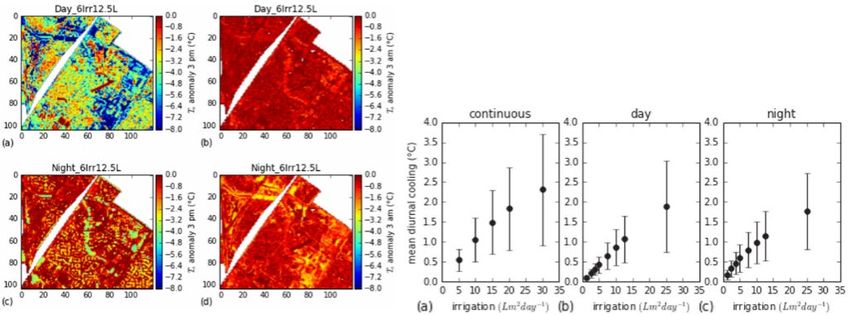
8 | Managing urban heat in water sensitive cities: research and policy responses

The concept of UHI is frequently used to describe                      maximum and thermal stress is highest. In addition, as cities
and quantify levels of excess heat in urban areas. The                 become larger and more novel environments, it is doubtful
temperature differences from UHI observations (such as                 that measuring temperatures in increasingly distant rural/
the 4°C example above) are used as (possibly unrealistic)              agricultural land is an accurate measure of the amount of
goals for urban cooling strategies. However, as Martilli               extra heat added by the existence of the urban form. More
et al. (2020) point out, there are a number of problems                importantly, with careful management of surfaces, shading
with this approach. The largest differences in urban/rural             and vegetation, urban areas actually have the potential to
temperatures are generally observed in the night time,                 show improved thermal comfort over that of unmitigated
not during daytime when daily temperatures reach their                 rural areas.

Figure 3: Generalisation of key processes in the formation of urban micro-climates during summer for conventional (water limited) urban
landscapes (a and c) and water sensitive urban landscapes (b and d). Day (a and b) and night (c and d) conditions are presented. Source:
Coutts et al. (2012).
CRC for Water Sensitive Cities | 9

                                                                          2        CRCWSC research:
                                                                                   from tree to street to
                                                                                   neighbourhood
With this in mind, this report will concentrate on the research           To examine the causes and impacts of urban heat, it is useful
shown to improve thermal comfort at smaller scales                        to start at the smallest scales and work upward. This allows
(neighbourhoods and blocks). By concentrating on the                      for seeing the smallest interactions and identifying the root
specific techniques that can provide the maximum cooling                  causes of urban heat. Figure 4 shows a range of scales
for each unique local area type, better targeted inventions               important in urban areas and types of features they include,
can be implemented across a city and provide the maximum                  from the smallest scale of an individual tree or building to
thermal comfort benefits for that wider area.                             block and neighbourhood, up to city scale.

1.3	Scope of CRCWCS urban                                                2.1      Trees
     heat research                                                        CRCWSC research into urban heat focused on trees
The CRCWSC has undertaken research into urban heat                        and other types of urban greening as a key means of
across these different scales using four different methods.               enabling urban cooling. An overall goal of WSUD is to
The first was through direct observations of existing areas,              provide alternative sources of water to cities by capturing
setting up equipment and measuring these areas across                     stormwater. In turn, utilising this augmented water supply to
days and months. The second method was through remote                     establish and maintain a healthy urban canopy has multiple
sensing, measuring amounts and distribution of water,                     benefits for urban heat strategies.
vegetation, and different surface types and the resulting                 Starting at a micro-scale – that is the area that can resolve a
land surface temperatures. The third method used database                 single tree or a person in a street – the mechanisms driving
mapping. This allows analysis of questions such as what                   thermal performance of urban areas can be studied, along
is the spatial distribution of heat vulnerability based on                with the direct impacts on thermal comfort and humans.
layers of urban form types, thermal performance of those                  This is the scale of Figures 2 and 3.
forms, and demographics. The fourth method was through
modelling. Using the results of the first three methods to                Trees have a complex role in street canyon environments
validate the proper functioning of models, modelling allows               (Figure 5), intercepting solar radiation, reflecting and
for greater detail of difficult to measure temporal and spatial           storing energy, and driving extraction of soil moisture into
variability in existing environments as well as testing of new            evapotranspiration, shifting energy balances away from
scenarios.                                                                sensible heat toward latent heat. While the shading provided
                                                                          by trees and the moisture from evapotranspiration generally

                                                                                                       Dimensions

           Unit        Built features     Tree features             Climate phenomena            H         W           L           Scale

 1. Building           building           tree, garden          wake, plume shadow               10        10         10 m      micro γ

 2. Canyon             street             avenue,               street vortex,                   10        30        300 m      micro β
                                             boulevard,             thermal climate,
                                             shelterbelt            shade

 3. Block              city block,        park, wood            local breezes,                   —          0.5       5 km      micro α
                           factory                                 cumulus, park cooling

 4. Land-use zone residential,    greenbelt,                    air quality and                  —         5          5 km      meso γ
                      industrial,    suburban                       climate districts
                      city centre    forest

 5. City               built-up area      urban forest          heat, humidity                             25        25 km      meso β
                                                                   island, city breezes,
                                                                   smog dome, precip.
                                                                   modification

Figure 4: Scale classification of the urban canopy. Source: Oke et al. (1989).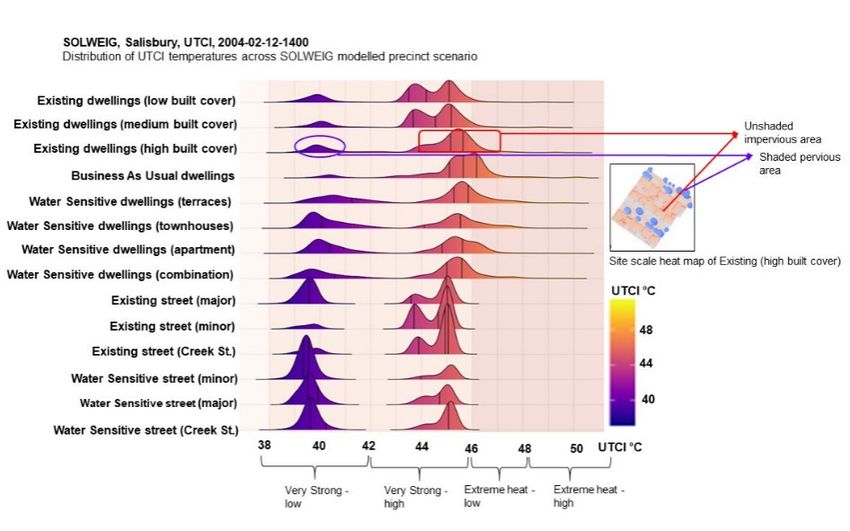
10 | Managing urban heat in water sensitive cities: research and policy responses

have a cooling effect, they can also impede wind flow and              In more specific examples, Coutts et al. (2016) found
trap heat at night, causing slight heating effects.                    air temperature differences of 1.2°C below the canopy
                                                                       compared with above, and differences in UTCI of up to
CRCWSC research has included observation campaigns
                                                                       7°C (Figure 6a). In other observations of canopy cooling,
on isolated trees and street trees to discover the exact role
                                                                       Thom et al. (2016) found a 4.0°C reduction in mean radiant
trees can play in urban cooling. In general, the benefits of
                                                                       temperature and 7.0°C in UTCI during heat waves. In
a good tree canopy cover were found to include increased
                                                                       two nearby residential streets in Melbourne (Figure 6b),
evapotranspiration, reduced surface temperatures, reduced
                                                                       temperature reductions were observed between a street
air temperatures, and reduced night-time temperatures
                                                                       with an open canopy versus a treed street (12% plan area
(Coutts and Tapper, 2017). These improvements can improve
                                                                       canopy coverage versus 45%) of up to 1.0°C air temperature
thermal comfort and help compensate for high levels of
                                                                       and 12.0°C UTCI (Coutts et al., 2015).
impervious surfaces in urban areas.

Figure 5: Scheme of the daytime energy exchanges between an isolated tree and its street canyon environment. Source: Oke et al. (1989).

Figure 6: a) Air temperature within and around isolated tree in Melbourne Cemetery on 9 March 2014 at 4 pm. Source: Coutts et al. (2016).
b) Mean daytime air temperature across two Melbourne streets with an open canopy (OPN) and treed street (TRD) during the heat event
over 4–12 March 2013. Source: Coutts et al. (2015).
CRC for Water Sensitive Cities | 11 Across a wider area, in a modelling study, Jacobs et al. (2018) At a micro-scale, urban heat distributions are highly variable found that increasing vegetation cover across Melbourne by and highly localised. Picking the right tree for the right place 10% can deliver a 0.2°C air temperature reduction, and up to is necessary to maximise the benefits. As shown in Figure 7, 1.0°C with a 100% increase of vegetation cover. Nury (2015) using certain species and heights deliver the best shading results remote sensing across a number of local councils in Melbourne, based on the orientation, side location, and position on streets observed that increasing the vegetation fractions from 0.2 to in relation to other features (median, between car parks, 0.8 can reduce surface temperatures by up to 6.0°C. property boundary, or setback) (Langenheim et al., 2020). Figure 7: Tree species fitting for form, height and width requirements to achieve shading objective. Source: (Langenheim et al., 2020). Figure 8: Shows different levels of solar exposure for a pedestrian traversing a single footpath moving at 1m per second, with a maximum walking time of 60s, and maximum solar exposure time of 10s, with trees spaced at 10 m. Source: (Langenheim et al., 2020).
12 | Managing urban heat in water sensitive cities: research and policy responses

If street trees are intended to increase pedestrian thermal               were found to be 1.8°C cooler than the suburb maximum
comfort, spacing and distribution also needs to be                        (Broadbent et al., 2017). Also, overall there was a 2.0°C
considered. The amount of heat exposure a pedestrian                      variability across the neighbourhood during the day
on a footpath will be exposed to as they pass in and out                  and at night.
of shaded areas will be determined by the spacing and
                                                                          Using irrigation has also been found to be an effective
orientation of the trees (Figure 8).
                                                                          cooling technique. Irrigated sections of the Melbourne
                                                                          Botanic Gardens were observed to be up to 3.5°C cooler
                                                                          (in air temperature) during heatwave conditions (Lam et
2.2       Street tree placement                                           al., 2016; Lam and Hang, 2017). Areas of Lincoln Square in
At a wider scale, tree placement within a block should                    Melbourne that were lightly irrigated had reductions of air
consider the orientation and height to width ratio of the                 temperature of 1.0°C and 10.0°C in UTCI (Motazedian, 2017;
street (Figure 9). East-west streets should generally be                  Motazedian et al., 2020).
prioritised because they will receive the largest amounts of              To test the effectiveness of irrigation for cooling, Broadbent
solar exposure over the day. Very wide streets or streets with            et al. (2018) performed a modelling study of Mawson Lakes
very low buildings should also receive higher priority.                   (Figure 10). Low to moderate levels of irrigation reduced air
                                                                          temperature across the neighbourhood by about 0.5°C
                                                                          and surface temperatures by up to 20°C. Using very heavy
2.3	Neighbourhood cooling through                                        amounts of irrigation (30Lm2/day), air temperature reductions
                                                                          increased at non-linear rates of up to 2.5°C, but cooling
     waterbodies and irrigation                                           plateaued when the soil reached saturation. The threshold
At a neighbourhood scale, CRCWSC research has examined                    for maximum cooling peaked at 20Lm2/day. Further, irrigating
the cooling benefits of waterbodies and irrigation.                       bare dry ground had a very high cooling efficiency (the
Waterbodies can provide some cooling benefit to areas                     temperature reduction per volume of water). This means that
nearby. In Mawson Lakes, a WSUD suburban environment                      watering streets or pavements during a heat wave can be a
in Adelaide, air temperatures near waterbodies (within 50m)               very effective method of emergency cooling.

Figure 9: Prioritisation of street tree installation where sites with high solar exposure and resulting high temperatures are high priority
targets for mitigation. Numbers inside the boxes are H:W ratios. Source: Norton et al. (2015).
CRC for Water Sensitive Cities | 13
2.4 Urban green infrastructure
A range of urban green infrastructure (UGI) has been found the vegetation and provide evapotranspirative cooling
to provide cooling benefits, but optimal use requires the benefits. Green roofs provide moderate amounts of cooling
right type to be used in the right way. Figure 11 compares the for buildings but are of little benefit for street level cooling.
use of green open spaces, trees, green roofs, and vertical Green walls can provide some cooling relief for streets
greening. In almost all cases, irrigation is required to maintain where street trees are not viable.
Figure 10: (Left) Spatial representation of cooling from Day/Night_6Irr12.5L scenario at (a/c) 3pm and (b/d) 3am on Julian day 37.
Source: Broadbent et al. (2018). (Right) Heatwave average diurnal cooling for (a) continuous, (b) day, and (c) night irrigation.
Source: Broadbent et al. (2018).
UGI Green open spaces Trees Green roofs Vertical greening
Shades canyon surfaces? Yes, if grass rather Yes Shades roof, not internal Yes
than concrete canyon surfaces
Shades people? Yes, if treed Yes No, only very intensive No
green roofs
Increases solar reflectivity? Yes, when grassed Yes Yes, if plants healthy Yes
Evapo-transpirative cooling? Yes, with water Yes Yes, with water when hot Yes, with water when hot
(unless severe
No, without water drought) No, without water No, without water
Priority locations • Wide streets with low • Wide streets, low • Sun exposed roofs • Canyon walls with
buildings - both sides buildings - both sides • Poor insulated buildings direct sunlight
• Wide streets with tall • Wide streets, tall • Low, large buildings • Narrow or wide
buildings - sunny side buildings - sunny side • Dense areas with little canyons where trees
• In green open spaces available ground space are unviable
Figure 11: Modes of cooling provided by different urban green infrastructure options during summer and priority locations to optimise those
cooling benefits. Source: Norton et al. (2015).14 | Managing urban heat in water sensitive cities: research and policy responses
PART C: Overview of urban
cooling metrics and goals
3 Urban cooling surfaces will be similar to the surrounding air temperatures
while nearby unshaded surfaces can be 20–30°C hotter.
Land surface temperatures can be observed using satellite
The research undertaken by the CRCWSC shows WSUD or aircraft remote sensing, quickly mapping wide areas.
presents an opportunity to mitigate urban heat. WSUD However, customised or high-resolution mapping beyond
infrastructure deployed through urban areas increases scheduled acquisition times of a standard source such
the amount of water available in cities to support as Landsat or higher resolution than MODIS will require
vegetation. This increased vegetation and modified commissioning expensive aircraft flights.
urban areas can greatly reduce thermal stress and
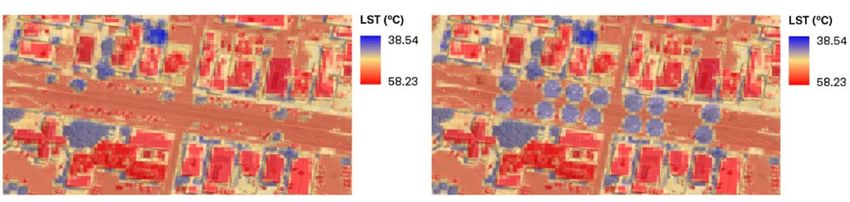
impacts from heat. Surface temperatures will vary widely depending on the
surface types and whether the surfaces are shaded or not.
Urban cooling strategies often set 1–2°C air temperature As observed in Figure 12, during the day, surfaces such as
reductions as their goal. Judging whether this is a suitable concrete, roofs and roads are significantly hotter than many
goal or if the goal has been (can be measured) achieved natural surfaces, especially if they are irrigated. However,
requires understanding what this goal means and how non-irrigated grass can be just as hot as roads. At night,
effective it is in mitigating health and other impacts. surfaces such as concrete, roads and tile roofs that have
stored heat during the day will remain hot far into the night,
while most other surfaces will cool down quickly.
3.1 Urban cooling metrics It is difficult to link land surface temperatures to air
A multitude of different metrics can be used to measure temperatures at a micro-scale. Figure 13 shows a transect
urban heat. Different types of temperatures are often used across Melbourne at night. Some correlations were found
interchangeably, causing considerable confusion about between the air and surface temperatures in areas with
the actual outcomes. Air temperature is the most common. deep urban canyons where the buildings restricted the
Air temperatures will show the least variability across a airflow, but these relationships broke down in more open
neighbourhood or precinct, differing by 1–2°C at most in areas.
nearby locations. Air temperature can be easily measured Nury (2015) performed a statistical regression on air
using simple equipment, but observations of variability temperature (Ta) measurements from weather stations
across a local area requires a dense network of instruments. and Landsat TM5 land surface temperatures (LST) and
Surface temperatures, on the other hand, can show wide developed a relationship of Ta = 0.753 × LST + 1.942
ranges in variability. Surface temperatures of shaded (Figure 14).
South Melbourne DAY (ºC) St. Dev. (ºC) NIGHT (ºC) St. Dev. (ºC)
Concrete 50.45 7.66 31.63 5.26
Irrigated grass 42.81 8.34 25.59 3.92
Non irrigated grass 48.00 6.80 26.27 3.74
Road 48.83 7.63 29.16 4.28
Tile roof 52.20 7.82 30.35 4.35
Galv. steel roof 51.95 11.20 26.53 8.60
Trees 41.59 6.66 26.62 2.90
Water 44.41 7.97 27.72 3.90
AVERAGE 47.53 27.98
Figure 12: Average land surface temperatures of the major land surface types for the City of Port Phillip areas.
Source: Coutts and Harris (2013).CRC for Water Sensitive Cities | 15 Figure 13: Plot of air temperature (10 second average) and land surface temperature using instantaneous 15 m buffers over the equivalent of 1 minute of travel for the air temperature transect on 25 February 2012. Source: Coutts and Harris (2013). Figure 14: The relationship between measured LST from satellite imagery (Landsat TM5) and air temperature from weather stations. Source: Nury (2015).
16 | Managing urban heat in water sensitive cities: research and policy responses

3.2       Human thermal comfort
Measuring the success of an urban cooling strategy through              surrounding surfaces) on a human body (Kántor and Unger,
improvements in human thermal comfort (HTC) allows the                  2011) (see Figure 15). Incorporating all of these types of
direct quantification of thermal stress on people resulting             temperatures are human thermal comfort (HTC) indexes
from the complex mix of elements of urban environments.                 such as the Universal Thermal Climate Index (UTCI) (Bröde et
An important parameter necessary to measure HTC is                      al., 2009). UTCI gives equivalent temperatures of heat stress
mean radiant temperature. Mean radiant temperature is a                 (see Figure 16).
summation of shortwave radiation (sunlight and reflected
sunlight) and longwave radiation (radiated heat from

Figure 15: Illustration supporting the understanding of the definition and calculation of mean radiant temperature.
Source: Kántor and Unger (2011).

Figure 16: Elements of the operational procedure and concept of UTCI as categorised equivalent temperature derived from the dynamic
response of a thermo-physiological model coupled with a behavioural clothing model.
Source: Bröde et al. (2013).
CRC for Water Sensitive Cities | 17

3.3       Urban cooling goals
Based on CRCWSC observations and modelling research,                    design, business as usual (BAU) future development, and
some reasonable goals of cooling through different                      a water sensitive (WS) approach (Figure 17). Because each
interventions can be set. Widespread reductions of air                  scenario had completely different spatial layouts, calculating
temperature of 1–2°C have been observed and modelled in                 the difference between the scenarios is not possible.
cases where canopy cover is increased from small amounts                Instead, the distributions of UTCI temperatures (a heat
to high levels, or in cases where green space is actively               stress index) across the different scenarios were compared
irrigated with large amounts of water. These goals should               (Figure 18) to show how they changed across the different
also specify whether these benchmarks are reductions of                 designs. Using these shifts in heat stress distributions,
a maximum temperature at the hottest part of the day, are               urban thermal comfort could then be incorporated into
averaged across the day, or are a measure of the UHI and                a multiple performance criteria comparing the different
compare different areas at night.                                       designs (Figure 19).
Surface temperature reductions can be modelled or                       Much of the CRCWSC research has concentrated on the
measured through thermal imagery. Other measures such as                warm and dry climates of southern Australia. A strength of
mean radiant temperature or UTCI might require modelling.               making assessments using UTCI is its transferability to other
But for each of these, the variability in micro-climates can            local climate types, because UTCI accounts for the impacts
make it difficult to assess the success of interventions and            of air temperature, solar radiation, wind and humidity.
designs to mitigate urban heat.
                                                                        Reductions in surface temperatures and direct solar
By incorporating additional shading into urban areas (i.e.              radiation loads on pedestrians through shading will reduce
increased tree canopy cover), reducing the amounts                      thermal heat stress in all climate types. The impacts of
of hard impervious surfaces, and increasing the use of                  higher humidity levels due to increased vegetation and water
water features and irrigation, some surfaces in the area                features in sub-tropical climates such as Singapore will be
can show reduction of surface temperatures of 10–20°C.                  reflected in the calculated UTCI equivalent temperatures of
However, unshaded hard surfaces that remain will show no                heat stress. In addition, modifications to wind flow will also
reductions. Through the reduction in surface temperatures,              be reflected in the UTCI equivalent temperatures.
there will be a corresponding reduction in UTCI temperatures
                                                                        Some of the transferability of results might also be impacted
of up to 10°C.
                                                                        by acclimatisation to local climate conditions. Figure 20
As an example of how mitigation strategies can be assessed              shows threshold temperatures in all the Australian capital
at a micro-scale, Todorovic et al. (2019) created several               cities. Across Australia, residents of Adelaide have the
site and neighbourhood designs for infill development in                highest tolerance to higher temperatures while Hobart
Salisbury, South Australia. The heat performance of the                 shows higher mortality and morbidity at lower threshold
scenarios was modelled, which included an existing urban                temperatures.

Figure 17: UTCI temperatures (degrees C) for three scenarios: a) Typical Existing; b) BAU; c) WS1 – Townhouses.
Source: Todorovic et al. (2019).
18 | Managing urban heat in water sensitive cities: research and policy responses Figure 18: Distribution of outdoor UTCI (‘feels like’) temperatures for each of the individual dwelling and street typology site plans. Source: Renouf et al. (2020). Figure 19: Overall performance comparison across multiple performance criteria for Salisbury scenarios. Source: Renouf et al. (2020).
CRC for Water Sensitive Cities | 19
PART D: Overview
of urban cooling
assessment methods
3.4 Urban cooling assessment tools
The CRCWSC has developed several tools to assist with As a very efficient model, it is suitable to model even
assessing urban cooling strategies. city-scaled areas as in this example of modelled surface
temperatures of Melbourne (Figure 22).
3.4.1 TARGET
3.4.2 CRC Scenario Tool
TARGET – The Air-temperature Response to Green/blue-
infrastructure Evaluation Tool (Broadbent et al., 2019) – is The CRCWSC Scenario Tool is a planning support tool
a model to evaluate the heat impacts of urban form and to evaluate outcomes of different scenarios of urban
especially green and blue infrastructure. TARGET produces development. These include several urban water cycle
2m air temperature predictions as well as UTCI values. It outcomes such as water demand, infiltration and
was designed to be accessible to non-expert users and can stormwater runoff. Heat assessments were enabled through
be configured and run using GIS data and on a standard the surface temperature/air temperatures discussed in
desktop computer. This tool can be used to examine the air Section 3.1 (Urban cooling metrics) and Figure 14 (Figure 23).
temperature reductions from increasing tree canopy cover
In 2020, the tool was updated to include the TARGET model.
or through irrigation, as in Figure 21.
This will now allow air temperatures and UTCI to be modelled
in conjunction with the urban water cycle outcomes.
Number Tmax Tmin meanT AT
City of days % increase % increase % increase % increase
of data in median in median in median in median
Brisbane
Morbidity 2956 36 (55) 2.5–12% 26 (7) 2.5% 34 (2) 9% 40 (25) 4–11%
Mortality 4007 36 (58) 12% 22 (11) 5% 31 (6) 15% 40 (9) 8%
Canberra
28 (28)
Morbidity 2320 37 (33) 5–10% 20 (30) 5% 5–8% 38 (11) 8–10%
28 (16)
Mortality 4007 33 (179) 5% 20 (43) 2% 2% 41 (4) 5%
Darwin
Morbidity 1826 36 (4) 5% 28 (17) 5% 31 (19) 7% 35 (5) 5%
Mortality 4007 37 (11) 5% 29 (19) 8% 31 (94) 3% 47 (5) 10–20%
Hobart
Morbidity 2953 NA 18 (28) 5–20% 27 (3) 5% 36 (5) 4–10%
Mortality 4007 35 (13) 11% 20 (5) 2% 28 (5) 6% 37 (6) 5–20%
Melbourne
Morbidity 3287 44 (5) 3% 26 (6) 3% 34 (6) 3% 42 (10) 2–3%
Mortality 4007 39 (23) 2–65% 26 (9) 5% 28 (112) 3–13% 36 (68) 4%
Perth
Morbidity 2007 43 (3) 14% 26 (4) 4% NA 43 (8) 2–5%
Mortality 4007 44 (3) 30% NA 32 (20) 3–10% 45 (3) 10%
Adelaide
Morbidity 3045 NA 31 (4) 5% 39 (1) 24% NA
Mortality 4007 42 (21) 2–8% NA 34 (2) 8% 43 (16) 2–10%
Sydney
Morbidity 4162 41 (3) 5–38% 25 (5) 4% 31 (5) 2% 41 (3) 5%
Mortality 4007 38 (3) 2–18% 25 (3) 5% 30 (12) 5% 37 (27) 2–24%
Figure 20: Threshold temperature derived from analyses of daily all-cause mortality, daily emergency hospital admissions, daily ambulance
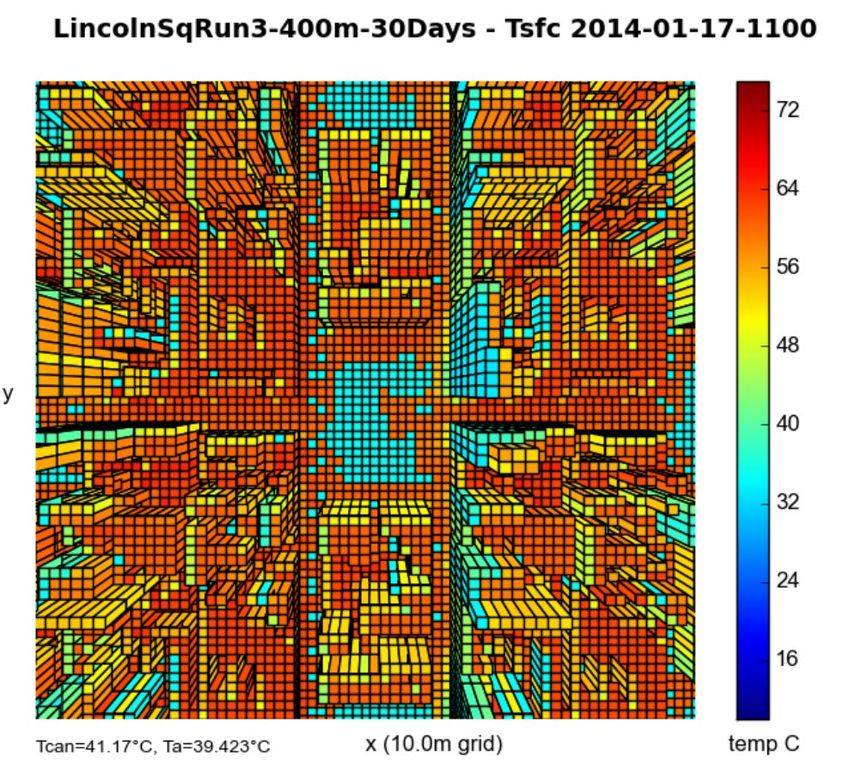
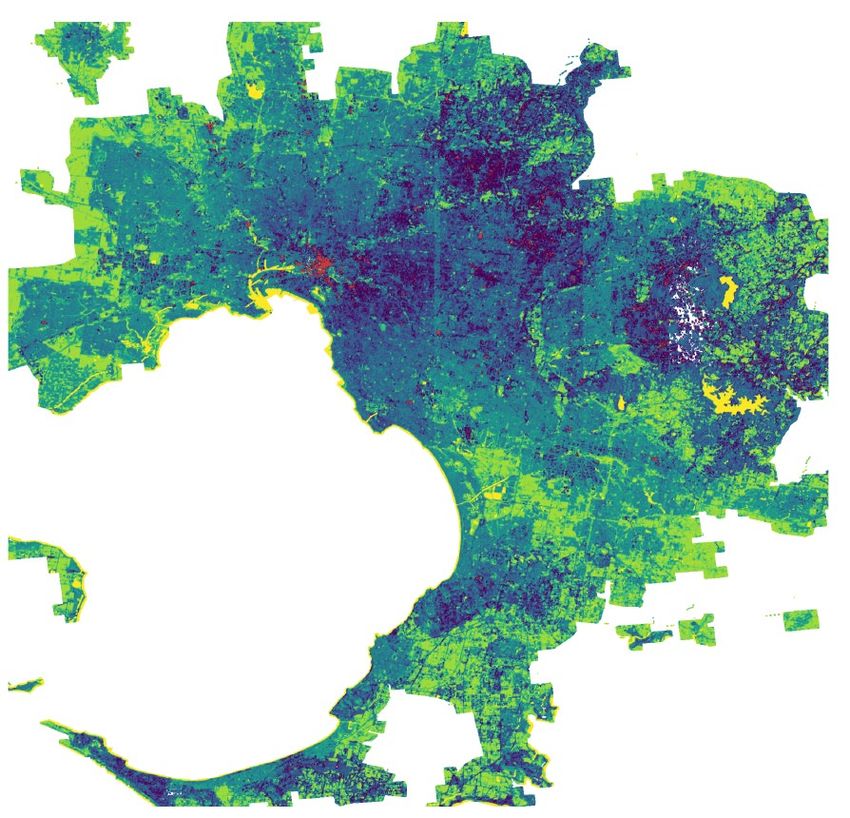
call-outs or emergency department presentations in Australian capital cities. Source: Loughnan et al. (2013).20 | Managing urban heat in water sensitive cities: research and policy responses Figure 21: Modelled air temperature reductions (°C) from doubling tree canopy cover in Mawson Lakes. 2xTree - BASE at a) 15:00 and b) 03:00. Source: Broadbent et al. (2018). Figure 22: City-wide modelling of Melbourne surface temperatures using the TARGET model. Source: Nice (2020).
CRC for Water Sensitive Cities | 21

3.4.3     VTUF-3D                                                       3.4.4     SOLWEIG / UMEP
For more detailed micro-climate assessments of urban                    Another modelling tool often used in CRCWSC research is
greening benefits, the VTUF-3D model (Nice et al., 2018) was            the SOLWEIG module of the Urban Multi-scale Environmental
also developed through CRCWSC research. This is a true                  Predictor (UMEP) (Lindberg et al., 2018). This is available as
micro-scaled model that allows modelling urban canyons at               a plugin to QGIS (QGIS Development Team, 2009) and allows
a very small scale (2-5m) in 3 dimensions including trees and           micro-scaled modelling of air temperature and mean radiant
vegetation. Figure 24 shows the level of detail across this             temperature using GIS input layers. This model was used for
city park with a cooler area under the canopy cover in the              the Salisbury scenarios in Figure 17.
centre.

Figure 23: CRCWCS Scenario Tool, modelled land surface temperature of Dubbo (left) before and (right) after tree planting.
Source: Urich and Harold (2020).

Figure 24: VTUF-3D output of surface temperature in Lincoln Square, Melbourne, 17 January 2014, 11am. Source: Nice et al. (2014).
22 | Managing urban heat in water sensitive cities: research and policy responses

PART E: References

References
Broadbent, A. M., Coutts, A. M., Nice, K. A., Demuzere, M.,              Coutts, A. M., White, E. C., Tapper, N. J., Beringer, J., Livesley, S. J.,
Krayenhoff, E. S., 2019. The Air-temperature Response to Green/          2015. Temperature and human thermal comfort effects of street
blue-infrastructure Evaluation Tool (TARGET v1.0): an efficient          trees across three contrasting street canyon environments.
and user-friendly model of city cooling. Geoscientific Model             Theoretical and Applied Climatology 124 (1), 55–68. URL http://
Development 12, 785–803.                                                 link.springer.com/10.1007/s00704-015-1409-y
Broadbent, A. M., Coutts, A. M., Tapper, N. J., Demuzere, M., 2018.      Harlan, S. L., Ruddell, D. M., 2011. Climate change and health
The cooling effect of irrigation on urban microclimate during            in cities: impacts of heat and air pollution and potential co-
heatwave conditions. Urban Climate 23, 309–329. URL https://             benefits from mitigation and adaptation. Current Opinion in
doi.org/10.1016/j.uclim.2017.05.002                                      Environmental Sustainability 3, 126–134. URL https://www.
                                                                         sciencedirect.com/science/article/pii/S1877343511000029
Broadbent, A. M., Coutts, A. M., Tapper, N. J., Demuzere, M.,
Beringer, J., 2017. The microscale cooling effects of water              Harris, R. M. B., Beaumont, L. J., Vance, T. R., Tozer, C. R., Remenyi,
sensitive urban design and irrigation in a suburban environment.         T. A., Perkins-Kirkpatrick, S. E., Mitchell, P. J., Nicotra, A. B.,
Theor. Appl. Climatol., 1–23.                                            McGregor, S., Andrew, N. R., Letnic, M., Kearney, M. R., Wernberg,
                                                                         T., Hutley, L. B., Chambers, L. E., Fletcher, M.-S., Keatley, M. R.,
Bröde, P., Błazejczyk, K., Fiala, D., Havenith, G., Holmér, I.,
                                                                         Woodward, C. A., Williamson, G., Duke, N. C., Bowman, D. M. J.
Jendritzky, G., Kuklane, K., Kampmann, B., 2013. The Universal
                                                                         S., 2018. Biological responses to the press and pulse of climate
Thermal Climate Index UTCI compared to ergonomics standards
                                                                         trends and extreme events. Nature Climate Change 8 (7), 579–
for assessing the thermal environment. Industrial Health 51,
                                                                         587. URL http://www.nature.com/articles/s41558-018-0187-9
16–24. URL http://www.ncbi.nlm.nih.gov/pubmed/23411753
                                                                         Jacobs, S., Gallant, A., Tapper, N., Li, D., 2018. Use of cool
Bröde, P., Fiala, D., Blazejczyk, K., Epstein, Y., Holmér, I.,
                                                                         roofs and vegetation to mitigate urban heat and improve
Jendritzky, G., Kampmann, B., Richards, M., Rintamäki, H., Shitzer,
                                                                         human thermal stress in Melbourne, Australia. J. Appl. Meteor.
A., Havenith, G., 2009. Calculating UTCI Equivalent Temperatures.
                                                                         Climatol. URL https://journals.ametsoc.org/doi/abs/10.1175/
In: Environmental Ergonomics XIII, Proceedings of the 13th
                                                                         JAMC-D-17-0243.1
International Conference on Environmental Ergonomics, Boston,
MA, 2 - 7 August 2009, University of Wollongong, Wollongong. pp.         Kántor, N., Unger, J., 2011. The most problematic variable in the
49–53.                                                                   course of human-biometeorological comfort assessment - the
                                                                         mean radiant temperature. Open Geosciences 3 (1), 90–100.
Coates, L., Haynes, K., O’Brien, J., McAneney, J., de Oliveira, F.
D., 2014. Exploring 167 years of vulnerability: An examination           Kiem, A. S., Verdon-Kidd, D. C., Boulter, S. L., Palutikof, J. P.,
of extreme heat events in Australia 1844-2010. Environmental             2010. Learning from experience: Historical case studies and
Science and Policy 42, 33–44. URL http://dx.doi.org/10.1016/j.           climate change adaptation. Tech. rep., National Climate Change
envsci.2014.05.003 https://www.sciencedirect.com/science/                Adaptation Research Facility, Gold Coast.
article/pii/S1462901114000999
                                                                         Lam, C. K. C., Gallant, A. J., Tapper, N. J., 2016. Perceptions of
Coutts, A., Moore, C., Tapper, N. J., White, E. C., 2016. Microclimate   thermal comfort in heatwave and non-heatwave conditions
of isolated trees in the urban environment. In: 2nd Urban Tree           in Melbourne, Australia. Urban Climate. URL http://linkinghub.
Diversity Conference, Melbourne, Australia, 22-24 February 2016.         elsevier.com/retrieve/pii/S2212095516300396
Coutts, A., Tapper, N., 2017. Trees for a Cool City: Guidelines for      Lam, C. K. C., Hang, J., 2017. Solar Radiation Intensity and Outdoor
optimised tree placement. Tech. rep., Cooperative Research               Thermal Comfort in Royal Botanic Garden Melbourne during
Centre for Water Sensitive Cities, Melbourne Australia.                  Heatwave Conditions. Procedia Engineering 205 (November),
                                                                         3456–3462. URL https://doi.org/10.1016/j.proeng.2017.09.877
Coutts, A. M., Beringer, J., Tapper, N., 2010. Changing Urban
Climate and CO2 Emissions: Implications for the Development              Langenheim, N., White, M., Tapper, N., Livesley, S. J., Ramirez-
of Policies for Sustainable Cities. Urban Policy and Research            Lovering, D., 2020. Right tree, right place, right time: A visual-
28 (1), 27–47. URL http://www.tandfonline.com/doi/                       functional design approach to select and place trees for
abs/10.1080/08111140903437716                                            optimal shade benefit to commuting pedestrians. Sustainable
                                                                         Cities and Society 52, 101816. URL https://doi.org/10.1016/j.
Coutts, A. M., Harris, R., 2013. A multi-scale assessment of urban
                                                                         scs.2019.101816 https://www.sciencedirect.com/science/article/
heating in Melbourne during an extreme heat event: policy
                                                                         pii/S2210670719316130
approaches for adaptation. Tech. rep., Victorian Centre for
Climate Change Adaptation Research.                                      Lindberg, F., Grimmond, C. S., Gabey, A., Huang, B., Kent, C. W.,
                                                                         Sun, T., Theeuwes, N. E., Järvi, L., Ward, H. C., Capel-Timms, I.,
Coutts, A. M., Tapper, N. J., Beringer, J., Loughnan, M., Demuzere,
                                                                         Chang, Y., Jonsson, P., Krave, N., Liu, D., Meyer, D., Olofson, K. F.
M., 2012. Watering our Cities: The capacity for Water Sensitive
                                                                         G., Tan, J., Wästberg, D., Xue, L., Zhang, Z., 2018. Urban Multi-
Urban Design to support urban cooling and improve human
                                                                         scale Environmental Predictor (UMEP): An integrated tool for
thermal comfort in the Australian context. Progress in Physical
                                                                         city-based climate services. Environmental Modelling and
Geography 37 (1), 2–28. URL http://ppg.sagepub.com/cgi/
                                                                         Software 99, 70–87.
doi/10.1177/0309133312461032
CRC for Water Sensitive Cities | 23
Loughnan, M. E., Tapper, N., Phan, T., Lynch, K., McInnes, J., 2013. PWC, 2011. Protecting human health and safety during
A spatial vulnerability analysis of urban populations during severe and extreme heat events: A national framework.
extreme heat events in Australian capital cities. Tech. rep., PricewaterhouseCoopers Australia. http://www.pwc.com.au/
National Climate Change Adaptation Research Facility, Gold industry/government/assets/extreme-heat-events-nov11.pdf.
Coast.
QGIS Development Team, 2009. QGIS Geographic Information
Martilli, A., Krayenhoff, E. S. and Nazarian, N. 2020. ‘Is the Urban System. Open Source Geospatial Foundation. URL http://qgis.
Heat Island intensity relevant for heat mitigation studies?’, Urban osgeo.org.
Climate, 31. doi: 10.1016/j.uclim.2019.100541.
Renouf, M. A., Kenway, S. J., Bertram, N., London, G., Sainsbury,
Motazedian, A., 2017. The microclimatic interaction of a small O., Todorovic, T., Nice, K., Surendran, S., Moravej, M., 2020. Water
urban park with its surrounding urban environment: case study Sensitive Outcomes for Infill Development: Salisbury Case Study
of projected impacts of urban densification focusing on heat Performance Analysis Report. Tech. rep., Cooperative Research
events in Melbourne. Phd, Monash University. Centre for Water Sensitive Cities (https://watersensitivecities.
org.au/content/project-irp4/), Melbourne.
Motazedian, A., Coutts, A. M., Tapper, N. J., 2020. The
microclimatic interaction of a small urban park in central Stern, N., 2008. The economics of climate change. American
Melbourne with its surrounding urban environment during Economic Review 98 (2), 1–37. URL http://www.jstor.org/
heat events. Urban Forestry & Urban Greening. URL https://doi. stable/10.2307/29729990
org/10.1016/j.ufug.2020.126688
Thom, J., Coutts, A., Broadbent, A. M., Tapper, N. J., 2016. The
Nice, K. A., 2020. Targeted urban heat mitigation strategies using influence of increasing tree cover on mean radiant temperature
urban morphology databases and micro-climate modelling to across a mixed development suburb in Adelaide, Australia.
examine the urban heat profile. In: EGU General Assembly 2020, Urban Forestry & Urban Greening 20, 233–242. URL http://dx.doi.
Online, 4-8 May 2020. org/10.1016/j.ufug.2016.08.016
Nice, K. A., Coutts, A. M., Tapper, N. J., 2018. Development of Todorovic, T., London, G., Bertram, N., Sainsbury, O., Renouf,
the VTUF-3D v1.0 urban micro-climate model to support M. A., Nice, K. A., Kenway, S. J., 2019. Models for Water sensitive
assessment of urban vegetation influences on human thermal Middle Suburban Infill Development. In: State of Australian
comfort. Urban Climate 24, 1052–1076. Cities Conference and PhD Symposium, 30th November-5th
December, 2019, Perth, Western Australia.
Nice, K. A., Tapper, N., Beringer, J., Coutts, A., Krayenhoff, S., 2014.
An urban micro-climate model for assessing impacts of Water Torok, S. J., Morris, C. J. G., Skinner, C., Plummer, N., 2001. Urban
Sensitive Urban Design. In: Water Sensitive Cities Conference heat island features of southeast Australian towns. Aust. Met.
2014, 21-23 October, 2014, Melbourne. Mag 50, 1–13.
Nicholls, N., Skinner, C., Loughnan, M., Tapper, N., 2008. A simple Urich, C., Harold, T., 2020. Water Sensitive Cities Scenario
heat alert system for Melbourne, Australia. International Journal Tool – TARGET Module. Industry Note. Melbourne, CRC for
of Biometeorology 52 (5), 375–84. URL http://www.ncbi.nlm.nih. Water Sensitive Cities. URL https://watersensitivecities.org.au/
gov/pubmed/18058138 content/water-sensitive-cities-scenario-tool-target-module/
Norton, B. A., Coutts, A. M., Livesley, S. J., Harris, R. J., Hunter, A. Wang, Y., Wang, A., Zhai, J., Tao, H., Jiang, T., Su, B., Yang, J., Wang,
M., Williams, N. S. G., 2015. Planning for cooler cities: A framework G., Liu, Q., Gao, C., Kundzewicz, Z. W., Zhan, M., Feng, Z., Fischer,
to prioritise green infrastructure to mitigate high temperatures in T., 2019. Tens of thousands additional deaths annually in cities of
urban landscapes. Landscape and Urban Planning 134, 127–138. China between 1.5C and 2.0C warming. Nature Communications
URL http://dx.doi.org/10.1016/j.landurbplan.2014.10.018 10, 3376. URL http://dx.doi.org/10.1038/s41467-019-11283-w
Nury, S. N., 2015. Informed implementation of greening as a heat Welbergen, J. A., Klose, S. M., Markus, N., Eby, P., 2008. Climate
mitigation measure in Melbourne, Australia: a remote sensing change and the effects of temperature extremes on Australian
study. Ph.D. thesis, Monash University. flying-foxes. Proc. R. Soc. B 275, 419–425.
Oke, T. R., 1995. The Heat Island of the Urban Boundary Zuo, J., Pullen, S., Palmer, J., Bennetts, H., Chileshe, N., Ma, T.,
Layer: Characteristics, Causes and Effects. In: Cermak, J., 2015. Impacts of heat waves and corresponding measures: a
Davenport, A., Plate, E., Viegas, D. (Eds.), Wind Climate in Cities. review. Journal of Cleaner Production 92, 1–12. URL https://www.
Springer, Dordrecht, pp. 81–107. URL https://link.springer.com/ sciencedirect.com/science/article/pii/S1877343511000029
chapter/10.1007%2F978-94-017-3686-2 5
Oke, T. R., Crowther, J. M., McNaughton, K. G., Monteith, J. L.,
Gardiner, B., 1989. The Micrometeorology of the Urban Forest
[and Discussion]. Philosophical Transactions of the Royal
Society B: Biological Sciences 324 (1223), 335–349.Cooperative Research Centre for Water Sensitive Cities
27 Chancellors Walk
Monash University info@crcwsc.org.au www.watersensitivecities.org.au
Clayton, Victoria 3168You can also read