Manchester Migration A Profile of Manchester's migration patterns - Elisa Bullen Public Intelligence
←
→
Page content transcription
If your browser does not render page correctly, please read the page content below
Manchester Migration
A Profile of Manchester’s migration patterns

Elisa Bullen

Public Intelligence

Performance and Intelligence

Chief Executive’s Department

Date: March 2015

Version 2015/v1.3

                                               www.manchester.gov.uk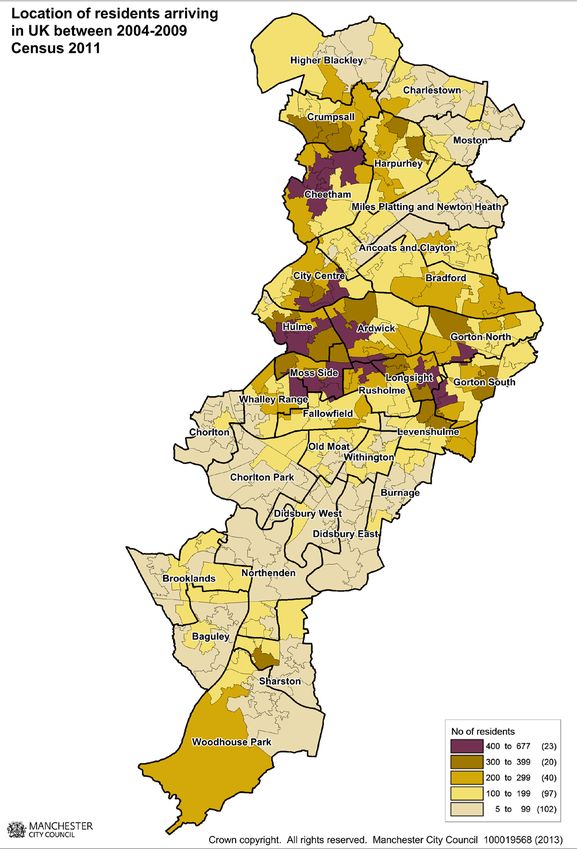
Introduction...................................................................................................................................................3

Manchester’s Migration History.....................................................................................................................3

      International migration trends ................................................................................................................3

      Internal migration trends ........................................................................................................................4

Household movement ...................................................................................................................................5

      Households moving within a ward .........................................................................................................8

      Households moving from one Manchester ward to another ...................................................................9

Long-term International Migration ...............................................................................................................11

      Wards popular with recent movers from abroad ..................................................................................13

      Country of birth ....................................................................................................................................15

      Age of international immigrants ...........................................................................................................18

      Immigrants aged 18 to 24 years old .....................................................................................................18

      Economic data.....................................................................................................................................20

      Country of origin ..................................................................................................................................21

      Comparisons with other areas .............................................................................................................24

      Languages spoken ..............................................................................................................................25

      Proficiency in English ..........................................................................................................................26

      Ethnic groups ......................................................................................................................................28

      Effect of international migration on Manchester’s child population ....................................................... 32

      Fertility rates of international migrants .................................................................................................37

Short-term Residents ..................................................................................................................................38

Internal Migration ........................................................................................................................................39

      Internal flows .......................................................................................................................................39

      Regional moves ...................................................................................................................................40

      Moves within Greater Manchester .......................................................................................................41

      Wards popular with movers to and from the rest of the UK .................................................................. 42

      Change of address ..............................................................................................................................43

      Age of UK migrants .............................................................................................................................44

Appendix ....................................................................................................................................................48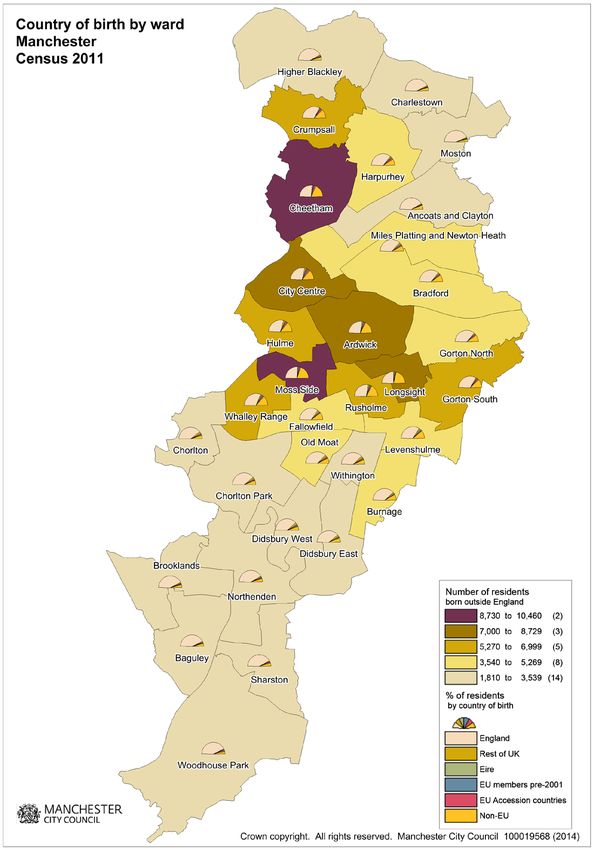
Introduction
This report looks at Census data relating to people moving into, around, and out of Manchester (both
abroad and within the UK) and details some of the key characteristics of residents living in specific areas
around the city. It focuses particularly on international immigration as this element plays such an important
part in Manchester’s demographic structure.

Manchester’s Migration History
International migration trends

Manchester has been attracting people to the city from abroad since its inception by the Romans in around
80AD, but it was the industrial revolution that kick-started large scale immigration, beginning with Irish
migrants taking up work in the mills and followed by Jewish migrants fleeing persecution in Eastern Europe.
Moving ahead to the middle of the 20th century, migrants generally arrived in this country because of
problems in their countries of birth, such as war, civil unrest, discrimination and, like the Irish migrants a
century before, poverty. The main immigrants between 1951 and 1971 were the Irish, Caribbean
(particularly Jamaicans), South-Africans, East African Asians from Kenya and people from India and
Pakistan. Most of these migrants settled around the city centre, with the Irish and Asian migrants choosing
north and east of the city centre in places like Cheetham and Ardwick, whilst the migrants from Black ethnic
groups settled to the south, predominantly in Moss Side.

Across the country, conflict played a large part in international immigration from 1971 up to 2003, starting
with an inflow of people from Bangladesh, followed by Ugandan-born Asians, Vietnamese, Iranians, Iraqis,
Afghans, Rwandans, Zimbabweans, Somalians, Angolans, Bosnians, Kosovans and Albanians. People
from Bangladesh and Somalia were particularly attracted to Manchester, with Bangladeshi people settling
in Longsight and Somalians in Moss Side.

The beginning of 2004, however, marked a shift in reasons for immigration to Manchester, becoming
increasingly due to ‘pull’ factors such as employment and education rather than the ‘push’ factors relating to
conflict, with the exception of Nigerians arriving because of civil conflict at home. Family ties and changes
in legislation also started to have a greater effect on immigration to the UK, particularly resulting from
countries joining the European Union (EU) in May 2004. Their new-found employment mobility led to
migrants from eight of the new members, collectively known as the A8, arriving in the UK in their thousands
from Europe 1. Malta and Cyprus also joined the EU in 2004 but were viewed differently from the A8 which
consisted of relatively poorer countries in Central and Eastern Europe. Most of the fifteen existing members
of the EU placed tight temporary restrictions on A8 migrants’ access to their labour markets and state
support systems, some of which continued until 2011 2, but the UK opened its labour markets in 2004
making the UK more attractive (until May 2011 there were, however, restrictions on housing rights, and
access to social benefits in the UK were subject to being registered under the government’s Worker
Registration Scheme and being in employment). Bulgaria and Romania joined the EU in 2007, the EU’s
poorest members, and temporary work restrictions were put in place because of concerns about the
volume of low-skilled migrants that may be attracted to the UK. These restrictions were lifted in January
2014 and as yet it is not fully known what effect this will have on immigration numbers from these two
countries. Since 2007, the only country to join the EU, with the subsequent potential for work-related
immigration to the UK, has been Croatia. According to the Office for National Statistics (ONS) 80% of
residents born in recent EU Accession countries arrived in the UK after 2001, with the largest proportion of
this being from Polish-born residents.

Towards the end of the last decade there had been a return to receiving higher numbers of migrants in
Manchester from countries in economic crisis, such as from Spain between 2007 and 2009. There had also
been rapid population growth in Nigeria leading to a larger number of migrants settling in Gorton, and more
recently, between 2010 and 2011, an increase in the number of Chinese immigrants, reflecting the high
proportion of Chinese students taking advantage of higher education in Manchester. Changes in 2012 to
immigration rules for non-EEA nationals seeking permission to stay in the UK with a family member in the
UK also resulted in a spike in non-EEA immigration between 2010 and 2011 when these changes were first

1
    2004 EU Accession: A8 - Czech Republic, Estonia, Hungary, Latvia, Lithuania, Poland, Slovakia, Slovenia - plus Malta and Cyprus
2
    Germany and Austria were closed to A8 migrant workers until April 2011                                                            3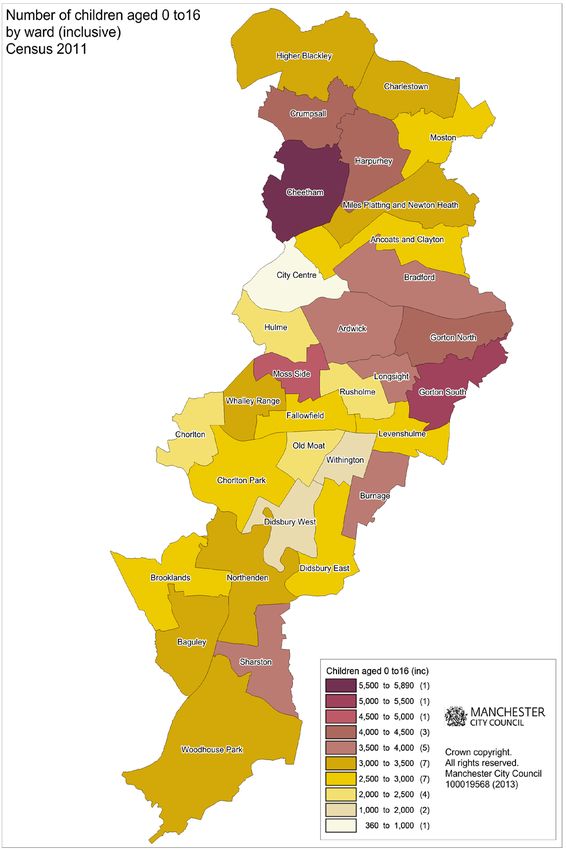
discussed, particularly from Pakistan and India. Recent estimates from ONS suggest that 2012 to 2013 saw
a fall in the number of international immigrants arriving in Manchester, down to 11,127 people compared to
12,167 the previous year. There are a number of reasons for this decrease, but mostly being a reduction in
the number of foreign postgraduates and EU undergraduates at Manchester’s universities. Initial findings
for 2013 to 2014 suggest this may have been a temporary decline as foreign student numbers appear to be
recovering and schools have seen rising numbers of children entering the system during the school year.

There are very little data available relating to international emigration (the movement of people out of the
UK to abroad). One dataset that gives an idea of where people emigrate to is the International Passenger
Survey but this is only a sample survey and is not broken down to subnational level. It has shown however,
that between 2001 and 2011 British citizens were more likely to leave the UK to live in Australia, Spain,
USA, New Zealand and France respectively, whereas non-British citizens resident in the UK were more
likely to leave to live in Australia, Poland, USA, South Africa and New Zealand respectively 3. At Manchester
level, the only data held on emigration is the estimated total number of people emigrating from Manchester
each year to live abroad from ONS, regardless of their nationality, and these data show a low of 4,785 in
mid-2002 to mid-2003 and a high of 9,332 in mid-2004 to mid-2005 leaving Manchester in the years
between 2001 and 2012, with an average figure of 7,300 per annum during these eleven years. The latest
estimates suggest a rise in international emigration from 7,378 leaving in the period 2011 to 2012 to 8,258
estimated to have left between 2012 and 2013 4.

Internal migration trends

Internal migration refers to the movement of residents within the UK (not Manchester) and has tended to be
for two reasons:

    •    Moving for employment reasons either to find work or to go where there are better job prospects
    •    Moving for lifestyle reasons either for a better quality of life or for lifestyle changes such as raising a
         family or retiring.

Historically, the ‘pull’ factor of work in Manchester, being the industrial urban core in the region, led to
higher inward migration than outward migration. However, since the decline in the manufacturing industry
this has changed and there has been a reversal to greater outward migration as people have chosen to
move to London or more rural and coastal places, helped by a better transport infrastructure and
homeworking. This has meant that Manchester has had a net outward internal migration flow for many
years, although only by a couple of thousand people annually. Recent trends have seen this net figure
decrease substantially as more people have been attracted into the city for employment, higher education
and lifestyle opportunities as Manchester has become a desirable place to live. There is a particularly large
influx of people from London, who will include students and international immigrants who have settled there
(so will be classed as internal migrants as they move within the UK) and now want a lower cost of living,
and a significant number of people from Salford, Liverpool and from parts of Lancashire. The latest figures
for 2012-13, however, have bucked this trend, with fewer people estimated to have moved in and greater
numbers estimated to have moved out, so the net outward internal migration figure has grown. Whether
this is the start of a new trend, or just a one-off dip, remains to be seen.

The outward migration over the last decade has most likely been for lifestyle reasons, although findings by
Experian reported in 2007 showed that 70% of residents moved less than ten miles from their previous
address with previous surveys showing similar results pointing to consistency over time5. This agrees with
figures supplied by ONS suggesting the greatest number of moves is to somewhere else in Manchester,
but for those moving out of the city, most move to other districts in Greater Manchester. Manchester’s
geography means that it is possible to move less than ten miles and easily end up crossing the border into
another district in Greater Manchester. After moves to Greater Manchester, the next most popular
destination is London, which is more likely to be for employment reasons.

3
  There are issues with confidence for the magnitude of all the above destinations however Australia, USA and New Zealand tend to be
more reliable estimates
4
  Source: Mid-Year Estimates Components of Change from ONS
5
  Demography, Migration & Diversity in the Northwest, Experian 2007                                                              4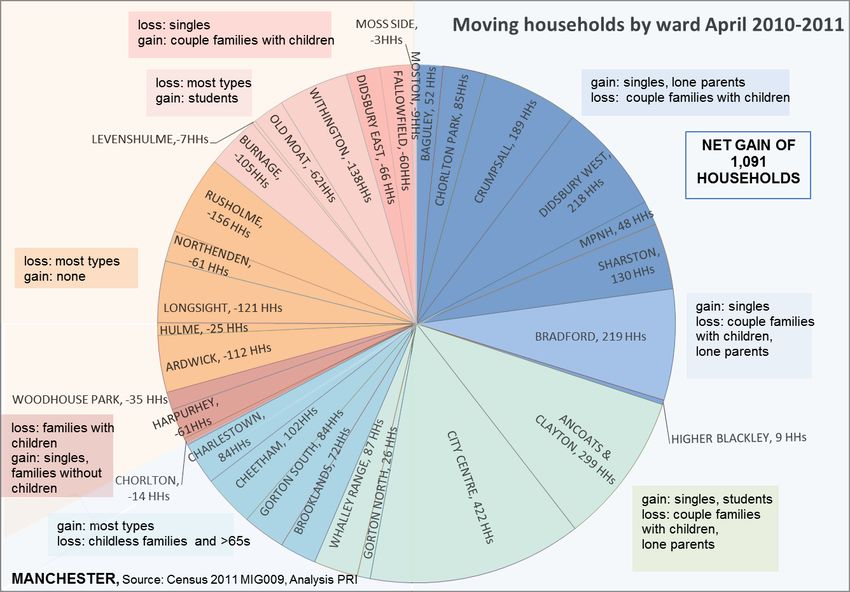
Household movement
Household data were released in February 2015 detailing where residents lived in April 2010, a year before
the Census. In terms of whole household movement, i.e. excluding individuals leaving a larger household
(classed as ‘partially moving’) Manchester saw 19.5% of whole households at a different address than a
year earlier, compared to the national average of just 8.4%, demonstrating the high volume of migration
seen in the city. Manchester had over a thousand more households in 2011 but this was not spread evenly
throughout the city and there was variety in the type of households formed, with the rise in 1-person
households largely responsible for the increased number of households from the same time a year earlier.

Figure 1: Households in Manchester wards in 2011 that lived elsewhere in April 2010

Figure 1 shows the proportion of households by ward that lived in a different place a year earlier than the
2011 Census where the whole household has moved; this could be somewhere else in the same ward, a
different Manchester ward, or from outside of Manchester, including from abroad, suggesting that City
Centre ward households are extremely transient.

Figure 2 shows the change in household types at city level, illustrating the rise in single person households
and decrease in families. N.B. this is a snapshot comparing April 2010 with April 2011; many households
would have moved in between those dates.

Figure 2: Change in household type in Manchester April 2010- April 2011
Around 14,600 moves were made in and out of Manchester by single people aged under 65, gaining 1,362
households overall, excluding students who were a separate category but also gained overall. All other
types decreased, apart from ‘Other households’ which gained 123 households without children (includes
lodgers, all adult households and temporary residents) and 16 households with children over the period.

Figure 3 shows the broad changes of whole households in terms of gains and losses in each ward by
household type, over the year to April 2011, with blue Areas labelled 1-4 indicating wards that saw a net
migration gain in households and red Areas 5-8 those with a loss. The data may not indicate a trend, but
there was a definite move towards increasing numbers of working age 1-person households in most wards,
usually to the detriment of families with children, meaning a potentially greater housing requirement for
fewer people. Only the wards in the areas marked ‘4’ and ‘8’ gained families in couples with children, but
households in ‘8’ had net migration losses because of falling numbers of 1-person households. Area ‘1’
gained lone parents but lost couples with children whereas Area ‘5’ gained couples but without children.

Areas ‘3’, ‘4’ and ‘7’ saw small student household increases – first year students would tend towards Halls
of Residence (not classed as households) and subsequent years of study would likely see most students
moving either within the ward (see Figure 7) or within Manchester. Those moving from their original ward of
residence appeared to favour areas south of and including the city centre in areas normally associated with
students, with the exception of Hulme whose net loss to migration included student households.

The largest net gains at ward level were those wards in Area ‘3’, namely City Centre and Ancoats &
Clayton, both gaining large numbers of 1-person aged under 65 households (477 and 200 respectively) and
around 60 student households each. Didsbury West also gained 200 working age singles but saw
increases in lone parents (12 households) rather than students (7 households).Hidden within these figures,
however, is the substantial loss of 143 families in the City Centre ward, half of which had dependent
children. This is the highest loss of families in the city, followed by Harpurhey which lost 91 families, two
thirds of which had dependent children.

Figure 3: Whole households net change at ward level by household type, 2010-2011

                                                             8
                                                     7                    1

                                              6
                                                                               2
                                               5
                                                         4            3

                                                                                                            6
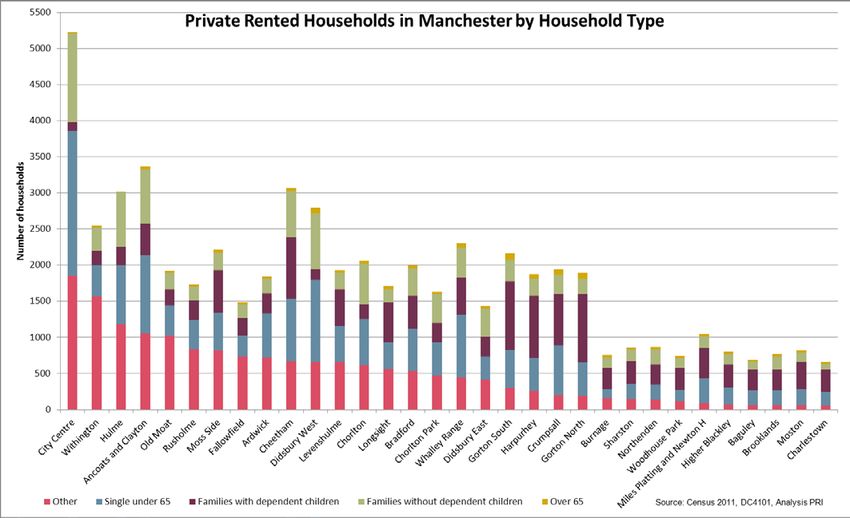
Figure 4 shows the tenure of households that had a different address a year before the Census by type
and by where they lived before. Most common were households that were private rented, followed by
owner occupier. All tenure types had more households living elsewhere in Manchester a year earlier than
living outside Manchester. This figure does not show the tenure of those households that left the city.

Figure 4: Tenure of households that had a different address one year ago

At ward level, Figure 5 shows that whilst there is a lot of movement in private rented households, there is
also a good amount of stability, with most wards having more households that have not moved in a year
than lived elsewhere a year earlier. Only private rented households have been looked at in detail because
this is the dominant tenure type for recent immigrants.

Figure 5: Private rented households in Manchester, address one year ago
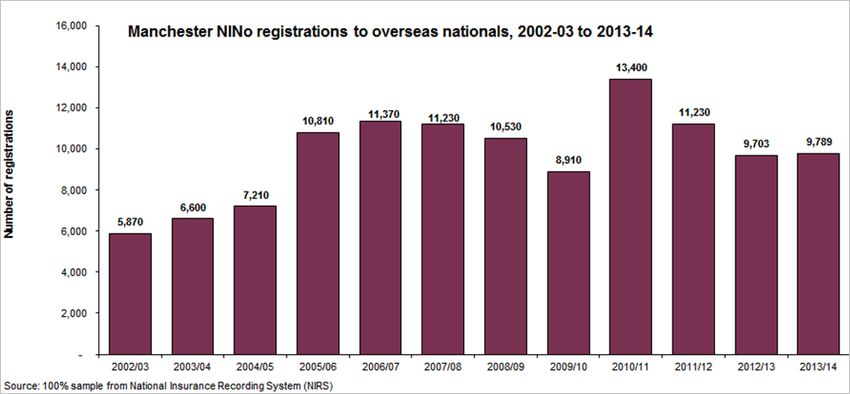
Figure 6: Private rented households by ward, address one year ago

Figure 6 shows the distribution of private rented households that lived elsewhere a year earlier at ward
level, indicating where the residents in those households originated from. 42-70% of residents that moved
from a ward to another ward or elsewhere in the UK had been in private rented tenure in 2010, with the
wards at the lower end of this range being high in social rented movers. Only Didsbury and Chorlton had
high percentages of owner occupiers that had left the city to live elsewhere, with the majority of those
having left Manchester altogether.

Households moving within a ward

Figure 7 shows how many whole households moved but stayed within the same ward. There were 4,000
moving households staying in the same ward out of 13,000 households moving within Manchester (44% of
all whole household migration, excluding Manchester households moving out of UK which is not recorded).

Figure 7: Resident households in Manchester in April 2011 that lived elsewhere in the ward in April 2010

                                                                                                            8
Households moving from one Manchester ward to another Figure 8: Resident households moving between Manchester wards, address one year ago Figure 8 shows the inflow and outflow of each ward in Manchester of whole households living in a different Manchester ward a year before the Census, with Ancoats and Clayton being the most popular ward in the city with 476 households stating they had lived elsewhere a year earlier. All household types were attracted into the ward apart from those aged over 65 and families with non-dependent children, but this was not specific to this ward, all wards in Manchester had very low numbers of these types moving around the city. The greatest number of household types moving into Ancoats and Clayton was single working age people (just under 200 households). All this movement into Ancoats and Clayton was countered by 380 households moving out, half of which were single working age people, so ultimately there was only a net gain of 100 households, many of which were students and those classed as other households, typically short term residents. This illustrates the extensive turnover of residents in this ward. City Centre and Didsbury West wards also attracted over 400 Manchester households across into their borders half of which were again single people younger than 65, however whilst Didsbury West added around 100 households overall, City Centre had a greater outflow so lost more households than it gained. This was also true in Ardwick where the number of households that had left Ardwick a year earlier to live in other wards far outweighed the number that had moved in. Brooklands and Burnage attracted the fewest households from other Manchester wards over the year, although Brooklands fared slightly better by having one of the higher numbers of net gains. All wards in Wythenshawe with the exception of Sharston were in the bottom ten wards for attracting households from elsewhere in the city. The most successful ward in attracting and retaining both singles and families was Charlestown with around 60 households more of each in 2011 than at the same point the previous year. Tables 1a and 1b show the wards with the highest net gain in the numbers of households (families include couples without children). The tables do not include gains from the ‘Other’ category which cover households that are generally transient in nature, such as student households and short term residents. Table 2 shows wards with the highest net gains (green) and highest net losses (pink) in other types of households in 2011 compared to the same point in 2010. 9
Table 1a and 1b: Wards with highest number of households gained on previous year from other wards, 2011
Ward                                  Gain in 1-person hh           Ward                                  Gain in family hh
Didsbury West                                           83          Charlestown                                          57
Charlestown                                             61          Didsbury East                                        54
Whalley Range                                           61          Sharston                                             47
Crumpsall                                               53          Moston                                               36
Gorton North                                            47          Baguley                                              34
Higher Blackley                                         34          Gorton South                                         32
Sharston                                                34          Moss Side                                            30
Chorlton Park                                           25          Miles Platting & Newton Heath                        29
Cheetham                                                22          Northenden                                           29
Miles Platting & Newton Heath                           19          Bradford                                             26

Table 2: Number of ‘other’ households gained/lost on previous year from other wards, 2011

Ward              Net change in households
Ancoats & Clayton                        69
Bradford                                 45
Sharston                                 20
City Centre                              18
Whalley Range                            15
Didsbury West                            13
Withington                              -12
Moss Side                               -14
Fallowfield                             -18
Longsight                               -30
Rusholme                                -50
Ardwick                                 -75
Source: Census 2011 UKMig009, Analysis PRI

Didsbury West, Whalley Range and Sharston therefore had the greatest gains in households that were not
family-focussed. Overall, however, the wards with the greatest numbers of household increases on the
previous year were Charlestown with a 126 net gain followed by Sharston with 101 more households; the
large gain in other households in Ancoats and Clayton, half of which were student households, made it third
highest in the city with 96 households more than at the same point a year earlier.

In terms of wards losing households to other wards in Manchester from one year to the next, City Centre
saw the highest outflow of 510 households, but as mentioned earlier, this was tempered by the inflow from
other wards. Ardwick saw the next highest number households leaving to live elsewhere in Manchester but
again had a reasonable inflow so had a smaller overall loss than Rusholme which had 165 fewer
households overall in 2011 than the previous year, the highest number of households in the city. So these
wards, like those mentioned earlier are subject to significant flows in from and out of other wards. Tables
3a and 3b show the wards with the highest loss in household numbers, excluding other households.

Table 3a and 3b: Number of households lost on previous year to other wards, 2011
Ward                Loss in 1-person hh        Ward                  Loss in family hh
Rusholme                             -76       City Centre                            -71
Hulme                                -68       Harpurhey                              -66
Longsight                            -53       Ardwick                                -53
Ardwick                              -47       Longsight                              -51
Fallowfield                          -42       Gorton North                           -49
Didsbury East                        -40       Withington                             -46
Burnage                              -40       Rusholme                               -39
Northenden                           -39       Woodhouse Park                         -24
Old Moat                             -28       Hulme                                  -20
Withington                           -23       Cheetham                               -16

Some wards, namely Whalley Range, Burnage and Woodhouse Park, saw a shift in their typology because
of movement to or from other wards, for example, in Whalley Range where there was a net gain of 61
single person households but a net loss of 14 families. This occurred to a lesser degree in Woodhouse
Park, whereas Burnage gained a small number of families and lost single person households.            10
Long-term International Migration
The estimated population of Manchester between 2001 and 2011 grew by 80,200 (19%) between 2001 and
2011 to stand at 503,127. This rapid population growth has been spread unevenly across the city’s wards
with the highest growth rate within the City Centre Ward and surrounding wards of Hulme, Cheetham,
Ardwick, Ancoats and Clayton and Moss Side, as well as to the east in Gorton South and Bradford. Taken
together, these eight wards account for 58% of the city’s total population growth.

A substantial proportion of the city’s population growth can be attributed to new arrivals to the UK who have
settled in Manchester recently. National figures show that half of all foreign-born residents in 2011 stated
that their year of arrival was during the period 2001-2011. Their countries of birth are mostly different from
earlier migration groups. Many of the most recent arrivals will be students and temporary workers who may
subsequently return to their country of birth. Unfortunately, very few statistics count international emigration
so it is difficult to calculate how many actually return home or when. These recent international immigrants
total 81,000 residents, forming 16% of the city’s 2011 resident population. As this number is higher than the
overall growth in the city, previous residents must have emigrated, either abroad or elsewhere in the UK, so
there has likely been a demographic shift in Manchester as UK-born residents have been replaced by non-
UK residents (although a proportion of emigrants will also be foreign-born). The recent immigrants are more
likely to be aged 20 to 34, making the mean average age of a Manchester resident lower than in 2001.

Figure 9: Residents arriving in the UK between 2001 and 2011 by ward

Source: Census Table QS801, ONS, Crown Copyright

Figure 9 shows the number of residents in each ward who arrived in the UK over the last decade (not
necessarily arriving in Manchester first) to show the impact of recent immigration in these areas.          11
Map 1 details international immigration from 2004 to 2009 by lower super output areas (LSOAs) which are
smaller than wards, chosen because this particular time period covers a surge in immigration from abroad.

Map 1: Manchester International Immigration in LSOAs, based on arrival between 2004 and 2009 (Source: QS801, ONS)

                                                                                                                    12
The wards with the highest numbers in Figure 9 are consistent with those containing the LSOAs with the
highest numbers in Map 1, indicating that there has been no significant change in wards that attract
immigrants from abroad. It should be noted though that the data used in Figure 9 will be slightly biased
towards more recent years because they refer to the most recent arrival in the UK and some residents may
have returned home on a regular basis. Immigrants who arrived earlier in the decade are also more likely to
have emigrated out of the city since those illustrated in Map 1.
As indicated, City Centre and its neighbouring wards housed the highest numbers of new arrivals from
abroad; a third of the City Centre’s residents in 2011 arrived in the UK during the last decade with only
slightly lower proportions in neighbouring wards. Cheetham has the greatest number of new immigrants
though, with more than 6,300 residents arriving in the UK during the previous ten years. This does not
indicate any emigration, just those who were resident at the time of the Census in 2011, so residents will
have arrived and/or left during the decade; however, the ward population in Cheetham has grown by 7,400
residents since 2001 (the equivalent of some total ward populations in the rest of the country) and as 28%
of the population in 2011 have arrived from abroad between 2001 and 2011 immigrants appear to be
attracted to the ward and a proportion of those then settle there.
Nearly a third of total residents (30%) in 2011 arrived in Longsight from abroad in those ten years but it
does not feature in the highest overall population growth, being only around 1,700 higher in total than in
2001. This suggests that as immigrants have moved into Longsight they have displaced around 3,000
residents (who may also be from abroad) as well as increasing the ward’s population. Chorlton Park, by
contrast, has seen its population grow by 26% but only 8% of its residents are new arrivals suggesting
internal rather than international immigration.
Whilst figures fell in the year to 2012 across the UK and this was reflected in Manchester numbers, ONS
indicates a rise in immigration to the UK driven by EU citizens coming from Poland, Spain, Italy and
Portugal, plus a large rise in Romanian and Bulgarian migrants in 2013. This data is only available at
national level but Manchester has higher than average immigrants whose country of birth is Poland and
Spain and similar to national proportions of people born in Italy (Source: Census Table QS203, ONS, and
National Insurance registrations to foreign workers, DWP). As most immigrants have come to work in these
latest figures, and 30% have come to study, Manchester is likely to attract a significant proportion of these
immigrants, including those from Romania and Bulgaria, as it offers both these opportunities.
Wards popular with recent movers from abroad
Household data were released in February 2015 detailing where residents lived in April 2010, a year before
the Census. There is only a snapshot of data for moves to wards in Manchester from outside the UK
because if residents have moved abroad they would not have filled out the Census, so there is no detail
here about net change.
Figure 10 shows that City Centre ward was definitely the popular choice for residents that had moved to
Manchester from abroad, with more than double the number of households moving there than the next
highest ward, Hulme. It is likely that a large number of City Centre households had also left in 2010 to live
abroad or elsewhere in the UK.
The household composition of people living in Manchester who lived abroad a year before the census
differed from ward to ward in both distribution and number, but most had more 1-person households than
other types. The composition of those in City Centre ward is shown in Figure 11, displayed separately
because the scale is so much greater than other wards. The remaining wards are indicated in Figure 12.
The fact that no families or ‘other’ households and just 22 single people were aged 65 and over who lived
abroad a year earlier would seem fairly unsurprising, but these will also include expatriates returning home
so it would appear, certainly for this period, no older couples returned to Manchester.
13Figure 10: Households moving from abroad to Manchester wards, address one year ago igure 11: Households moving from abroad to City Centre ward, address one year ago F Figure 12: Households moving from abroad to other wards, address one year ago
Country of birth

The proportion of Manchester residents born in England decreased from 81.4% in 2001 to 71.6% in 2011,
11.9 percentage points below the national average, as shown in Table 4. A large increase in residents
born in ‘Other countries’, mainly due to immigration from Pakistan (and, to a lesser degree, India) and
totalling 95,000 residents in 2011 means immigrants from these countries now form 19% of the total
population, double the national proportion, as shown in Table 4. There are also nearly 23,000 residents
born in EU countries outside the British Isles. Manchester ranks joint 4th in England and Wales for the
proportion of residents born in Northern Ireland.

Table 4: Manchester residents’ broad country of birth in 2011 compared to the national average
  KS204EW – Country of
  Birth, ONS                                                                          %
                                                                                      UK not                  Other    Other EU:
                                                                                   otherwise                    EU:    Accession
                                                Northern                                                                               Other
  2011             Total            England                  Scotland    Wales      specified    Ireland    Member      countries
                                                                                                                                    countries
                                                 Ireland                                                   countries   Apr 2001-
                                                                                                           Mar 2001    Mar 2011
  Manchester       503,127         71.6        0.9          1.3          0.9       0.0           1.7       1.9         2.6          19.0
  England          53,012,456      83.5        0.4          1.3          1.0       0.0           0.7       1.7         2.0          9.4

Figure 13 shows Manchester residents’ country of birth has changed more than average in percentage
terms, with ‘Other EU’ and non-EU countries replacing those born in the British Isles for 2001 to 2011.

Figure 13: Percentage point difference in residents’ country of birth, 2011 compared to 2001

Source: Census Tables KS204 (2011) and KS05 (2001), ONS

Manchester has some marked differences compared to England regarding the countries of birth of
immigrants. India, followed by Poland, Pakistan, Ireland, Germany, Bangladesh, Nigeria, South Africa,
USA, and Jamaica were the top ten countries of birth recorded nationally on the 2011 Census from outside
the UK. Indian-born had been the second highest ranking non-UK country of birth from 1961 up until 2001
but in 2011 Indian-born residents became the largest non-UK born population. As Figure 14 shows, this is
not the case in Manchester, with the top three countries of birth outside England being very different.

Since the initial influx of Pakistani-born immigrants in the 1950s, immigration from Pakistan to Manchester
has continued to increase. Unlike the rest of the UK, where it has ranked third in every census since1981, it
has since topped the non-UK country of birth ranking. Pakistan-born residents are the second largest
population in Manchester (‘born in England’ being highest), much higher than those born in Scotland or
India which are second and third nationally (when including the rest of the UK in the figures).

                                                                                                                                          15
In Manchester the top ten non-UK countries of birth recorded on the 2011 Census were, in numerical order,
Pakistan, Ireland, Poland, China, Nigeria, India, Somalia, Jamaica, Bangladesh and Germany.
Figure 14: Proportion of resident population born outside England, Manchester compared to national average, 2011*
4.5
Country of Birth other than England as a proportion of total population
4.0 England compared to Manchester
3.5
3.0
% of all residents
2.5
2.0
1.5
1.0
0.5
0.0
Wales
Nigeria
India
Poland
Hong Kong
Lithuania
Australia
Zimbabwe
Romania
South Africa
Turkey
Northern Ireland
Somalia
Iran
China
Bangladesh
United States
Portugal
Sri Lanka
Italy
Ghana
Philippines
Pakistan
Ireland
Scotland
Jamaica
Germany
France
Spain
Kenya
Other Australasia
England Manchester
*countries with percentages just above 0 not shown Source: Census Table QS203, ONS, Crown Copyright
Within Manchester, certain areas have settled communities that people are attracted to from abroad.
Knowing where there are high levels of immigration can help in gauging the needs of those residents and
emerging or changing communities can be identified. At ward level, Sharston has the highest number of
residents born in England and Moston the highest proportion within a ward. Conversely, Rusholme has the
lowest number of residents born in England and Longsight the lowest proportion, with just fewer than half
the residents not of English birth (49%).
The areas of Manchester that have the highest proportions of residents born in the British Isles and abroad
are listed below in Table 5 by lower super output area (LSOA), with the ward that the majority of the LSOA
falls into indicated. This table just shows the highest in the city, not the spread, so there will be clusters
elsewhere of residents not born in England.
Table 5: Areas with the highest proportion of resident population from each broad country of birth category, 2011
KS204EW LSOA Total residents Total residents
% of this group
Country of 2011 Within Ward Country of Birth born in this in this LSOA at
in this LSOA
Birth, ONS name group 2011
E01005229 007E Moston England 1,460 1,539 94.9%
E01005281 026B Rusholme Northern Ireland 61 2,239 2.7%
E01033682 060C City Centre Scotland 47 1,261 3.7%
E01005312 036E Withington Wales 54 1,811 3.0%
E01005119 041A Burnage Ireland 67 1,531 4.4%
E01033653 055B City Centre Other EU: 107 1,670 6.4%
members in 2001
E01033675 058D Cheetham Other EU: 248 2,064 12.0%
Accession
E01005145 008A Cheetham Other countries 1,359 2,711 50.1%
The areas with the highest proportions are not the same as those with the highest numbers of residents
from these countries, as shown in Table 6. The centre of Fallowfield houses the highest numbers of
people born in the British Isles, apart from those born in Scotland, because of a large student campus
housing many university students. The centre of Hulme has the highest number of residents born in
countries outside the EU because this is a popular area with foreign students attending Manchester’s
universities.
16Table 6: Areas with the highest number of resident population from each broad country of birth category, 2011
KS204EW LSOA Total residents Total residents
% of this group in
Country of 2011 Within Ward Country of Birth born in this in this LSOA at
this LSOA
Birth, ONS name group 2011
E01005185 032B Fallowfield England 3,133 4,024 77.9%
E01005185 032B Fallowfield Northern Ireland 95 4,024 2.4%
E01035210 060C Hulme Scotland 73 3,244 2.3%
E01005185 032B Fallowfield Wales 114 4,024 2.8%
E01005180 030C Fallowfield Ireland 71 1,847 3.8%
E01005284 026C Rusholme Other EU: 146 3,436 4.2%
members in 2001
E01033654 055C City Centre Other EU: 350 2,956 11.8%
Accession
E01005210 019C Hulme Other countries 1,380 3,244 42.5%
Within the LSOAs, certain areas have high concentrations of people not born in England however, 92% of
all output areas (subsets of LSOAs) have a majority of English-born residents. The lowest proportions of
English-born residents at output area level are in Longsight (23.5%), Cheetham (26.5%) and Ardwick
(27%). Residents here have high numbers of people born in countries outside the EU; Longsight has an
established community of Bangladeshi residents, Cheetham is popular with Pakistani-born immigrants and,
increasingly, Arabic residents, whilst Ardwick houses many people born in India so it is probable that non-
English residents were born in these countries. One particular Cheetham output area also has relatively
high numbers of residents born in EU Accession countries, and contains a large block of luxury apartments
so it is possible that this particular complex is attracting the high proportion of non-English residents.
The highest number of non-English born residents within an output area in 2011 is 759 people, centred on
Manchester Metropolitan University’s city centre halls of residence in Hulme. The majority of people who
are not English in this output area are from countries outside the EU (591 residents) and it is an area
popular with south-east Asian students. All of the top ten output areas with the highest numbers of non-
English born residents are predominantly from countries outside the EU apart from one, just south of
Piccadilly Station in the city centre, which has the highest number, by far, of residents born in EU
Accession countries and, again, is home to a number of halls of residence. The highest number of English-
born residents in an output area falls inside LSOA 032B already mentioned, containing Manchester
University’s largest hall of residence on the Fallowfield campus.
Table 7 is produced by ONS using the Annual Population Survey (APS), which is the Labour Force Survey
plus various sample boosts to derive estimates of Manchester’s non-UK born population. N.B. the total
resident population in this table is higher than mid-year estimates for January 2011 onwards, and the non-
UK born estimate for 2013 is much lower than usual, even accounting for the confidence interval provided.
This is somewhat counter-intuitive with a growing population.
Table 7: Estimated population resident in the United Kingdom, by nationality
Non-UK
Resident
Manchester Born CI +/-
Population
Estimate
Jan 2004 to Dec 2004 430,000 75,000 12,000
Jan 2005 to Dec 2005 438,000 80,000 13,000
Jan 2006 to Dec 2006 446,000 95,000 14,000
Jan 2007 to Dec 2007 453,000 102,000 15,000
Jan 2008 to Dec 2008 461,000 99,000 15,000
Jan 2009 to Dec 2009 465,000 111,000 15,000
Jan 2010 to Dec 2010 489,000 123,000 17,000
Jan 2011 to Dec 2011 505,000 135,000 18,000
Jan 2012 to Dec 2012 519,000 130,000 18,000
Jan 2013 to Dec 2013 532,000 95,000 16,000
Source: Estimated population resident in the United Kingdom,
by nationality Table 2.3, ONS 2004 to 2013 17Age of international immigrants
Manchester tends towards young adult international immigrants, attracted to the city for higher education
and work opportunities. Manchester also has a large availability of reasonably priced rental property
making it a realistic place for younger immigrants to live close to work and university. That said, the indirect
impact of child-bearing age female immigration from abroad is also significant as, nationally, the total
fertility rate 6 has risen from 1.56 to 1.84 in the last decade, due mostly to non-UK born women with higher
fertility rates bearing children in the UK (although this could include second generation migrant families as
well as new arrivals). This, combined to a much lesser degree with improvements in fertility treatments and
women having babies later in life, has pushed up the annual number of births in Manchester, with an
increasing number every year as indicated in Figure 15 until 2013 when a small decrease has been
observed. In addition to this there will be a number of families bringing babies into the country from abroad
making the likely number of Manchester babies less than one year old higher.
Figure 15: Births registered in Manchester between mid 2001-mid 2002 and mid 2012- mid 2013
All Manchester Births, 2002-2013
9,000
8,000
7,000
6,000
5,000
4,000
3,000
2,000
1,000
0
2002 2003 2004 2005 2006 2007 2008 2009 2010 2011 2012 2013
Births to year ending 30 June
Source: Components of Population Change, ONS (including revisions April 2013)
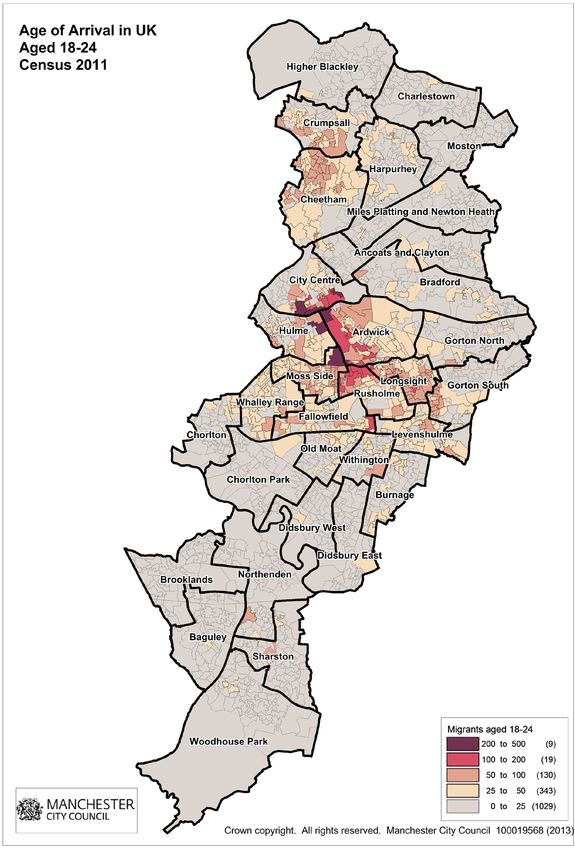
Immigrants aged 18 to 24 years old
As Table 6 illustrated, the Higher Education student population affects the number of UK-born residents
within an area significantly, particularly in Fallowfield. Map 2 shows the location of Manchester’s residents
arriving in the UK when they were aged between 18 and 24 years in greater detail (LSOA level) to illustrate
wards where numbers of university-age adults may be clustered based on their year of arrival into the UK.
The map will include young migrants arriving for work or to stay with family as well as education but data
are not split into reason for entering the UK. It is possible that any one of these residents settled elsewhere
in the UK before moving into Manchester, also they may have lived in the UK for many years before 2011
so are now older than this age group but arrived here as young adults. It is still clear despite these caveats
that the main areas indicating high numbers of immigrants in this age group relate to the two universities’
halls of residence between City Centre ward and Rusholme so year of arrival appears to be a good proxy
measure of this age group.
The lighter pink areas surrounding the City Centre-Rusholme corridor are likely to be a combination of
foreign university students and young migrant workers, whereas other lighter areas are more likely to be
young migrant workers and young adults joining family in the North (working in the city centre) and migrant
workers in Wythenshawe (working in the NHS and airport).
6
The Total Fertility Rate (TFR) is the average number of live children that a group of women aged 15-44 would bear if they experienced
the age-specific fertility rates of the calendar year in question throughout their childbearing lifespan. It provides a snapshot of the level of
fertility in a particular year and does not necessarily represent the average number of children that a group of women will have over their
lifetime. 18Map 2: Arrival of adults aged 18 to 24 at ward level in 2011 (Source: ONS)
Figure 16: Student households by ward, address one year ago

Figure 16 focusses on students in higher education that did not live in Manchester in April 2010 but did a
year later. These are people not households and shows that both domestic and international students
favour the City Centre ward and Ardwick but Fallowfield, Levenshulme and Withington are not that popular
with international students, choosing Hulme and wards associated with ethnic minority groups over these
typical ‘student’ wards. This ties in well with the findings illustrated in Map 2.

Economic data
National Insurance number (NINo) registration is usually a requirement of overseas nationals looking to
work or study in this country to allow them to take up employment or claim benefits and tax credits. Data on
the volume and country of origin of registering individuals are produced by the Department for Work and
Pensions on an annual basis from the National Insurance Recording System (NIRS).

The total number of NINo registrations to overseas nationals in Manchester in 2013-2014 was 9,789, a
small increase of 86 people, or 0.9%, since 2012-2013 as shown in Figure 17. This number is less than
those shown for Manchester later in this report where data are broken down into parliamentary
constituencies which include parts of Salford and Trafford.

Figure 17: National Insurance number registrations to overseas nationals living in Manchester, 2002 to 2013

                                                                                                              20
Country of origin
The most notable changes in Manchester between 2011-2012 and 2012-2013 were the number of
registrations by Spanish nationals, with an increase from 670 to 1,230 people, accounting for 12.7% of all
registrations in Manchester, and the decrease in the number of registrations by Pakistani nationals from
2,620 to 859 people. Both these trends continued into the period 2013-2014 at a slower rate with 1,282
registrations to Spanish nationals and just 641 registrations to Pakistani nationals. There were also
sustained increases from many EU nationals, in particular those registering from Italy and Portugal, as
seen nationally. Overall, the highest proportion of registrations in 2013-2014 was from Spain at 13.1%, with
Poland second and, despite the proportion falling to 6.5%, Pakistan third.
Registrations from A8 Accession nationals 7 have fluctuated in recent years but 2012-2013 had increased
by 15.1% from the previous year, rising from 1,830 to 2,106 immigrant registrations, of which 934 were
from Polish nationals (44.3%). The number of Polish nationals registering has decreased for 2013-2014 to
855, accounting for 8.7% of all overseas national registrations in Manchester. Nationals from Bulgaria and
Romania (A2) made 215 NINo registrations in 2012-2013 (fewer than in 2011-2012) with 71.2% being from
Romanian nationals. This number has risen in 2013-2014 to 488 registrations, 73% being Romanian.
NINo registrations to non-Accession nationals 8 fell by 1,779 (19.6%) to 7,301 in the year to 2013 following a
similar decrease in registrations (1,850) in 2011-2012. This was on the back of a particularly large increase,
ahead of immigration changes for non-EU nationals, in 2010-2011 when the number rose by 3,940 on the
previous period. The number appears to have stabilised for 2013-2014 with 7,246 registering, although
within that number there are some small increases in registrations. The top countries of origin for workers
registering in 2013-2014 are shown in Figure 18 showing how numbers have changed from 2002 to 2014.
Figure 18: Main origin of overseas nationals registering for National Insurance numbers in 2013/2014 since 2002
NINo registrations to overseas nationals by country of origin (Manchester)
3200
3000
2800
2600
2400
2200
Number of registrations
2002/03 2003/04 2004/05 2005/06 2006/07 2007/08 2008/09 2009/10 2010/11
2000
2011/12 2012/13 2013/14
1800
1600
1400
1200
1000
800
600
400
200
0
in and is ta
n
Ital
y ia Rep eri a y an ia al nce nd ep
Spa Pol Ind les Nig gar tug Fra rel a hR
Pak eop Hun Rom Por p of I ze c
a P R e C
C hi n
Source: 100% sample from National Insurance Recording System (NIRS), DWP
Countries with over 200 applicants in in 2013/14
It is clear that the rise in registrations from Spain is a recent event starting in 2010 when their economy
started to collapse, with a similar pattern in registrations from Italian, Hungarian and Portuguese
immigrants. Poland is still a popular country of origin and numbers are rising again, but the peak of
registrations definitely started with the opening of UK borders to the A8 Accession nationals in 2004.
7
See Appendix 2 for definitions
8
Countries other than those in the A8, A2, Cyprus or Malta 21Pakistan has also peaked dramatically but at a later period, anticipating the immigration policy changes in
2011. A similar, but smaller rise was seen from Indian, Chinese and Nigerian immigrants. Whilst Spain tops
the most popular countries of origin, it should be noted that Romanian registrations doubled in 2012-2013.
Certain areas in Manchester have had more overseas immigrants registering for National Insurance
numbers than others during the latest year as shown in Figure 19 which shows that most of the
registrations are from migrants settling in the Central parliamentary constituency of Manchester, followed
by the constituency of Gorton. Both these areas have already been featured as places attractive to
international immigrants and the numbers are similar to 2012-2013, although all constituencies apart from
Blackley and Broughton, where numbers have risen by roughly one hundred on the previous period, are
slightly lower on last period. Data are not available below parliamentary constituency level.
Registrations from A8 migrants average 21.6% of all NINo registrations (lower than last period’s 23.4%) but
range from 12.7% in Manchester Central to 40.7% in Blackley and Broughton parliamentary constituencies.
Blackley and Broughton constituency continues to have the highest A8 proportion of immigrant workers.
Registrations from Bulgarians and Romanians accounted for 5% of all registrations, up from 2.4% the
previous year, more prevalent as a proportion in Manchester Gorton at 6.3% compared to last period when
the highest A2 proportion within a constituency was Wythenshawe and Sale East. Non-Accession states
continue to account for most registrations, averaging 78.4%, but ranging from 59.3% in Blackley and
Broughton to 87.3% in Manchester Central. Table 8 shows the volumes of these registrations within the
constituencies.
Figure 19: NINo registrations in parliamentary constituencies covering Manchester*, 2013-14
NINo registrations in Manchester constituencies, 2013/14
4000
3597
3500
3000 2688
Number of registrations
2500 2332
2000
1500
1060
1000 794
500
0
Blackley and Manchester Central Manchester, Manchester, Wythenshawe and
Broughton Gorton Withington Sale East
Source: DWP Stat-Xplore. Crown copyright Analysis by Public Intelligence
Source: 100% sample from National Insurance Recording System (NIRS), DWP. Figures have been rounded to the nearest 10 and
therefore may not add to ‘totals’, and lead to variations in percentages.
*N.B. Blackley and Broughton, and Wythenshawe and Sale East constituencies include parts of Salford and Trafford respectively.
Table 8: NINo registrations in Manchester Parliamentary Constituencies, 2013-14
Blackley and Wythenshawe and
Central Gorton Withington Total*
Broughton Sale East
All registrations 2,332 3,597 2,688 1,060 794 10,471
A8 EU members 950 456 449 138 270 2,263
A2 EU members 74 183 169 46 48 520
A10 + A2 EU members 1,030 705 624 184 318 2,783
Non-Accession countries 1,382 3,141 2,239 922 524 8,208
Source: National Insurance Recording System, DWP * Blackley & Broughton, and Wythenshawe & Sale East include parts of Salford and
Trafford
Compared to the period 2012-2013, registrations from A8 nationals are generally slightly down in the north
of the city and slightly up in the south, whereas all constituencies have doubled their number of A2
registrations. The overall change in EU nationals is just a small increase of 66 registrations on the period,
compared to a rise of 657 non-accession registrations. Whilst the non-accession increase is spread very
evenly across the constituencies, generally Central and Gorton have lower numbers of total registrations in2013-2014 whereas Blackley and Broughton and Withington numbers have risen. The greatest increase is
in Wythenshawe and Sale East with a rise of 182, mostly from non-accession countries.
Within the totals, Spanish nationals represent the highest percentage of NINo registrations in 2013-2014,
averaging 13% of all registrations across the city but 23.4% of registrations in the Withington constituency
(compared to 7.6% of the UK). Polish national registrations are dominant within Blackley and Broughton
(18%) and Wythenshawe and Sale East (21.9%) but only form 5% of Withington’s total registrations.
Pakistani nationals account for 12.8% of registrations in Gorton, a reduction on this proportion from last
period, whilst Indian nationals account for 22.2% of registrations in Wythenshawe and Sale East, which is a
rise in proportion. Of note is the rise in proportion of Italian national registrations for Withington, now
forming the second highest proportion after Spain with 9.5% of registrations. This could well be related to
recent media reports of local NHS hospitals looking to Spain, Italy and Greece to meet staffing demands.
The proportions mask some large numbers of registrations from particular countries of origin; Table 9
details where registrations are above fifty in total, with the highest number for each country highlighted.
Spain and Poland still take the top spots overall, but within the constituencies, Spanish nationals’
registrations are high in Central and Gorton but barely register in Wythenshawe and Sale East. Similarly for
Poland, it is Blackley and Broughton attracting the highest number compared to a small number in
Withington. Registration from China is very focused on Central. There have been some significant changes
in registration numbers from certain countries, e.g. Pakistan national registrations have fallen from the
highest number in Gorton last period at 442 to 343 this period, now falling behind Spain’s 419 registering
nationals. Poland registrations remain highest in Blackley and Broughton, also favoured by Hungarian and
Czech nationals. Indian, Italian and French registrations continue to be highest in Manchester Central.
Table 9: Countries of origin with significant numbers of NINo registration to overseas nationals by constituency, year to 2014
Countries of origin
with >50 NINo Blackley and Manchester Manchester Manchester Wythenshawe
Ranked Total
registrations Broughton Central Gorton Withington and Sale East
2013/2014
Spain 151 495 419 248 53 1366
Poland 420 210 214 53 174 1071
Italy 158 204 199 101 24 686
Pakistan 158 88 343 48 13 650
India 52 211 109 29 176 577
Nigeria 132 162 97 7 18 416
China Peoples Rep 18 329 46 6 5 404
Hungary 218 51 46 40 32 387
Portugal 94 111 97 25 53 380
Romania 59 122 136 28 33 378
Czech Rep 114 92 83 16 35 340
France 48 140 78 66 7 339
Rep of Ireland 57 88 67 76 29 317
Greece 26 111 27 33 12 209
Germany 28 59 38 42 8 175
Rep of Lithuania 59 31 46 11 13 160
Bulgaria 15 61 33 18 15 142
Rep of Latvia 65 34 25 12 6 142
Slovak Rep 67 23 27 6 10 133
Netherlands 27 46 37 6 10 126
Malaysia 10 90 23 0 0 123
Australia 12 32 17 36 9 106
USA 8 44 19 26 7 104
Iran 38 28 18 8 10 102
Cyprus 6 66 6 6 5 89
Ghana 7 38 30 0 9 84
Syria 22 19 24 12 6 83
Bangladesh 0 13 56 9 0 78
Sweden 6 26 20 16 5 73
Belgium 24 18 13 0 0 55
Iraq 6 20 18 9 0 53*N.B. Blackley and Broughton, and Wythenshawe and Sale East constituencies include parts of Salford and Trafford respectively so
totals shown are higher than published city totals. Source: DWP
The highlighted numbers indicate that Manchester Central attracts the highest number of countries,
followed by Blackley and Broughton, which includes the ward of Cheetham, although more registrations are
seen in Gorton than in Blackley and Broughton.
Nigerian registrations are of note because the 2011 Census showed the largest communities of residents
from Nigeria were in Harpurhey (809 residents) which falls in Blackley and Broughton, followed by Gorton
North (619 residents) but it is Manchester Central where most of the registrations have been for both 2012-
2013 and 2013-2014. Bradford ward had the third highest population of Nigerian-born residents in the
Census (593) so this may indicate that this ward is becoming more popular as a place to settle. Nigerian
nationals’ registrations, alongside Italian, are higher in the ranking of top origin for 2013-2014 whereas
Pakistani, Indian and Chinese registrations are lower.
Comparisons with other areas
Just under half of the NINo registrations to foreign nationals in Greater Manchester were in Manchester, far
in excess of the other districts, as shown in Table 10. Salford’s proportion has gone up to 15.1% compared
to last year’s 13.9%. Trafford has traded places with Oldham in the ranking, as has Bury with Stockport.
Table 10: NINo registrations in Greater Manchester, 2013-2014
GM District Number of registrations % of GM total
Manchester 9767 49.9%
Salford 2958 15.1%
Bolton 1685 8.6%
Trafford 1070 5.5%
Oldham 927 4.7%
Rochdale 787 4.0%
Bury 666 3.4%
Stockport 574 2.9%
Tameside 566 2.9%
Wigan 566 2.9%
GM Total 19,566 100.0%
Source: National Insurance Recording System (NIRS)
Of the eight Core Cities, Manchester had the second highest number of registrations over the year, just a
thousand fewer registrations than seen in the much larger Birmingham, as shown in Figure 20. Spain and
Poland dominate the foreign national registrations in the Core Cities in 2013-2014 reflecting the overall
international immigration statistics for the period and continuing the trend from 2012-2013. However,
Romanian registrations have risen dramatically in Birmingham; Manchester has the second highest number
of Romanian registrations but at a considerably lower level than seen in Birmingham. Manchester is
attracting the highest number of Spanish and Italian nationals for this period, with Bristol second.
Whilst lower than usual, the number of Manchester registrations of Pakistani origin remains second to
Birmingham but much higher than the other core cities, whilst there has been an increase in the number of
registrations from Indian nationals on the previous period.
Migrant workers form a large part of Manchester’s international immigration and these findings point to
Manchester retaining its position as an attractive destination for international migrants coming to work.
24You can also read