Mangrove Species' Response to Sea-Level Rise Across Pohnpei, Federated States of Micronesia - Open-File Report 2021-1002
←
→
Page content transcription
If your browser does not render page correctly, please read the page content below
Prepared in cooperation with the U.S. Forest Service

Mangrove Species’ Response to Sea-Level Rise Across
Pohnpei, Federated States of Micronesia

Open-File Report 2021–1002

U.S. Department of the Interior
U.S. Geological Survey
Cover photo: Mangrove forest at Enipoas, Pohnpei. Photograph by Kevin Buffington, April 12, 2019.
Mangrove Species’ Response to Sea-Level
Rise Across Pohnpei, Federated States
of Micronesia

By Kevin J. Buffington, Rich A. MacKenzie, Joel A. Carr, Maybeleen Apwong,
Ken W. Krauss, and Karen M. Thorne

Prepared in cooperation with the U.S. Forest Service

Open-File Report 2021–1002

U.S. Department of the Interior
U.S. Geological Survey
U.S. Geological Survey, Reston, Virginia: 2021 For more information on the USGS—the Federal source for science about the Earth, its natural and living resources, natural hazards, and the environment—visit https://www.usgs.gov or call 1–888–ASK–USGS. For an overview of USGS information products, including maps, imagery, and publications, visit https://store.usgs.gov/. Any use of trade, firm, or product names is for descriptive purposes only and does not imply endorsement by the U.S. Government. Although this information product, for the most part, is in the public domain, it also may contain copyrighted materials as noted in the text. Permission to reproduce copyrighted items must be secured from the copyright owner. Suggested citation: Buffington, K.J., MacKenzie, R.A., Carr, J.A., Apwong, M., Krauss, K.W., and Thorne, K.M., 2021, Mangrove species’ response to sea-level rise across Pohnpei, Federated States of Micronesia: U.S. Geological Survey Open-File Report 2021–1002, 44 p., https://doi.org/10.3133/ofr20211002. Associated data for this publication: Irwin, J.R., Gesch, D.B., Buffington, K.J., and Danielson, J.J., 2021, Pohnpei, Federated States of Micronesia Mangrove Elevation Survey Data: U.S. Geological Survey data release, https://doi.org/10.5066/P9DDZX32. ISSN 2331-1258 (online)
iii

Acknowledgments
This work was funded by Department of Interior Office of Insular Affairs, U.S. Geological Survey
(USGS) Land Carbon program, and the USGS Pacific Island Climate Adaptation Science Center.
The project was conceptualized by C. Swensen at the U.S. Fish and Wildlife Service and Zhu
Zhiliang at the USGS. For help with field work, logistics, or general information, we would like
to thank Tamara Greenstone Alefaio (Micronesia Conservation Trust), Francisca Sohl, Angel
Jonathan, Bejay Obispo, Kirino Olpet (Conservation Society of Pohnpei), Eugene Eperiam, Emos
Eperiam, Bersin Elias, and Yosda Sailas (Pohnpei Department of Forestry). Additional contextual
and field data were provided by Joanna Ellison (University of Tasmania).

We also would like to thank our USGS colleagues Dean Gesch, Jeff Irwin, and Jeff Danielson
(Earth Resources Oobservation and Science) for lending their expertise to collecting elevation
data, and Zhu Zhiliang (Climate Adapation Science Center) and Elitsa Peneva-Reed (Eastern
Geographic Science Center) for their invaluable forest inventory dataset. Support was provided
by USGS Western Ecological Research Center and University of California, Davis, Center for
Aquatic Biology and Aquaculture.
v
Contents
Acknowledgments����������������������������������������������������������������������������������������������������������������������������������������iii
Abstract�����������������������������������������������������������������������������������������������������������������������������������������������������������1
Introduction����������������������������������������������������������������������������������������������������������������������������������������������������1
Methods����������������������������������������������������������������������������������������������������������������������������������������������������������3
Study Site�����������������������������������������������������������������������������������������������������������������������������������������������3
Model Description��������������������������������������������������������������������������������������������������������������������������������3
Community Composition Model�������������������������������������������������������������������������������������������������4
Soil Cohort Model������������������������������������������������������������������������������������������������������������������������6
Surface Deposition����������������������������������������������������������������������������������������������������������������������7
Belowground Processes������������������������������������������������������������������������������������������������������������7
Calibration Datasets�����������������������������������������������������������������������������������������������������������������������������7
Sea-Level Rise Scenarios�����������������������������������������������������������������������������������������������������������������13
Results�����������������������������������������������������������������������������������������������������������������������������������������������������������14
Discussion�����������������������������������������������������������������������������������������������������������������������������������������������������24
Modeling Assumptions and Information Needs����������������������������������������������������������������������������24
Conclusions��������������������������������������������������������������������������������������������������������������������������������������������������25
References Cited�����������������������������������������������������������������������������������������������������������������������������������������25
Appendix 1. Model equations for Mangrove Species’ Response to Sea-Level Rise,
Pohnpei, Federated States of Micronesia���������������������������������������������������������������������������������28
Appendix 2. Model Calibration of Mangrove Species’ Response to Sea-Level Rise,
Pohnpei, Federated States of Micronesia���������������������������������������������������������������������������������31
Figures
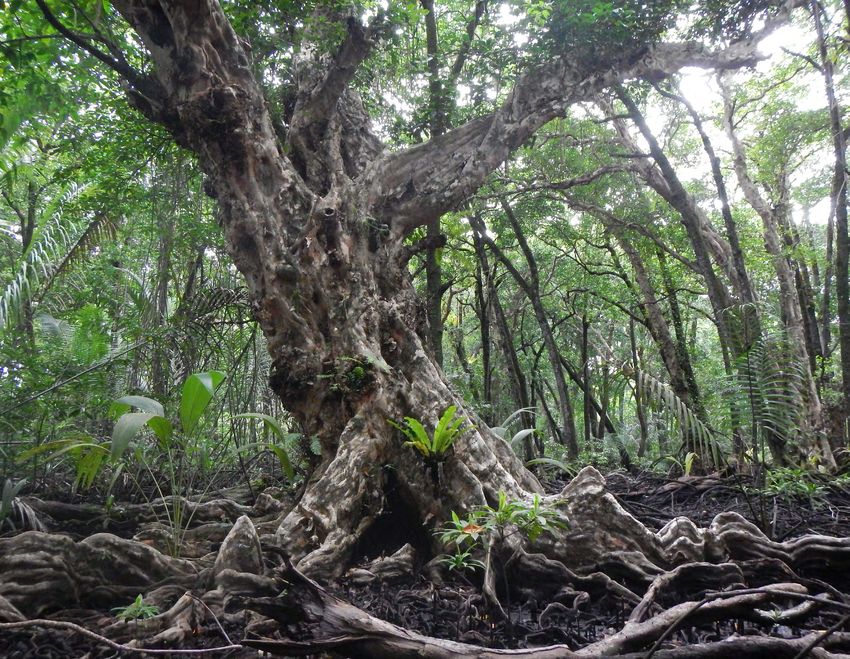
1. Photographs showing dominant mangrove species of Pohnpei, Federated
States of Micronesia��������������������������������������������������������������������������������������������������������������������3
2. Diagram showing approach to simulating surface-elevation relative
to sea-level rise around Pohnpei, Micronesia, by modeling above and
belowground organic and mineral pools and processes in mangrove forests������������������4
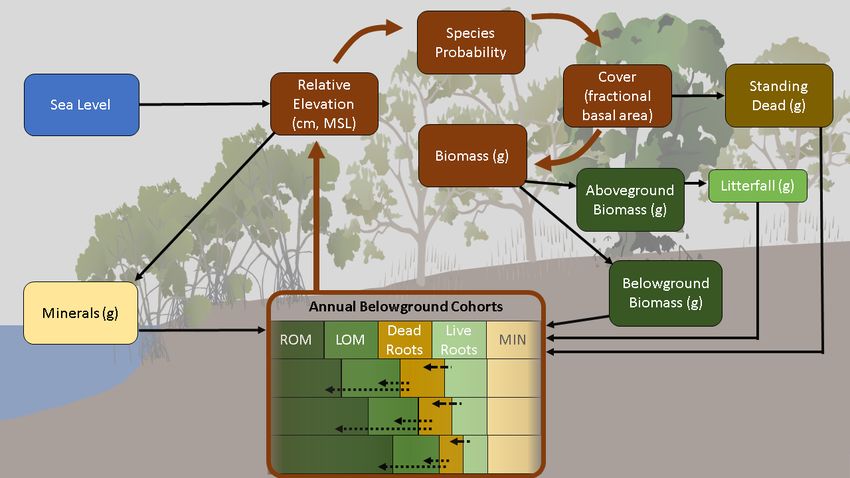
3. Diagram showing model approach for how fractional mangrove basal area is
apportioned to above and belowground living and dead biomass pools����������������������������6
4. Maps showing location and digital elevation model of study sites around
Pohnpei, Federated States of Micronesia, relative to large watersheds���������������������������8
5. Graph showing relationship between organic matter percentage and bulk
density from mangrove soil cores across Pohnpei, Federated States of Micronesia������9
6. Graph showing elevation probability distribution functions for five common
mangrove species on Pohnpei, Federated States of Micronesia��������������������������������������10
7. Graph showing elevation profile with distance from the seaward edge, derived
from elevation leveling datasets at northern and southern study sites Pohnpei,
Federated State of Micronesia�������������������������������������������������������������������������������������������������11
8. Graphs showing sea-level rise scenarios simulated for 2020–2100 used to
assess mangrove vulnerability on Pohnpei, Federated States of Micronesia�����������������13
9. Chart showing mean observed and modeled accretion rates during the 20-year
validation period for two sites with data from surface elevation tables, Pohnpei,
Federated States of Micronesia�����������������������������������������������������������������������������������������������15vi
10. Graphs showing mean elevation for the seven study sites on Pohnpei,
Federated States of Micronesia, under three sea-level rise scenarios from
2020 to 2100����������������������������������������������������������������������������������������������������������������������������������16
11. Graphs showing average mangrove area for each region on Pohnpei,
Federated States of Micronesia, under sea-level rise scenarios from 2020 to 2100������17
12. Graphs showing percentage of the Enipein, Palikir, Pwudoi, and West study
areas on Pohnpei, Federated States of Micronesia, covered by each mangrove
species projected to have more than15-percent cover under low, moderate,
high, and extreme sea-level rise scenarios from 2020 to 2100�������������������������������������������18
13. Graphs showing percentage of the Alohkapw, Enipoas, and Sapwalap study
areas on Pohnpei, Federated States of Micronesia, covered by each mangrove
species projected to have more than 15-percent cover under low, moderate,
high, and extreme sea-level rise scenarios from 2020 to 2100�������������������������������������������19
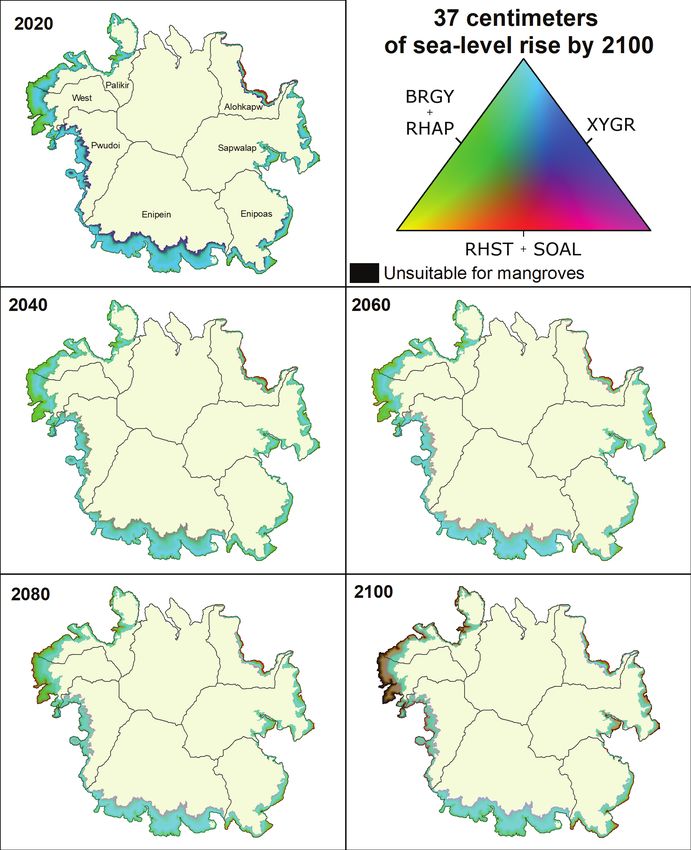
14. Images showing mangrove community composition across Pohnpei, Federated
States of Micronesia, under 2020 conditions and 37 cm of sea-level rise by 2100
in 20-year intervals���������������������������������������������������������������������������������������������������������������������20
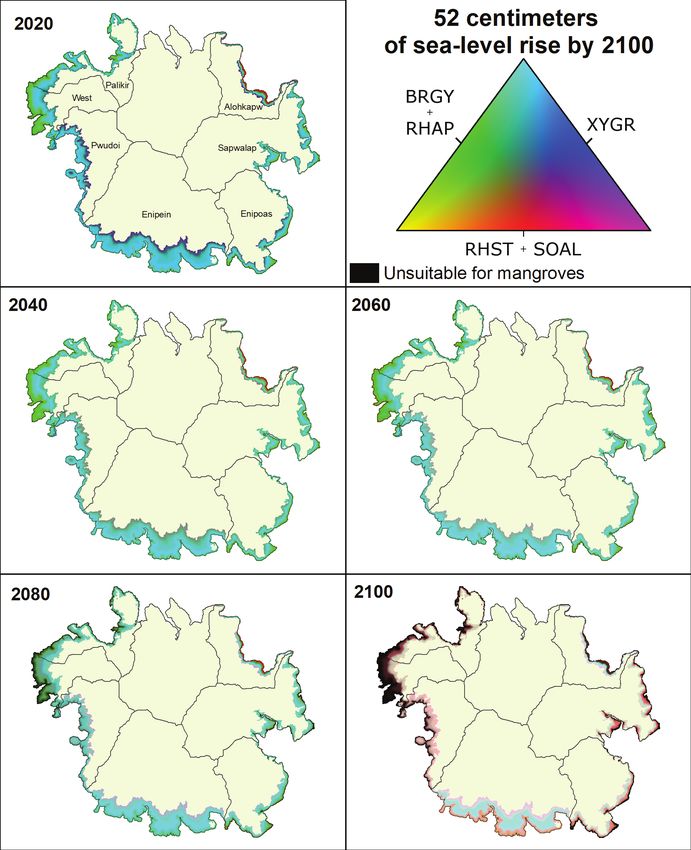
15. Images showing mangrove community composition across Pohnpei, Federated
States of Micronesia, under 2020 conditions and 52 cm of sea-level rise by 2100
in 20-year intervals���������������������������������������������������������������������������������������������������������������������21
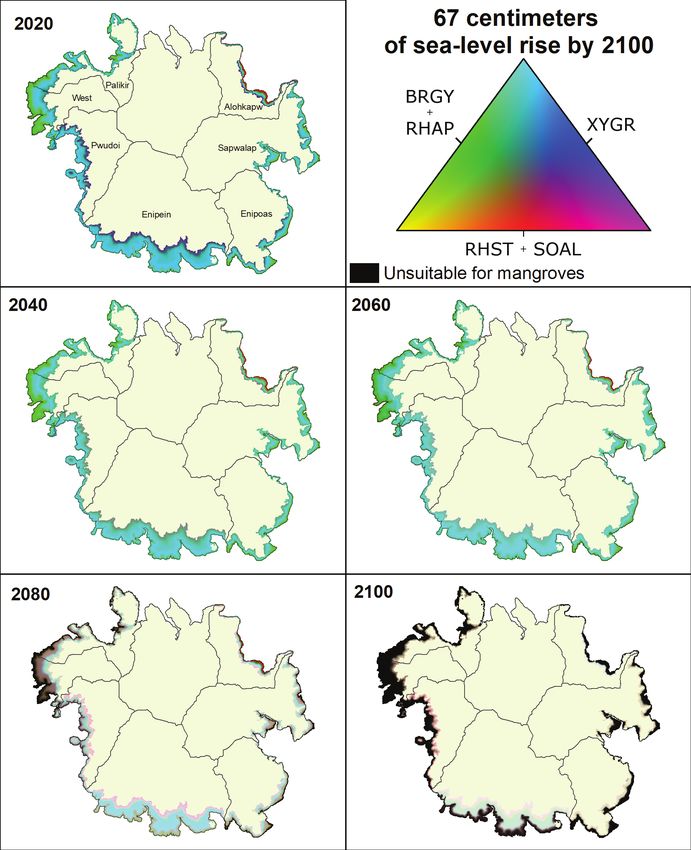
16. Images showing Mangrove community composition across Pohnpei, Federated
States of Micronesia, under 2020 conditions and 67 cm of sea-level rise by 2100
in 20-year intervals���������������������������������������������������������������������������������������������������������������������22
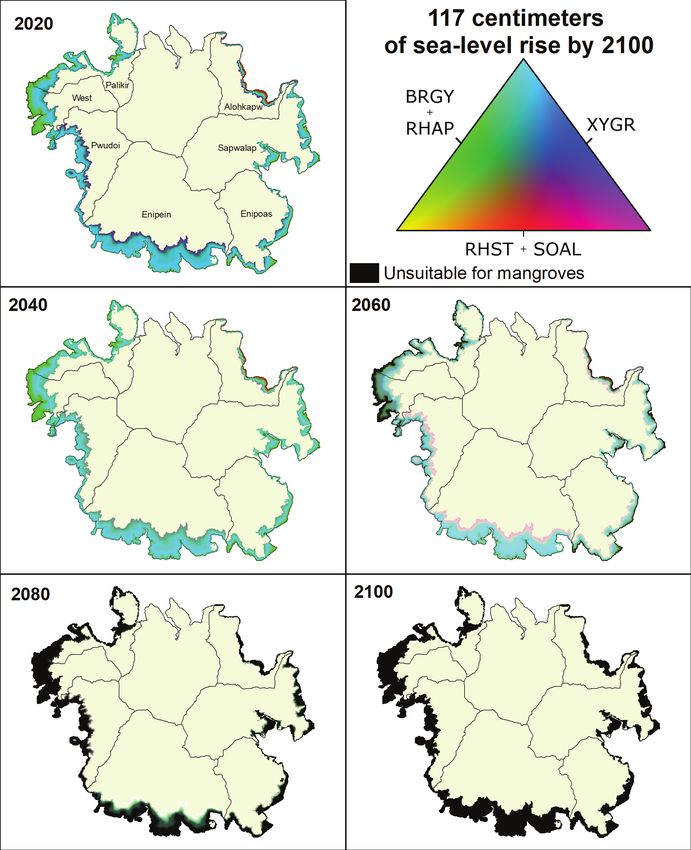
17. Images showing Mangrove community composition across Pohnpei, Federated
States of Micronesia, under 2020 conditions and 117 cm of sea-level rise by
2100 in 20-year intervals������������������������������������������������������������������������������������������������������������23
Tables
1. Mangrove species growth-rate parameters in the model from Devoe and
Cole (1998)��������������������������������������������������������������������������������������������������������������������������������������5
2. Fractional basal area to aboveground biomass linear regression coefficients
and shoot:root ratios for each mangrove species������������������������������������������������������������������5
3. Allometric equations estimating aboveground volume from tree diameter for
most common mangrove species on Pohnpei, from Cole and others (1999)����������������������5
4. Mean soil-core accretion rates, organic and mineral accumulation rates,
elevation, along with the regional mean sea-level estimate at study sites on
Pohnpei, Federated States of Micronesia��������������������������������������������������������������������������������9
5. Site elevation values for mangrove vulnerability to sea-level rise model for
Pohnpei, Federated States of Micronesia, and root mean squared error��������������������������9
6. Model parameters for the seven mangrove study sites, Pohnpei, Federated
States of Micronesia������������������������������������������������������������������������������������������������������������������12vii
Conversion Factors
International System of Units to U.S. customary units
Multiply By To obtain
Length
millimeter (mm) 0.03937 inch (in.)
centimeter (cm) 0.3937 inch (in.)
meter (m) 3.281 feet (ft)
meter (m) 1.094 yard (yd)
kilometer (km) 0.6214 mile (mi)
kilometer (km) 0.5400 mile, nautical (nmi)
Area
square meter (m2) 4,047 acre
square kilometer (km2) 247.1 acre
Volume
cubic meter (m3) 1.308 cubic yard (yd3)
Datum
Vertical coordinate information is referenced to the Earth Gravitational Model 2008 (EGM2008)
Horizontal coordinate information is referenced to the World Geodetic System of 1984 (WGS 84)
Abbreviations
DEM digital elevation model
ENSO El Niño-Southern Oscillation
FSM Federated States of Micronesia
GAM general additive model
MHW mean high water
MLW mean low water
MSL mean sea level
RCP representative concentration pathway
RMSE root mean squared error
SET surface elevation tableMangrove Species’ Response to Sea-Level Rise Across
Pohnpei, Federated States of Micronesia
By Kevin J. Buffington,1 Rich A. MacKenzie,2 Joel A. Carr,3 Maybeleen Apwong,2 Ken W. Krauss,4 and
Karen M. Thorne1
and loss of suitable mangrove habitat by 2100. Variation
Abstract in accretion rates, water levels, and initial forest elevation
led to differential vulnerability around the island, such that
Mangrove forests are likely vulnerable to accelerating mangroves on the leeward side of the island generally were
sea-level rise; however, we lack the tools necessary to the most at-risk to higher rates of sea-level rise. Our findings
understand their future resilience. On the Pacific island of indicate that the relatively undisturbed state of the mangrove
Pohnpei, Federated States of Micronesia, mangroves are forests and the surrounding landscape is an important factor in
habitat to endangered species and provide critical ecosystem their ability to keep pace with sea-level rise.
services that support local communities. We developed
a generalizable modeling framework for mangroves that
accounts for species interactions and the belowground
processes that dictate soil elevation. The modeling framework Introduction
was calibrated with extensive field datasets, including
accretion rates derived from thirty 1-meter-deep soil cores Mangrove forests live at the interface between terrestrial
dated with lead-210, more than 300 forest inventory plots, and marine environments and are likely to be threatened
water-level monitoring, and differential leveling elevation by increases in sea level associated with climate change. A
surveys. We applied the model using a community of study of mangrove extent over the last 10,000 years found
five mangrove species and across seven regions around long-term mangrove survival is unlikely beyond a sea-level
Pohnpei to identify which regions are most vulnerable to rise threshold rate of 6.1 millimeters per year (mm/year;
sea-level rise. The responses of mean elevation and the Saintilan and others, 2020). With projections of sea-level
mangrove community composition were analyzed under rise rates reaching more than 10 mm/year by 2100 (Church
four global sea-level rise scenarios: an increase of 37, 52, and others, 2013; Kopp and others, 2014), there is a need for
67, or 117 centimeters by 2100. The model was validated modeling tools that can provide information to land managers
against a 20-year surface elevation table record (1999–2019) and stakeholders about the resilience of mangrove resources
and showed good agreement when driven by observed under a range of sea-level rise scenarios.
water levels. Mangroves are recognized as critical ecosystems that
The model projected that mangroves around Pohnpei provide habitat to a wide diversity of species and provide
can build their elevations relative to moderate rates of valuable ecosystem services to human populations. Remote
sea-level rise to prevent submergence, with limited changes island communities, such as Pohnpei, Federated States of
in mangrove community composition through 2060. By 2100, Micronesia, are especially reliant on mangroves for food,
however, the model projected a decreasing abundance of fiber, and fuel (Naylor and others, 2002). These communities
high-elevation mangrove species and an increasing abundance also benefit from flood protection that mangroves provide
of lower elevation species adapted to more persistent flooding. during cyclones and tsunamis (Danielsen and others, 2005;
Under higher sea-level rise scenarios, forest elevation Dahdouh-Guebas and Jayatissa, 2009). Globally, mangroves
decreased substantially relative to mean sea level and there are an important component of climate change mitigation
were more drastic changes in the tree community composition because they remove and store more carbon from atmospheric
carbon dioxide (CO2) than any other tropical forested
1U.S. Geological Survey, Western Ecological Research Center ecosystem (Donato and others, 2011). By understanding
2U.S.
mangrove resilience to future sea-level rise, it is possible
Forest Service, Institute of Pacific Islands Forestry
to evaluate how mangrove functions could change during
3U.S. Geological Survey, Patuxent Wildlife Research Center this century.
4U.S. Geological Survey, Wetland and Aquatic Research Center2 Mangrove Species’ Response to Sea-Level Rise Across Pohnpei, Federated States of Micronesia
Interactions among biological, physical, and Our objectives were to develop a sea-level rise response
human-development factors determine how mangroves model for mangrove forests that explicitly considers forest
could respond to sea-level rise. For example, the growth dynamics and belowground processes. The model
suspended-sediment load in adjacent waters, freshwater developed was loosely based on existing models of tidal
influences on root growth, tidal range, the ability of ecosystems (REM, Rybczyk and others, 1998; NUMAN,
mangroves to migrate inland or horizontally, and the baseline Chen and Twilley, 1999; WARMER, Swanson and others,
condition of the mangrove forest all affect vulnerability 2014) and integrates key elements that influence soil
to sea-level rise (Krauss and others, 2014; Lovelock and elevation (for example, community composition, inundation
others, 2015; MacKenzie and others, 2016). Mangroves can frequency, organic sediment composition, mineral sediment
maintain the elevation of the forest floor relative to sea level composition, root growth, and tidal range) to determine the
through accretion processes that involve root growth, mineral likely effects on mangrove extent and distribution given
sedimentation, soil compaction, and peat development (Krauss differing sea-level rise scenarios. Other objectives were to
and others, 2014). Mangroves are also capable of migrating calibrate the mangrove sea-level rise model for Pohnpei,
upslope to maintain their elevations relative to ocean levels. Federated States of Micronesia using extensive field datasets
Hydrologic alterations due to roads and bridges can alter and to project changes in elevation and mangrove community
sediment processes that are crucial for accretion, however, composition under a range of sea-level rise scenarios to 2100
in addition to physically blocking the upland migration for seven drainage basins across Pohnpei. By including data
of mangrove forests as sea-level rise increases flooding. for five of the most common Pacific island mangrove species
A model for mangrove resilience must account for these in the model (Bruguiera gymnorrhiza, Rhizophora apiculata,
interacting processes. Rhizophora stylosa, Sonneratia alba, and Xylocarpus
Although the literature is full of models for tidal marshes granatum; fig. 1), we were also able to assess vulnerability
that project biogeomorphic changes with sea-level rise (Morris at the species level for each basin and island-wide as well as
and others, 2002; Craft and others, 2009; Fagherazzi and understand likely responses for species not directly modeled.
others, 2012; Swanson and others, 2014; Langston and others, Datasets used in the model developed to assess mangrove
2020), there are not equivalent models available for mangrove resilience to sea-level rise included data collected from soil
ecosystems. Mangrove models have generally focused on cores, forest-inventory plots, SETs, and water-level gages
the dynamics of forest growth (Chen and Twilley, 1998, around Pohnpei. Model calibration used a 400-year spin up
FORMAN; Berger and Hildenbrandt, 2000, KiWi; Jiang and period to establish conditions, followed by a 20-year period
others, 2012), physiology (for example, Asaeda and Kalibbala, comparing model performance to observed data (1999–2019),
2009), or coastline evolution (for example, van Maanen and finally an 80-year simulation period comparing four
and others, 2015). To our knowledge, there has not been rates of sea-level rise to the end of the century. The effects
an attempt to consider the influence of sea-level rise on the of sea-level rise on mangrove species distribution and
interaction of above- and belowground processes that affect resilience were assessed, and model limitations and needed
mangrove resilience. data discussed.Methods 3
Figure 1. Dominant mangrove species of Pohnpei, Federated States of Micronesia.
Methods in post El Niño years (Lander and Khosrowpanah, 2004).
ENSO is also a strong driver of sea-level variation, and
changes of ±30 centimeters (cm) are possible (Lander and
Study Site Khosrowpanah, 2004).
The Federated States of Micronesia (FSM) comprises
four island states approximately 4,000 kilometers (km) Model Description
southwest of Hawaii, just north of the equator. Pohnpei is
the largest island state in the FSM at 346 square kilometers We developed a new process-based soil cohort
(km2) and is home to about 35,000 people. The rugged model for understanding the vulnerability of mangroves
topography rises steeply from the coast to the nearly to environmental change, especially sea-level rise (fig. 2).
800-meter (m) summit of a dormant volcano. Pohnpei The model simulates changes in land-surface elevation in
is ringed by coral reefs and 57 km2 of mangroves in response to potential increases in sea level by estimating
the coastal lowlands. The extensive mangroves provide sediment accretion from inorganic inputs and biomass
habitat to several endangered species such as the Pohnpei inputs from common mangrove species growing around
lorikeet (Trichoglossus rubiginosus) and fruit bats Pohnpei (appendix 1, eq. 1). Mangrove biomass is estimated
(Pteropus molossinus). Mangroves are important for human by fractional basal area, from which aboveground and
communities throughout the FSM; the fish, crabs, and belowground inputs are estimated using allometric relations
firewood harvested from mangroves provide the equivalent of and shoot:root ratios for each species, with additional
more than half of the annual household income (Naylor and belowground dynamics estimated from soil cores. Estimates of
others, 2002). mass and density for each pool were used to calculate cohort
Pohnpei is characterized by a tropical rainforest climate. volumetric contributions to depth by summation, and the total
One of the wettest places on Earth, Pohnpei receives an normalized by area to estimate land-surface elevation relative
average of 4,800 mm of rainfall each year and has no dry to mean sea level. The model uses estimates of elevation
season (Lander and Khosrowpanah, 2004). The El Niño– change relative to sea level to project changes in mangrove
Southern Oscillation (ENSO) is responsible for the majority species’ distribution around Pohnpei based on the optimal
of the interannual variation in rainfall, with drier conditions elevation ranges of various mangrove species.4 Mangrove Species’ Response to Sea-Level Rise Across Pohnpei, Federated States of Micronesia
Figure 2. Approach to simulating surface-elevation relative to sea-level rise around Pohnpei, Micronesia, by modeling above and
belowground organic and mineral pools and processes in mangrove forests.
The probability of species presence was determined where material accumulated (transfer rates of 1, 2, 10, and
from elevation relative to mean sea level (fig. 2). Fractional 20 years/cohort, 20 cohorts in each). Using a constant number
basal area for each species is held in living and standing dead of cohorts was important for computational efficiency during
pools. A negative change in fractional basal area, which results multi-century model runs, where old, deep material changes
when surface elevation moves outside the optimal elevation very slowly.
range for a given species, adds fractional basal area to the
standing dead pool. Both living and standing dead cover are
converted to aboveground biomass using species-specific Community Composition Model
allometric equations. Standing dead biomass falls at a constant A change in fractional basal area by species was modeled
rate and is moved to the fallen dead pool where it undergoes as a function of elevation and carrying capacity, in terms
decomposition. Litterfall and root turnover contribute to the of fractional basal area (appendix 1, eq. 2). The probability
labile (LOM) and refractory (ROM) soil organic pools, which distribution function for elevation by species was defined
are subject to loss by decomposition at differential rates. by field surveys and a rectangular kernel density (‘density’
Rates of organic matter decomposition are tied to inundation function in R); the bandwidth of each species kernel was
period and slow with increasing depth in the soil column. Root increased until the probability was smooth across the elevation
density distribution by depth is determined by an exponential gradient. Resultant areal density values for each species
decay function, whereas mineral sediments are deposited in were normalized to range between 0 and 1 and describe the
the surface cohort. optimal elevation distribution for each species. A seeding
Each cohort represents both the age and depth of the soil rate (α) was set as a constant for each species (1 percent of
and contains the organic and inorganic soil and root pools. carrying capacity); use of this constant assumed that each
A total of 80 age-depth cohorts were used in this model, species could establish at any time step, provided favorable
transferring material to deeper cohorts at differential rates (for elevation and space. All cover lost at the beginning of the
example, Rybczyk and others, 1998). The variable transfer time step is transferred to the standing dead pool (appendix 1,
rates were set such that there was higher temporal resolution in eqs. 3 and 4).
the upper soil layers and lower resolution in the deeper layers,Methods 5
We used a logistic growth function to calculate the (table 2). Over 300 forest inventory plots were used to
absolute growth rate needed to obtain 99-percent carrying develop the species-specific functional relationships between
capacity (in terms of basal area) in 60 years. To calculate plot-level basal area and aboveground biomass (Peneva-Reed
relative growth rates, growth rates for each species (Devoe and and Zhu, 2019). Aboveground biomass for individual trees
Cole, 1998) were converted to fractional change in basal area was calculated from species-specific allometric equations. A
by dividing by the reported mean diameter at breast height, more accurate two parameter allometric equation was used
averaged across species, and then differenced from the mean for those individuals that included a height measurement
across species. The absolute rate was then scaled by relative (table 3). Total basal area for each species was summed and
growth rates for each species (table 1; appendix 1, eq. 5). divided by plot area to calculate fractional basal area. Across
Relative species abundance in the model changes in each plot, aboveground biomass was summed by species,
terms of fractional basal area, which was then converted log-transformed, and modeled as a function of log-transformed
to aboveground biomass using species-specific equations fractional basal area using multiple linear regression (table 3).
Table 1. Mangrove species growth-rate parameters in the model from Devoe and Cole (1998).
[Growth rate was calculated such that carrying capacity was at 99 percent after 60 years.]
Mean diameter Relative
Growth rate
Species at breast height growth rate
(centimeters/year)
(centimeters) (centimeters/year)
Bruguiera gymnorrhiza 0.0854 25 0.35
Rhizophora apiculata 0.0988 16.6 0.25
Rhizophora stylosa1 0.493 11 0.37
Sonneratia alba 0.0441 48.7 0.49
Xylocarpus granatum 0.0574 27 0.31
1Data from Rhizophora mucronate.
Table 2. Fractional basal area to aboveground biomass linear
regression coefficients and shoot:root ratios (Komiyama and
others, 2008) for each mangrove species on Pohnpei, Federated
States of Micronesia.
[Equation has the form: log(Biomass) = a (log(fractional basal area)) ]
b
Species a b R2 Shoot:Root
Bruguiera gymnorrhiza 4.44 1.11 0.74 2.91
Rhizophora apiculata 4.81 1.11 0.81 1.90
Rhizophora stylosa 6.21 1.11 0.78 1.90
Sonneratia alba 6.71 1.11 0.79 4.26
Xylocarpus granatum 8.09 1.11 0.95 3.00
Table 3. Allometric equations estimating aboveground volume from tree diameter for most common
mangrove species on Pohnpei, Federated States of Micronesia, from Cole and others (1999).
Aboveground volume
Aboveground volume
Wood with height
Species (cubic meter)
density (cubic meter)
a b a1 b1
Bruguiera gymnorrhiza 0.66 4.83E-05 2.589 2.64E-05 0.992
Rhizophora apiculata 0.885 5.79E-05 2.692 2.81E-05 1.007
Rhizophora stylosa 0.84 5.79E-05 2.692 2.81E-05 1.007
Sonneratia alba 0.63 1.28E-04 2.359 4.49E-05 0.949
Xylocarpus granatum 0.577 1.87E-04 2.249 7.13E-05 0.9116 Mangrove Species’ Response to Sea-Level Rise Across Pohnpei, Federated States of Micronesia
To calculate belowground biomass, we used species-specific belowground, (3) dead aboveground, and (4) dead
shoot:root ratios (Komiyama and others, 2008 and references belowground (fig. 3). Species-specific allometric equations
therein); no value was available for X. granatum, so we (table 2) were used to convert the living fractional cover to the
assumed a moderate value of 3.0. living aboveground biomass pool; a species-specific root-shoot
ratio was used to estimate total belowground biomass. The
fractional basal area for standing dead was converted to dead
Soil Cohort Model belowground litter, whereas the basal area for fallen dead
Species biomass (grams) was calculated from the was subject to export from the system proportional to time
living and dead fractional basal area at each timestep and inundated, and the remainder was placed in the surface cohort
divided into four pools: (1) living aboveground, (2) living of the wood litter pool (fig. 3).
Figure 3. Model approach for how fractional mangrove basal area is apportioned to above and belowground living and dead biomass
pools.Methods 7
Surface Deposition subsequently decomposes into particulate labile and refractory
organic matter at different rates and as a function of annual
Leaf and wood litter (grams) is separated into the percent inundation time, such that decomposition is slower
surface pools of labile (Ol) and refractory (Or) organic matter deeper in the soil column as inundation increases. We assumed
(appendix 1, eqs. 6 and 7). Leaf and wood litter comes from refractory decomposition is 100 times slower than labile
the aboveground living and fallen dead pools, such that decomposition. The fraction of labile material in roots was
wood (for example, branches) is assumed to fall at half of the informed by a previous mangrove modeling study (Chen and
leaf rate, and the export rate is assumed to be proportional Twilley, 1999). Dead roots that are created when a tree dies
to the percentage of annual inundation time (appendix 1, were treated separately from the dead roots generated from
eqs 8 and 9). turnover in order to avoid unrealistic elevation gains from
Mineral sediments are deposited as a function of annual the rapid infusion of low-density organic material into the
inundation duration. Tidal harmonics were derived from a soil. Roots from standing and fallen dead trees were split into
long-term water-level gage (Pohnpei Harbor; Caldwell and labile and refractory pools that lose mass at a pool-specific
others, 2015; http://uhslc.soest.hawaii.edu/data/) and used to logarithmic decay rate and track the years since tree death
define the functional relationship between inundation duration (appendix 1, eqs. 16–18).
and elevation relative to mean sea level for one year. The Bulk density of each cohort is calculated by fitting a
amplitude of the functional relationship was calibrated to the modified version of a mixing model (Morris and others,
mineral accumulation rate deduced from soil cores. 2016) to the soil-core interval data. We added a term for the
mass of mineral and organics sediments overlying the cohort
to account for the consolidation of sediments through time
Belowground Processes (appendix 1, eq. 19). Percent organic matter of the soil cohort
Belowground biomass (roots) were split into three was used with the mineral content to calculate bulk density,
size classes based on Cormier and others, 2015: structural which in combination with the volume of living and dead
(diameter more than 20 millimeters), large (2–20 millimeters), roots, was used to calculate total cohort volume (appendix 1,
and fine (less than 2 millimeters). Structural-root volume eq. 20) and depth of the soil core (appendix 1, eq. 21).
was calculated using species-specific wood density (table 1), Consolidation of sediments proceeds both as a function of
whereas large and fine roots were assumed to have a density the mass of the overlying cohorts and as an increase in bulk
of 0.2 grams per cubic centimeter (g/cm3; Kramer-Walter density from the decomposition of organic matter.
and others, 2016). Total living and dead roots mass (g) for all
species was passed to the soil cohort module for calculation
of total cohort volume and distributed across lower cohorts
Calibration Datasets
according to an exponential decay function (appendix 1, We selected seven representative sites on Pohnpei,
eq. 10). For structural roots, the decay coefficient r2 was Federated States of Micronesia, for modeling based on the
multiplied by 1.5 to better represent the pneumatophore availability of long-term accretion data derived from lead–210
root structures near the surface. The rates of organic matter dating (R. MacKenzie, U.S. Forest Service, written commun.,
decomposition (g/year) from the labile (LossL) and refractory August 15, 2018; fig. 4), which is used for dating materials
(LossR) pools of each cohort were expressed as a function of up to about a century old (Appleby and Oldfield, 1978).
percent time inundated and a decay constant for each type of Thirty 1-m long cores were used to calibrate the model.
organic matter (appendix 1, eqs. 11 and 12). Each core was sectioned into 2-cm intervals and analyzed
Root turnover, the process of living roots dying, was for dry bulk density and organic matter percent through
modeled as a two-step process. First, root turnover biomass loss-on-ignition. Average accretion, mineral accumulation
was calculated as a fraction of living root biomass and rate, and organic accumulation rates for each site were used
distributed into dead root litter pools according to size class to calibrate the model, assuming a 75-year horizon (table 4).
(fig. 3; appendix 1, eqs. 13–15). Each root size class had The soil-core data were also used to calculate the parameters
unique turnover rates informed by previous studies (large in the mixing model (eq. 21) for estimating bulk density
and fine roots; Cormier and others, 2015) and calibration (k1 = 0.145, k2 = 0.908, k3 = –0.029; root mean squared error,
(structural roots). The dead root litter that accumulated from RMSE = 0.072; fig. 5); we assumed a maximum bulk density
the turnover process had the same density as living roots; limit of 1.2 g/cm3. We used an analysis of variance to test for
this assumed that newly dead roots maintained their structure site and hydrologic zone differences in soil-core elevation,
and volume for one year before beginning to decompose into accretion rate, and the organic and mineral accumulation rates.
particulate organic matter. Biomass in the dead root litter pool8 Mangrove Species’ Response to Sea-Level Rise Across Pohnpei, Federated States of Micronesia
Figure 4. Location and digital elevation model of study sites around Pohnpei, Federated States of Micronesia, relative to
large watersheds.
Water-level records from the long-term gage at the surface and recorded data in 12-minute intervals, from which
airport on Pohnpei were used to calculate mean sea level the frequency and duration of high tides that inundated the
(MSL), mean high water (MHW) and mean low water mangrove forest (from July 7, 2016, to March 13, 2017) were
(MLW) for 1983–2001, the most recent National Oceanic determined. The data from the loggers and the airport gage
and Atomspheric Administration (NOAA) epoch. Pressure were aligned, and MSL was estimated for each logger site by
transducer water-level dataloggers (Solinst® Edge Jr.) the MHW difference (appendix 1, eq. 22). For sites without
were also deployed at three study sites (Enipoas, Enipein, water-level data, the MSL was assigned according to the
Sapwalap), but only the loggers at Sapwalap and Enipein nearest site with data (table 5).
were recovered. The loggers were deployed just above the soilMethods 9
Table 4. Mean (standard error) soil-core accretion rates, organic and mineral accumulation rates, elevation,
along with the regional mean sea-level estimate for study sites on Pohnpei, Federated States of Micronesia.
Accretion Organic Mineral Elevation Mean sea level
Soil
Site (centimeters/ accumulation accumulation (meters, (meters,
cores
year) (grams/meter2/year) (grams/meter2/year) EGM2008 geoid) EGM2008)
Alohkapw 3 0.385 (0.080) 437.87 (74.0) 1,122.7 (466.7) 1.249 (0.0298)a 1.023
Enipein 2 0.293 (0.099) 366.6 (99.1) 331.9 (68.7) 0.843 (0.066)ab 0.816
Enipoas 8 0.277 (0.034) 347.6 (38.4) 144.0 (19.1) 1.038 (0.029)ab 0.905
Palikir 3 0.454 (0.014) 474.7 (50.9) 233.5 (21.3) 0.935 (0.006)ab 0.905
Pwudoi 3 0.221 (0.066) 345.1 (97.9) 122.3 (34.4) 0.859 (0.078)b 0.816
Sapwalap 9 0.390 (0.118) 5,497.9 (181.0) 544.3 (163.6) 1.175 (0.071)ab 0.905
West 2 0.152 (0.027) 271.5 (91.5) 70.6 (5.5) 1.075 (0.017)* 0.905
*Elevation estimated from digital elevation model at West; this was not included in the statistical analysis. Letters denote
significant difference at alpha=0.05.
Table 5. Site elevation values for mangrove
vulnerability to sea-level rise model for
Pohnpei, Federated States of Micronesia,
and root mean squared error (RMSE).
Distance from seaward
Site edge of mangrove forest RMSE
(meters)
Alohkapw 859 0.275
Enipein 600 0.258
Enipoas 635 0.079
Palikir 600 0.375
Pwudoi 600 0.309
Sapwalap 600 0.277
Figure 5. Relationship between organic matter percentage and bulk
density from mangrove soil cores across Pohnpei, Federated States of
Micronesia (from R. MacKenzie, U.S. Forest Service, written commun.,
August 15, 2018).10 Mangrove Species’ Response to Sea-Level Rise Across Pohnpei, Federated States of Micronesia
Elevation surveys were completed in February 2017 and the shore and upland edge of the mangrove forest with high
April 2019 (Irwin and others, 2021). Temporary benchmarks resolution (0.3 m) WorldView 2 satellite image, and Euclidean
were established outside the mangrove forest using a Trimble distances from each edge were calculated as rasters. An
global navigation satellite system base station. We then elevation-profile transect was generated using a subset of data
used differential leveling to establish the elevation from from Enipoas, Enipein, Palikir, and Pwudoi (fig. 4). Elevation
the benchmark with the surface elevation table (SET) and profiles of the transect were generated using a general
soil-core locations at each study site. At each turning point additive model (GAM) spline and the relationship between
along the leveling transect, the presence of each mangrove elevation and distance from the seaward edge (fig. 7). We
species within a 10-meter (m) radius was recorded. We used the relative width of the mangrove forest to extrapolate
used the species-elevation data from 152 plots to derive the elevation profile GAM model across the study site
probability distribution functions for each species, which in (appendix 1, eq. 23).
turn control the growth rate in the population model (fig. 6). For each site, we used an optimizing function to
We used the soil-core elevation to calibrate a site-specific determine the maximum width, Wm, value that resulted in
mineral-accumulation function. a DEM with the lowest RMSE when compared with the
Digital elevation models (DEMs) were created for elevation points for that site, constraining Wm between 600
each site using transects of differential leveling data and the and 950 m. Model accuracy varied by site (table 5); the
elevation profile from seaward to upland edge. We digitized average RMSE for all the sites was 0.26 m.
Figure 6. Elevation probability distribution functions for five common mangrove species on Pohnpei, Federated States
of Micronesia.Methods 11
Figure 7. Land-surface elevation profile with distance, in meters (m), from the seaward edge
of the mangrove forest, derived from elevation leveling datasets, February 2019, at northern and
southern study sites, Pohnpei, Federated State of Micronesia.
We used a multi-step calibration scheme to estimate large root mass pools were less than the value provided in
several important parameters while preserving site Cormier and others (2015); we assumed structural roots were
differences (table 6). We allowed three parameters to change not incorporated in the soil cores of that study. The parameters
for site-specific model calibrations. First, the mineral that control root collapse (lh, rh,dr, dl) were constrained by
accumulation rate was calibrated to the data from the soil limiting the elevation loss of a dead forest to a maximum of
cores. Second, carrying capacity, here defined as fractional 10 mm/year, the rate of soil collapse observed in a harvest
basal area, was calculated as the 95th percentile from field mangrove stand (Krauss and others, 2010). The model only
surveys in each region. The litter deposition rate was set to considers elevation and does not directly consider the potential
2 percent of aboveground biomass, a value that produced effects of salinity or macronutrients on organic deposition
approximately 8,800 kilograms per hectare (kg/ha (R. Hauff, or decomposition; we assumed that site-specific values of
unpublished data, in Gleason and Ewel, 2002). Finally, we carrying capacity (table 6) and the organic accumulation rate
calibrated the labile decomposition coefficient for inundation reflect these factors. A 400-year model spin-up period, using
(kl) to minimize the difference in modeled and observed sea-level rise rates equal to the mean soil-core accretion
elevation after 100 years in a model simulation that used rates and three initial land-surface elevations (5, 15, 35 cm
the historic sea-level rise rate (3.75 mm/year) and initial relative to MSL), was used to assess model accuracy
elevations estimated from soil-core accretion rates. Modeled by comparing modeled and observed vertical accretion,
values of all roots, living roots (fine and large), and ratio of mineral accumulation, and organic matter accumulation
dead:live roots were compared with values from Cormier rates (appendix 2). By using the mean accretion rates to
and others (2015); for all sites, these values were within the calibrate the model, we are assuming that these historic
range of literature values (appendix 2). The proportion of (75 year) accretion rates represent a forest in steady state with
structural roots was calibrated such that the living fine and its environment.12 Mangrove Species’ Response to Sea-Level Rise Across Pohnpei, Federated States of Micronesia
Table 6. Model parameters for the seven mangrove study sites, Pohnpei, Federated States of Micronesia.
[Parameters with no values were held constant across sites. Abbreviations: —, not applicable; cm, centimeters]
Parameter Symbol Alohkapw Enipein Enipoas Palikir Pwudoi Sapwalap West Source
Calibration, Cormier and
Structural root fraction y1 0.90 — — — — — —
others, 2015
Fine root fraction y2 0.27 — — — — — — Cormier and others, 2015
Carrying capacity Peneva-Reed and Zhu, 2019;
k 0.008 0.011 0.0092 0.0073 0.0065 0.011 0.0061
(fractional basal area) 95th percentile
Reseeding rate α 0.01 — — — — — — Constant, this study
Calibrated to 80 cm depth,
Root growth coefficient r2 0.1 — — — — — —
Ono and others, 2015
Fine root turnover kr 0.1 — — — — — — Constant, this study
Large root turnover km 0.08 — — — — — — Cormier and others, 2015
Calibration, informed by
Structural root turnover kt 0.015 — — — — — —
Cormier and others, 2015
Fine root labile fraction fc1 0.75 — — — — — — Chen and Twilley, 1999
Large root labile
fc2 0.80 — — — — — — Chen and Twilley, 1999
fraction
Leaf refractory fraction lr 0.15 — — — — — — Chen and Twilley, 1999
Constant. Informed by R.
Litter deposition
ld 0.02 — — — — — — Hauff unpubl. data, in
fraction
Gleason and Ewel, 2002
Labile decomposition
coefficient for kl 11.46 6.93 7.60 8.19 7.78 5.75 9.08 Core calibration
inundation
Labile maximum loss
klx 0.90 — — — — — — Constant, this study
rate per year
Refractory
decomposition
krc 100 — — — — — — Constant, this study
coefficient for
maximum loss rate
Dead fall rate df 0.10 — — — — — — Constant, this study
Half-life of labile roots lh 10 — — — — — — Constant, this study
Half-life of refractory
rh 25 — — — — — — Constant, this study
roots
Loss rate of root mass dl, dr 0.5 — — — — — — Constant, this study
At Sapwalap and Enipoas, we used a long-term to calculate the annual change in sea level that was used to
(1999–2019) SET record to independently validate the drive the model. We then compared the average modeled and
model. At each site, there are three replicate SETs deployed observed accretion rates for the 20-year period (1999–2019).
in fringe, riverine, and interior hydrologic zones. Using the To generate spatial results, we used the model to simulate
differential elevation data, the absolute elevation of each pin a range of initial elevations and interpolated the results of
measurement was calculated relative to the Earth Gravitational fractional species cover across the 10-m resolution DEM in
Model of 2008 (EGM2008) datum, and the elevation in 10-year intervals. Again, we used a 400-year model spin-up to
1999 was determined. We used a 400-year model spin-up develop the forest and soil profile, holding the initial elevation
period to establish the mean initial soil profile and mangrove constant and the rate of sea-level rise to zero. The sea-level
community at the mean elevation of each group of SETs. We rise scenarios were simulated after the spin-up period.
used mean annual water level from the Pohnpei Harbor gageMethods 13
Sea-Level Rise Scenarios greater capacity to build soil-surface elevations vertically
(Kirwan and others, 2010), and also, they often have more
We used four future sea-level rise scenarios to assess the time before undergoing submergence due to sea-level rise,
relative vulnerability of mangrove forests around Pohnpei. especially if positioned at a distance inland (Lovelock and
Relative to 2020, the representative concentration pathway others, 2015). The El Niño–Southern Oscillation (ENSO)
(RCP) scenarios 4.5 and 8.5 from the IPCC project 37 and exerts control over interannual variation in sea level across
67 cm of sea-level rise, respectively, by 2100 (Church and the equatorial Pacific, such that El Niño periods lower sea
others, 2013; fig. 8). To illustrate model sensitivity, we levels around Pohnpei and La Niña events drive water levels
included a moderate scenario of 52 cm by 2100. The AR5 higher. We fit a second-order polynomial to the 45-year
IPCC report did not consider potential instability of Antarctic record of mean sea level from Pohnpei to deduce the local
ice sheets, so we also included a more extreme scenario by trend in sea-level rise. We then fit a Weibull distribution to
adding 50 cm to the RCP 8.5 scenario, resulting in a 117 cm the residuals from the regression, which represent the recent
sea-level increase by 2100 (fig. 7). In addition to sea-level rise, historic influence of ENSO, storms, and long-period lunar
we included a constant 0.074 mm/year rate of subsidence, as nodal harmonics. We ran 100 Monte Carlo simulations for
estimated from deep soil-core data by J. Ellison (University of each sea-level rise scenario and calculated the annual average
Tasmania, written commun., July 10, 2019). elevation and species cover area for those at greater than
Wetlands developing under larger tidal ranges tend to 15-percent cover.
demonstrate increased resilience to sea-level rise through a
Figure 8. Sea-level rise scenarios simulated for 2020–2100 used to assess mangrove vulnerability on Pohnpei,
Federated States of Micronesia.14 Mangrove Species’ Response to Sea-Level Rise Across Pohnpei, Federated States of Micronesia
Results scenario (fig. 11). The West region was especially vulnerable
because of its low mineral and organic accumulation rates
Within sites there was a large amount of variation in the (table 4); however, the lack of any elevation data for the DEM
vertical accretion and accumulation rates; as a result, elevation or the soil cores in that region increased the projected model
was the only factor that was significantly different among sites uncertainty. Sapwalap and Alohkapw had the highest mineral
(F5,24=3.79, p=0.011), with Alohkapw higher than Enipein accumulation rates from the soil cores (table 4), which resulted
(p=0.037) and Pwudoi (p=0.048). There were no significant in the model showing greater resilience to sea-level rise.
differences in any of the factors we tested across hydrologic Enipein also showed resilience, maintaining mangrove cover
zones (fringe, interior, riverine). through 2100 under the 67 cm sea-level rise scenario. Under
Independent model validation at Sapwalap and Enipoas the extreme, 117 cm sea-level rise scenario, area suitable for
showed good agreement between SET measurements mangrove was projected to be lost by 2100 across all sites
and model projections (fig. 9). Across Sapwalap fringe, (figs. 11–13).
interior, and riverine SETs, accretion rates averaged The trends in changes of community composition were
2.28 mm/year (range: 0.06–4.66 mm/year). Using the average similar across sites; higher rates of sea-level rise stimulated
initial elevation from each group of SETs, the model projected more rapid increases in the cover of flood-tolerant species
an average accretion rate of 2.15 mm/year for the 20-year (figs. 12, 13). High proportions of B. gymnorrhiza and
simulation (1999–2019), a difference of 5.7 percent from R. apiculata were projected initially at all sites, which aligns
measured values. The average SET accretion rate at Enipoas with field-survey data of these broadly distributed species.
was 1.56 mm/year (range: 0.55–2.71 mm/year), and the Xylocarpus granatum grows in the upper end of the tidal zone
model projected an average accretion rate of 1.94 mm/year, a and initially was the third most common species in several
difference of 19.7 percent from the measured rate. regions; however, the model projected it to decrease in cover
During the next 80 years (2020–2100), the model in all scenarios. Sonneratia alba and R. stylosa are the most
projected average elevation relative to MSL decreased at all flood-tolerant species; R. stylosa is generally restricted to the
sites (fig. 10); however, mangrove community composition coastal edges of the forest, whereas S. alba is more broadly
was projected to be broadly resilient to high rates of sea-level distributed. At most sites and under all sea-level rise scenarios,
rise until about 2060 (figs. 11–17). Only in the second half of S. alba increased slightly in cover for about 30–40 years
the century at high or extreme rates of sea-level rise were large before dropping in prevalence. Rhizophora stylosa increased
changes in elevation or community composition projected in cover across all sites and sea-level rise scenarios, except at
(figs. 11–13). Areas on the west side of the island were the Alohkapw where it gradually decreased from a relatively high
most vulnerable to sea-level rise and included the West region; amount of cover. The projected transition to R. stylosa was
it was projected to lose modest amounts (less than 25 percent) responsible for the maintenance of total mangrove cover at
of mangrove area by 2100 under the moderate sea-level rise Enipein, Palikir, and Sapwalap under the 67-cm sea-level rise
scenario (fig. 16).Results 15 Figure 9. Mean (±standard error) observed and modeled accretion rates during the 20-year validation period (1999–2019) for two sites with data from surface-elevation tables, Pohnpei, Federated States of Micronesia.
16   Mangrove Species’ Response to Sea-Level Rise Across Pohnpei, Federated States of Micronesia

     Figure 10. Mean (±standard deviation) elevation (relative to mean sea level) for the seven study sites on Pohnpei,
     Federated States of Micronesia, under four sea-level rise scenarios from 2020 to 2100 based on global emission scenarios.
Results 17 Figure 11. Average mangrove area (percent of initial) for each region on Pohnpei, Federated States of Micronesia, under sea-level rise scenarios (37, 52, 67, and 117 cm by 2100) from 2020 to 2100.
18   Mangrove Species’ Response to Sea-Level Rise Across Pohnpei, Federated States of Micronesia

Figure 12. Percentage (±standard deviation) of the Enipein, Palikir, Pwudoi, and West study areas on Pohnpei, Federated States of
Micronesia, covered by each mangrove species projected to have more than15-percent cover under low (37 cm), moderate (52 cm),
high (67 cm), and extreme (117 cm) sea-level rise scenarios from 2020 to 2100.
Results  19

Figure 13. Percentage (±standard deviation) of the Alohkapw, Enipoas, and Sapwalap study areas on Pohnpei, Federated States of
Micronesia, covered by each mangrove species projected to have more than 15-percent cover under low (37 cm), moderate (52 cm),
high (67 cm), and extreme (117 cm) sea-level rise scenarios from 2020 to 2100.
20   Mangrove Species’ Response to Sea-Level Rise Across Pohnpei, Federated States of Micronesia

     Figure 14. Mangrove community composition across Pohnpei, Federated States of Micronesia, under 2020 conditions and
     37 cm of sea-level rise by 2100 in 20-year intervals.
Results 21 Figure 15. Mangrove community composition across Pohnpei, Federated States of Micronesia, under 2020 conditions and 52 cm of sea-level rise by 2100 in 20-year intervals.
22   Mangrove Species’ Response to Sea-Level Rise Across Pohnpei, Federated States of Micronesia

     Figure 16. Mangrove community composition across Pohnpei, Federated States of Micronesia, under 2020 conditions and
     67 cm of sea-level rise by 2100 in 20-year intervals.
Results 23 Figure 17. Mangrove community composition across Pohnpei, Federated States of Micronesia, under 2020 conditions and 117 cm of sea-level rise by 2100 in 20-year intervals.
24   Mangrove Species’ Response to Sea-Level Rise Across Pohnpei, Federated States of Micronesia

Discussion                                                                 Climate adaptation and planning may be important on
                                                                     Pohnpei given the uncertainty of future climate projections,
      Our modeling results projected that mangroves around           greenhouse gas emissions, and complex ocean-ecological
Pohnpei are likely to be resilient to low and moderate sea-level     processes. This modeling can be used to reduce uncertainties
rise rates (fig. 11), with limited changes in community              in future mangrove forest change under sea-level rise
composition expected during the first 30 years of the 80-year        scenarios, but continued monitoring and reassessments of the
simulation (figs. 12, 13). The projected changes in mangrove         forest health over time would further inform planning. Also,
community composition are consistent with a decrease in high         our findings indicate that the present, relatively undisturbed
elevation mangrove forest (X. granatum) and a subsequent             state of the mangrove forests and the surrounding landscape is
increase in low elevation forest (R. stylosa and S. alba). Our       an important factor in their ability to keep pace with sea-level
model domain did not include any adjacent upland areas that          rise. Changes in environmental conditions (for example, less
may transition to mangroves by migration. Pohnpei has steep          freshwater delivery or changes to the sediment regime) could
slopes that are characteristic of its volcanic history; therefore,   alter the rates of organic or mineral accumulation, resulting
the potential area for upland transgression is likely quite          in reduced vertical accretion and greater vulnerability to
limited. The absence of high-quality elevation data around           rising seas. Keeping intact riverine outputs to the estuary
the island makes it difficult to generate accurate projections       can maintain mangrove forest function and build resilience.
of transgression, however. Mangroves may move inland in              Upslope mangrove forest migration is also an important
limited areas along specific rivers where elevation changes are      process to consider facilitating into the future.
more gradual.
      Enipein, Sapwalap, Enipoas, and Alohkapw were the              Modeling Assumptions and Information Needs
most resilient sites to sea-level rise and maintained their
elevations and forest composition the longest in our model                 As with any model, we were required to make several
results (figs. 10–13). Alohkapw, Enipoas, and Sapwalap               simplifying assumptions and omit important processes
had relatively high elevations within the tidal frame, which         because of a lack of local information. For this effort, we
increased their resilience, whereas community composition            focused on the above and belowground processes that control
changes at Enipein maintained cover (fig. 12). The sites at          elevation and mangrove response to changes in flooding.
Alohkapw and Sapwalap are also near large rivers and had             Salinity can be a dominant driver of community composition
higher mineral sediment accumulation rates (accretion) than          and productivity that we chose to omit owing to a lack of field
the other sites (table 4), which contributed to their projected      data and specific knowledge of species responses. Similarly,
resilience. Forest clearing and other human activities in the        the macronutrients nitrogen and phosphorus are known to
watersheds of both sites may be responsible for the elevated         play an important role in limiting mangrove growth in the
rates of sediment deposition; it is also possible that these sites   Caribbean (Castañeda-Moya and others, 2013); however, we
are naturally more resilient because they are near large rivers      left nutrients out of our model to reduce model complexity
and natural sediment addition to the nearshore. Additional           and because we lacked calibration data. To some degree,
analysis of the dated soil-core intervals could help determine       the effects of salinity and nutrients are both captured in the
whether accretion rates at these sites have increased in the last    elevation distributions for each species, and at a regional scale,
30 years in relation to human activities in the watershed rather     by basal area distributions derived from forest inventory plots.
than natural processes.                                                    By calibrating the model with soil-core accumulation
      The most vulnerable region, West, is on the leeward side       rates, we are assuming that the relationships between basal
of the island, where the largest continuous area of mangrove         area and rates of productivity and decomposition over the
forest grows. Compared with most other regions, this area            last 75 years are representative of future conditions. Human
had relatively low initial elevation (fig. 10) and low accretion     development and climate change could both cause changes in
rates, which translated to greater vulnerability in the future.      the environment that affect mangrove productivity, however.
Enipein is also on the leeward side of the island, but the model     For example, changes in freshwater delivery or sediment
showed resilience under the 67 cm sea-level rise scenario.           loading could have a strong effect on the health and resilience
The elevation leveling surveys at Enipein and Palikir did not        of Pohnpei mangroves. Additional scenarios of changes in
extend the full width of the mangroves, and no elevation data        sedimentation or productivity could be explored to understand
were available for West, making the initial DEM at these sites       the sensitivity of the projections to these assumptions.
more uncertain compared to the other sites. Considering the          Furthermore, data that identify the source of the sediment in
projected high vulnerability and low measured accretion rates        mangrove forests across each region are needed to understand
at some sites on the leeward side of the island, additional          what is ultimately driving relative resilience. For example,
measurement and monitoring of mangrove elevations (for               discharge and suspended sediment monitoring of major rivers
example, continued monitoring of new rod SETs installed in           would provide valuable information about variability of
2019 that were established with vertical elevation control) and      sediment inputs into mangrove forests.
water levels could provide valuable data.
You can also read