Mapping land surface temperatures and heat-health vulnerability in Darwin - CSIRO Research
←
→
Page content transcription
If your browser does not render page correctly, please read the page content below

[TYPE HERE]

                                                             Australia’s National
                                                                 Science Agency

Mapping land surface
temperatures and heat-
health vulnerability in
Darwin

Jacqui Meyers, Art Langston, Drew Devereux, and Brenda Lin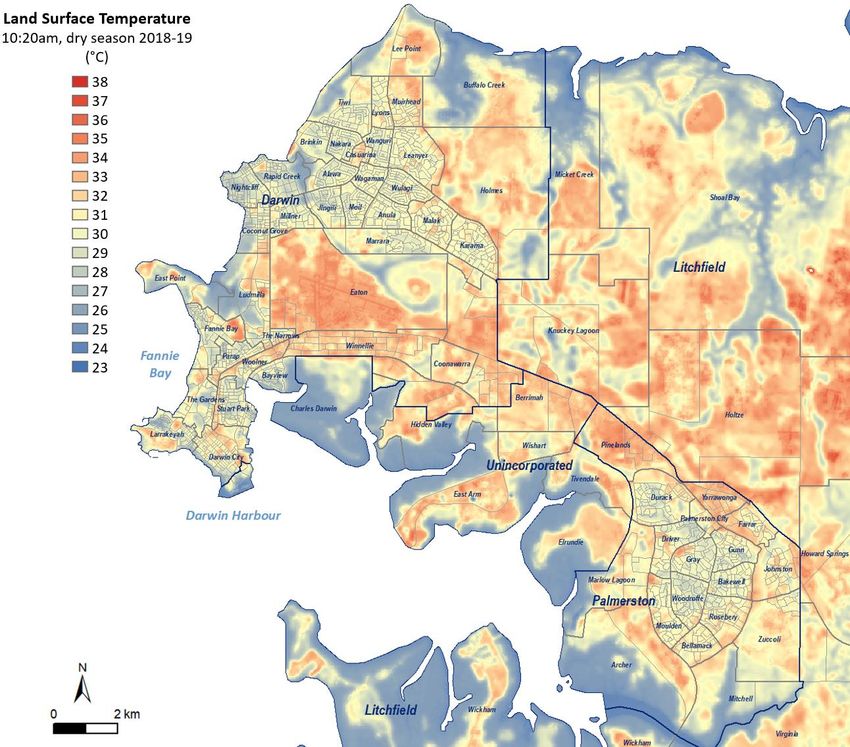
About
This report was delivered as part of the work of the Darwin Living Lab. The Darwin Living Lab was
established to foster improvements in the liveability, sustainability and resilience of the city. The Darwin
Living Lab is an initiative under the Darwin City Deal and is a 10-year collaboration between CSIRO and the
partners of the Darwin City Deal: Australian Government, Northern Territory Government and the City of
Darwin. The City Deal was signed by the Prime Minister of Australia, Chief Minister of the Northern
Territory and Lord Mayor of the City of Darwin in November 2018.
More information and contacts available at: https://research.csiro.au/darwinlivinglab/

Acknowledgments
We acknowledge the Traditional Owners of the greater Darwin region, the Larrakia people, and recognise
their culture, history and connection to this land and water. We pay our respects to their Elders past, present
and emerging.
We would like to thank Josh Forner from the City of Darwin and Andy Roberts from the Department of
Infrastructure, Planning and Logistics, Northern Territory Government for providing data for this project. We
also thank Guy Barnett, Stephen Cook and Stephen Sarre for comments on drafts of this report.
This work was jointly funded by the CSIRO and the Darwin Living Lab, a 10-year collaboration between CSIRO,
the Australian and Northern Territory Governments and the City of Darwin.

Copyright
© Commonwealth Scientific and Industrial Research Organisation 2020. To the extent permitted by law, all
rights are reserved and no part of this publication covered by copyright may be reproduced or copied in any
form or by any means except with the written permission of CSIRO.

Important disclaimer
CSIRO advises that the information contained in this publication comprises general statements based on
scientific research. The reader is advised and needs to be aware that such information may be incomplete or
unable to be used in any specific situation. No reliance or actions must therefore be made on that information
without seeking prior expert professional, scientific and technical advice. To the extent permitted by law,
CSIRO (including its employees and consultants) excludes all liability to any person for any consequences,
including but not limited to all losses, damages, costs, expenses and any other compensation, arising directly
or indirectly from using this publication (in part or in whole) and any information or material contained in it.
CSIRO is committed to providing web accessible content wherever possible. If you are having difficulties with
accessing this document please contact csiroenquiries@csiro.au.

Citation
Meyers J, Langston A, Devereux D and Lin BB (2020) Mapping land surface temperatures and heat-health
vulnerability in Darwin. CSIRO, Australia.

                                                   Mapping land surface temperatures and heat-health vulnerability in Darwin | i
Contents
Acronyms and glossary ................................................................................................................................. iv
Executive summary........................................................................................................................................ v
1           Introduction .................................................................................................................................... 1
2           Background ..................................................................................................................................... 2
            2.1          The Darwin climate ........................................................................................................... 2
            2.2          Urban heat islands ............................................................................................................ 3
            2.3          Surface urban heat islands................................................................................................ 3
            2.4          Extreme heat and human health ...................................................................................... 3
3           Rationale and methods ................................................................................................................... 5
            3.1          Estimating land surface temperatures ............................................................................. 5
            3.2          Land surface temperatures of urban features.................................................................. 7
            3.3          Neighbourhood Heat-Health Vulnerability Index ............................................................. 9
4           Patterns of land surface temperature........................................................................................... 11
            4.1          Seasonal vegetation cover and land surface temperatures ........................................... 11
            4.2          Greater Urban Area ........................................................................................................ 13
            4.3          Hot spots ......................................................................................................................... 14
            4.4          Cool spots ....................................................................................................................... 15
            4.5          Land surface temperature and land cover type ............................................................. 16
            4.6          Land surface temperatures and urban development ..................................................... 17
            4.7          Neighbourhood land surface temperatures and urban features ................................... 21
            4.8          Potential planting sites to reduce land surface temperatures ....................................... 23
5           Neighbourhood heat-health vulnerability .................................................................................... 24
6           Conclusion and potential next steps ............................................................................................. 26
7           References..................................................................................................................................... 27

Figures
Figure 1. 20-year mean monthly rainfall and temperature data for Darwin Airport (1999‒2018). ............ 2
Figure 2. Darwin Area showing the ABS boundaries referred to in this document. .................................... 8
Figure 3. NDVI for (left) 17-April-2018 and (right) 7-August-2018. ............................................................ 12
Figure 4. LST for (left) the seasonal transition period (Apr‒May) and (right) the dry season (Jun‒Aug). . 12

CSIRO Australia’s National Science Agency                                  Mapping land surface temperatures and heat-health vulnerability in Darwin | ii
Figure 5. Dry season LST for the Greater Urban Area based on Landsat 8 thermal imagery for Jun‒Aug in
2018‒19 at 10:20 a.m................................................................................................................................. 13
Figure 6. LST ‘hot spots’ and examples of areas or features with this characteristic. ............................... 14
Figure 7. LST ‘hot spots’ and examples of areas or features with this characteristic. ............................... 15
Figure 8. a) Mean LST and standard deviations for land cover classes showing departures from the
coolest land cover class ‘Mangroves’. b) Examples of LST for selected areas. .......................................... 16
Figure 9. Mean LST (blue) and % tree cover (green) for ten Town Planning Zones. .................................. 17
Figure 10. Mean LST (blue) and % tree cover (green) for Residential Town Planning Zones. ................... 17
Figure 11. Departures from baseline median Mesh Block LST plotted against observed values for three
modelled landscape characteristics. .......................................................................................................... 22
Figure 12. Median dry season LST (Jun-Aug, 2018-19 at 10:20 a.m.) and features of selected residential
Mesh Block ‘neighbourhoods’ (A-E). .......................................................................................................... 22
Figure 13. Areas where areas of high LST coincide with areas of grass or bare ground. ........................... 23
Figure 14. Greater Urban Area: Neighbourhood Heat-Health Vulnerability Index (NHVI). ....................... 25
Figure 15. Dry season LST for the City of Darwin based on Landsat 8 thermal imagery for Jun‒Aug in
2018‒19 at 10:20 a.m................................................................................................................................. 33
Figure 16. Dry season LST for Central Darwin based on Landsat 8 thermal imagery for Jun‒Aug in 2018‒
19 at 10:20 a.m. .......................................................................................................................................... 34
Figure 17. City of Darwin: Neighbourhood Heat-Health Vulnerability Index (NHVI). ................................ 35
Figure 18. Dry season LST for the City of Palmerston based on Landsat 8 thermal imagery for Jun‒Aug in
2018‒19 at 10:20 a.m................................................................................................................................. 36
Figure 19. City of Palmerston: Neighbourhood Heat-Health Vulnerability Index. ..................................... 37

Tables
Table 1. Landsat 8 images collected at 10:20 a.m. and corresponding 9 a.m. and daily weather conditions
at Darwin Airport (Station ID: 014015)......................................................................................................... 6
Table 2. Selected urban areas showing the aerial image (ESRI) and thermal image. ................................ 18
Table 3. Seasonal differences in LST at Royal Darwin Hospital and Darwin International Airport. ........... 20
Table 4. Summary statistics from the multiple linear regression analysis. ................................................ 21

CSIRO Australia’s National Science Agency                                 Mapping land surface temperatures and heat-health vulnerability in Darwin | iii
Acronyms and glossary
 ABS                            Australian Bureau of Statistics

 ABS 2016 Census                Australian Bureau of Statistics 2016 Census of Population and Housing

 BOM                            Bureau of Meteorology

 CBD                            Central Business District

 CDU                            Charles Darwin University

 CSIRO                          Commonwealth Scientific and Industrial Research Organisation

 Grass                          Native and introduced grasses and pasture

 JCU                            James Cook University

 LGA                            Local Government Area

 LST                            Land surface temperatures

 LiDAR                          Light Detection and Ranging; a survey method that measures distance to a target
                                using laser light

 Mesh Block                     The smallest geographical unit for which ABS Census data are available. The
                                majority of populated Mesh Blocks contain between 30 to 60 dwellings but if there
                                are more dwellings in a large building or complex, these are grouped into one Mesh
                                Block (ABS, 2016a)

 NDVI                           Normalized Difference Vegetation Index

 NHVI                           Neighbourhood Heat-Health Vulnerability Index where a Mesh Block is defined as
                                a ‘neighbourhood’

 Savanna woodland               A mixed woodland-grassland ecosystem in which trees have an open canopy that
                                does not close, allowing sufficient light to reach the ground to support an unbroken
                                grassy herbaceous layer

 TIRS                           Thermal Infrared Sensor on-board the Landsat 8 satellite

 TPZ                            Town Planning Zones

 UCL                            Urban Centre/Locality; an ABS area of concentrated urban development with
                                populations of 200 people or more that are primarily identified using objective
                                dwelling and population density criteria using data from the 2016 Census

 Greater Urban Area             An area that incorporates the ABS Darwin Urban Centre/Locality and Darwin and
                                Palmerston Local Government Areas

 UNSW                           University of New South Wales

CSIRO Australia’s National Science Agency                   Mapping land surface temperatures and heat-health vulnerability in Darwin | iv
Executive summary
High temperatures can have multiple impacts on air and water quality, resource use and human health.
Prolonged exposure to high temperatures and high humidity can increase the risk of poor health in
sensitive populations. Darwin’s climate is projected to become warmer in the future, providing a challenge
to improve thermal comfort in the city.
The Darwin City Deal aims to transform Darwin into a best-practice example of tropical urban living. A key
commitment of this deal is to cool and green the city to improve its liveability. This report assists with that
goal by providing information to the Northern Territory Government, the City of Darwin and the City of
Palmerston to support action to reduce urban heat. It is a companion to the CSIRO report ‘Developing a
Darwin Heat Mitigation Strategy: A resource towards strategy development for the Northern Territory
Government and City of Darwin’ (Lin et al., 2020), which provides a compilation of strategies and options to
reduce urban heat in Darwin
Specifically, we map seasonal land surface temperatures in Darwin and model patterns of heat distribution
against several built and natural urban features. We show that land surface temperatures vary with different
types of surface cover, the type and seasonality of vegetation, the presence of water, and distance from the
coast. We also provide maps of neighbourhood heat-health vulnerability based on data from the 2016 ABS
Census of Population and Housing. Together, these maps help to build the evidence base to guide climate
adaptation planning in Darwin.

Key findings
Land surface temperature ‘hot spots’
Identifying features associated with thermal ‘hot spots’ can support mitigation plans for counteracting
overheating in urban areas. Hotter areas typically have a high proportion of buildings and paved surfaces and
have few trees, which is common in commercial and industrial areas. Built infrastructure tends to have high
heat holding capacity, storing heat during the day and releasing it slowly at night (known as the heat-island
effect). Hot surface temperatures can also be found where there is extensive bare ground or sparse dry
vegetation, but unlike areas with significant built infrastructure, these areas cool down quickly at night. They
are also relatively cooler in wetter periods when the groundcover is green and there is higher soil moisture.
Areas with hotter surface temperatures include:
• Industrial areas (e.g. Winnellie, Pinelands, Yarrawonga) that have a high proportion of buildings and paving.
• Major roads such as the Stuart Highway and intersections that have little shade.
• Wharf/transport/storage/handling hubs with little shade and large areas of paving (e.g. East Arm Wharf).
• New housing developments (e.g. Muirhead, Johnston, Farrar), with extensive areas of bare ground, roofs
  and paving, and few trees, leafy parks or irrigated gardens. These areas will become cooler over time as
  trees and gardens become established.
• High-density accommodation with little green vegetation (e.g. Larrakeyah and Robertson Barracks).
• Sport, transport, or agricultural sites with sparse dry grass and exposed ground (e.g. Darwin Airport, Hidden
  Valley Raceway, rural pasture, Darwin Turf Club, unirrigated sports fields). Surface temperatures will be
  relatively cooler in wetter months when the grass is green and more abundant.
• Rural and construction sites with bare ground that has been cleared or burned.
Land surface temperature ‘cool spots’
‘Cool spots’ are important areas in a city, providing respite from extreme heat in other parts of the city and
for the cooling effect they have on nearby hot areas. Areas that are cooler during the day are found where

CSIRO Australia’s National Science Agency          Mapping land surface temperatures and heat-health vulnerability in Darwin | v
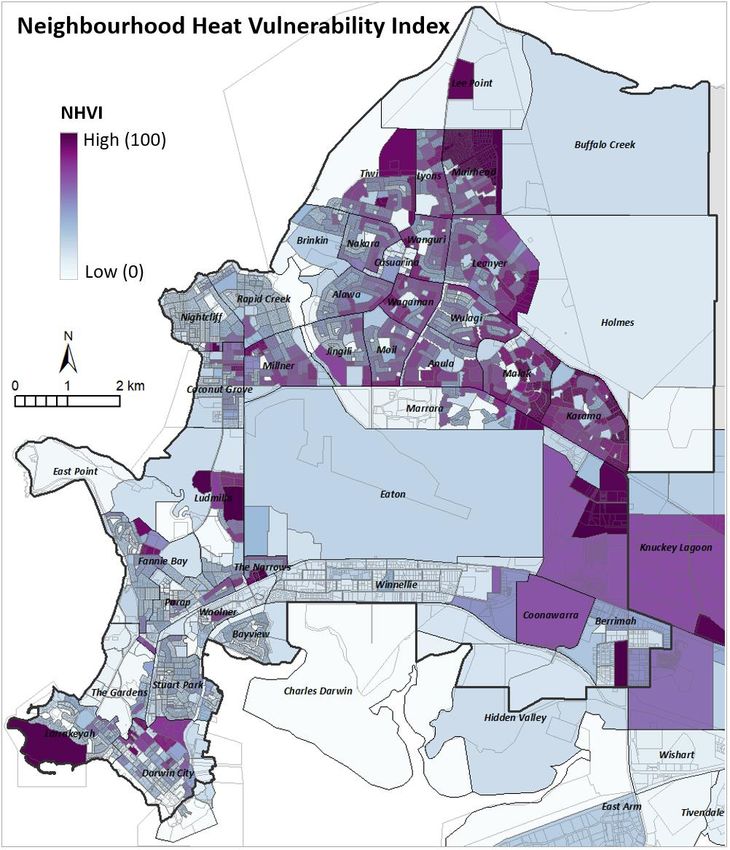
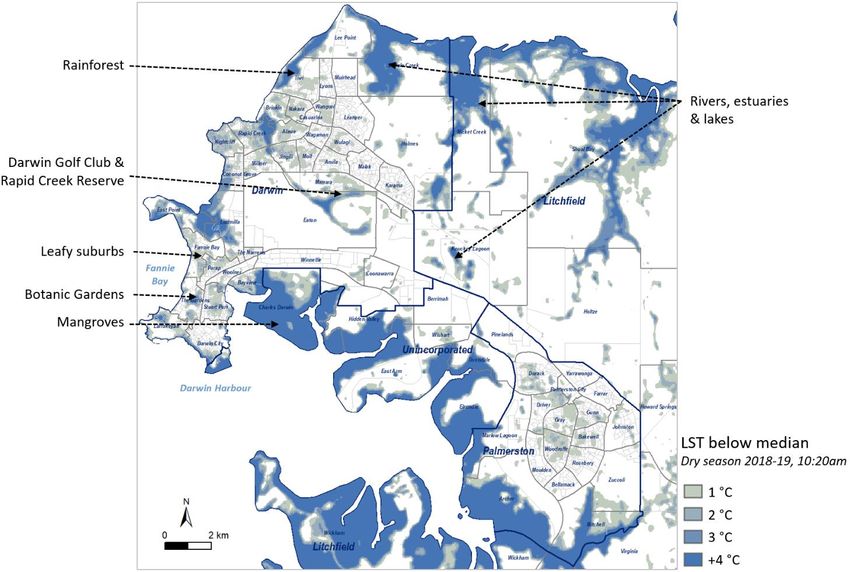
there is water, green vegetation or shade. The coolest vegetation types remain green all year, have denser
canopies and grow in wetter areas, for example, mangroves, coastal rainforest and riverine vegetation. Areas
with shade cast by buildings, trees or shade structures are also cooler.

Areas with cooler surface temperatures include:
• Wet areas along the coast, rivers, estuaries and lakes.
• Mangroves, coastal rainforest and riverine vegetation that have dense foliage, particularly if it is found in
  wetter areas.
• Leafy, irrigated public areas such as the Darwin Botanic Gardens.
• Irrigated areas, water features, ocean and lake edges that include irrigated playing fields, marinas, golf
  courses, wetlands, and sewage settling ponds.
• Residential areas that have green vegetation, tree cover and irrigated gardens (e.g. Stuart Park).
• Areas that are shaded by built structures, particularly if the structures are built from cool materials.
Land surface temperatures and land-use planning
Different land cover types and Town Planning Zones (TPZ) have different mean surface temperature and
vegetation cover profiles. Understanding which features typically have higher of lower surface temperatures
can assist planners with choosing materials or land cover types that can reduce urban heat. Comparisons of
different TPZ showed that ‘Industrial’ and ‘Service Commercial’ zones had comparatively little tree cover and
were more than 4.5 °C warmer on average than the coolest TPZ ‘Conservation’.
Neighbourhood land surface temperatures and urban features
A model was created to determine the contribution that different urban features such as dwelling density,
distance from the coast, bare ground, roads and paths, buildings, and tree cover make to land surface
temperatures in residential neighbourhoods. We found that there is a 7.5 °C mean land surface temperature
difference between the warmest and coolest residential neighbourhoods and that neighbourhoods are
cooler when they have more tree cover, less bare ground, roads and paths, and are closer to the coast.
Population vulnerability
The Neighbourhood Heat-Health Vulnerability Index was created to identify areas where more residents may
be exposed to high temperatures and have a high risk of heat-related illness and fewer economic resources
to invest in adaptation strategies. Based on ABS Census data for 2016, small areas with high heat-health
vulnerability were found within the City of Darwin (Ludmilla, Tiwi, Berrima, The Narrow, Fannie Bay, Marrara,
Coconut Grove, and Darwin City), the City of Palmerston (Johnston, Gray, Bellamack, and Moulden) and in
Litchfield (Holtze). The areas identified exhibited higher median land surface temperatures and had residents
living in either low-income households, public housing, Indigenous communities, aged care facilities, or
correctional facilities.
Conclusion and potential next steps
This report and the spatial data developed in this project provide resources to support the Northern Territory
Government, the City of Darwin and the City of Palmerston in taking actions to mitigate urban heat. The data,
maps and analyses prepared in this project contribute to the knowledge base of urban heat and heat-health
vulnerability across the Darwin region. The work complements previous findings by researchers who focused
on different aspects of urban heat and heat-health vulnerability in Darwin.

CSIRO Australia’s National Science Agency         Mapping land surface temperatures and heat-health vulnerability in Darwin | vi
[TYPE HERE]

1         Introduction

Darwin has a diverse and multicultural population of almost 150,000 people including the Larrakia people
who are the traditional owners of the region. Darwin has a wet-dry tropical climate with year-round warm to
hot daytime temperatures and high humidity during the wet season. Climate change is projected to increase
temperatures (Webb and Hennessy, 2015) exacerbating the risk of heat stress and heat-related illness in the
city (Loughnan et al., 2013; Oppermann et al., 2017; Parsons, 2014).
Temperature, humidity, exposure, exertion, and sensitivity are key elements of health that combine to
produce different levels of heat-health risk in a population (Oppermann et al., 2017). Developing an
understanding of how these elements vary across Darwin is one step towards having the information to
manage that risk.
This project contributes to this understanding by providing maps of land surface temperature and potential
heat-health vulnerability in Darwin. Using thermal data from satellites to generate maps of land surface
temperatures has been a standard method for assessing the geographic distribution of urban heat for more
than 20 years in cities around the world (Estoque et al., 2017; Imhoff et al., 2010; Maimaitiyiming et al., 2014)
and in Australia (202020 Vision, 2017; Coutts et al., 2016; Deilami et al., 2016; Sharifi et al., 2017).
The Darwin City Deal is a ten year plan to position Darwin as a vibrant and liveable tropical city, supported
by a growing population and diverse economy (Australian Government et al., 2018). A key commitment of
the Darwin City Deal is to improve liveability by cooling and greening the city.
This report and associated spatial data are deliverables to the Darwin City Deal, providing resources to
support the Northern Territory Government, the City of Darwin and the City of Palmerston with mitigating
urban heat. This foundational research also provides baseline measurements for evaluating heat mitigation
efforts and for developing further research initiatives, for example, the effect of humidity on thermal
comfort.
The project brief was to:
1. Generate Landsat 8 land surface temperature estimates for the City of Darwin LGA, ideally for both wet
   and dry seasons, to build an understanding of how heat is distributed across the LGA.
2. Use data from the Australian Bureau of Statistics (ABS) and other relevant sources to characterise the
   sociodemographic and individual risk factors for health impacts during urban heat, as well as the role of
   ‘place’, including housing, urban form and social-ecological context.
3. Develop a spatially-explicit model of integrated datasets and map patterns of vulnerability to urban heat
   across the City of Darwin.
This report is divided into six sections:
• Section 1: Introduction to the report
• Section 2: Summary of Darwin’s climate, urban heat and heat sensitivity in the population
• Section 3: Methods used to develop maps of land surface temperatures and neighbourhood heat-health
             vulnerability
• Section 4: Maps of land surface temperatures and a summary of findings
• Section 5: Maps of neighbourhood heat-health vulnerability and a summary of findings
• Section 6: Summary and conclusions

                                                                                                               1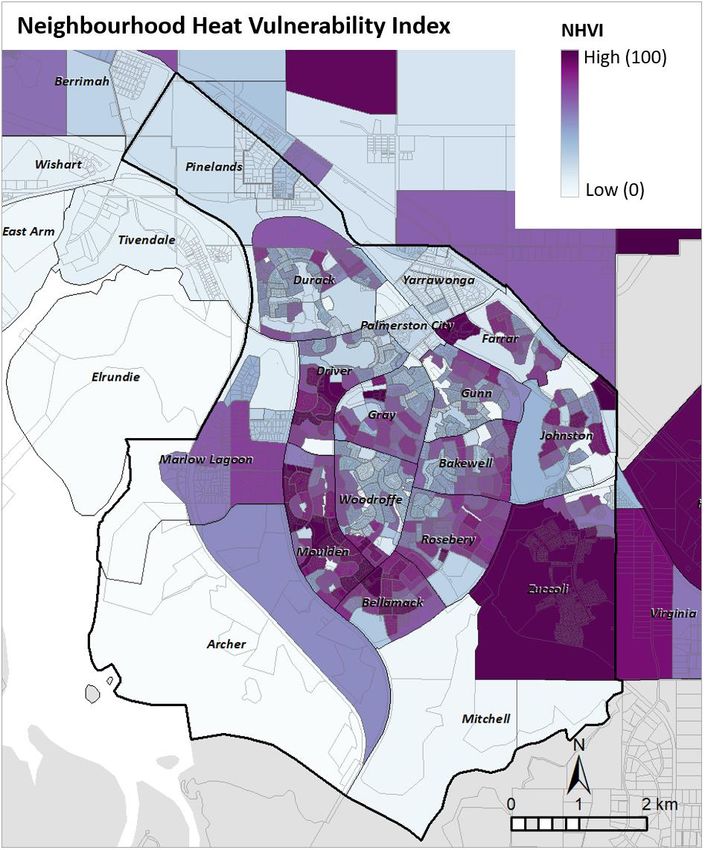
2 Background

2.1         The Darwin climate
Darwin‘s tropical savanna climate has distinct wet and dry seasons and year-round warm to hot temperatures
(Every et al., 2020). In the wet season high temperatures combined with high humidity can make conditions
feel very uncomfortable and it can be difficult to get a good night’s sleep when overnight temperatures
remain warm. In contrast, the dry season has lower humidity and cooler overnight temperatures, often below
20 °C, making conditions more comfortable for sleeping at night.
The wet season begins with the early storm period in October or November. This period is often referred to
as the ‘build-up’ and is characterised by an increase in atmospheric humidity and patchy convective storms
(Braithwaite, 1988). This is followed by the onset of the monsoon period in December or January, but most
rain falls in February and March (Figure 1). Occasional storms continue into the transition period between
the wet and dry seasons in April and May. This is followed by the dry season when temperatures are slightly
cooler and soil and atmospheric moisture levels are lower.
Indigenous cultural knowledge has recognised seven seasons for the area that includes Darwin, Cox Peninsula
and Gunn Point. Members of the Gulumoerrgin (Larrakia) language group and CSIRO developed a calendar
representing seasonal ecological knowledge, identifying Balnba (rainy season), Dalay (monsoon season),
Mayilema (speargrass, Magpie Goose egg and knock 'em down season), Damibila (Barramundi and bush fruit
time), Dinidjanggama (heavy dew time), Gurrulwa (big wind time) and Dalirrgang (build-up) (Williams et al.,
2012).
Over the last 20 years, mean monthly
maximum temperatures in Darwin only
ranged between 31 °C in June and 33.9 °C in
October while minimum temperatures
varied between 19.3 °C in July and 25.3 °C in
November (BOM, 2019a) (Figure 1). Mean
annual rainfall was 1731 mm with almost all
rain falling during the wet season.
Cyclones have caused far-reaching damage
and loss of life in Darwin over the years, but
impacts have lessened since the
introduction of cyclone building codes
(Miller, 2014). In March 2018, Tropical Figure 1. 20-year mean monthly rainfall and temperature data
Cyclone Marcus hit Darwin and felled for Darwin Airport (1999‒2018).
thousands of trees, resulting in damage to Data source: BOM Climate Data Online (BOM, 2019a).
buildings and cars, but no lives were lost
(BOM, 2019b).
Climate change is projected to increase the number of days above 35 °C, from an average of 11 days per year
during the period 1981–2010, to an average of 43 days per year by 2030 (under a moderate emissions
scenario) (Webb and Hennessy, 2015). In 2019, Darwin exceeded this number with 45 days above 35 °C,
including a record of 11 days in a row in December (BOM, 2020). December 2019 also had the highest daily
minimum (30.2 °C) ever recorded at Darwin Airport. A rise in the number of very high temperature days in
the future has the potential to increase the risk of heat-related illness and death (Loughnan et al., 2013;
Parsons, 2014), presenting a challenge to improve thermal comfort in Darwin.

CSIRO Australia’s National Science Agency        Mapping land surface temperatures and heat-health vulnerability in Darwin | 2
Climate change is also projected to bring more intense rainfall events and fewer, but more intense tropical
cyclones, but at this stage the magnitude of these changes cannot be predicted with high confidence (Webb
and Hennessy, 2015).

2.2         Urban heat islands
Rural areas have an abundance of vegetation, relatively few built structures, and cool down quickly at night
(Oke, 1981; 1987). By contrast, cities have high concentrations of buildings and paved surfaces that absorb
solar radiation and heat from vehicles, industries and air-conditioning systems during the day and release
this stored heat slowly back into the atmosphere at night (Rizwan et al., 2008; U.S. Environmental Protection
Agency, 2008). Another major reason is the lower level of evapotranspiration from vegetation in urban areas
(Kumar et al., 2017).
This night-time phenomenon is known as the Urban Heat Island (UHI) effect because in thermal mapping,
urban temperatures appear like a warm island surrounded by cooler night-time temperatures in rural areas.
Urban heat islands are found in most cities around the world (Arnfield, 2003). They can create problems for
human health when higher urban temperatures lower thermal comfort, reduce water quality, and lower air
quality which can exacerbate respiratory problems (Akbari and Konopacki, 2005; Mullins, 2018). Higher urban
temperatures also increase the need for air-conditioning.
The choice of building materials can influence how heat is stored (heat capacity), reflected (albedo) and
emitted (emissivity) because different building materials have different thermal properties. Cities tend to
have lots of building materials that have low albedo, low emissivity, and high heat capacity. The layout and
design of buildings and streets also contributes to urban heat by influencing whether hot air becomes trapped
during the day, hindering its release back into the cooler atmosphere at night (Arnfield, 2003).

2.3         Surface urban heat islands
In the absence of a dense network of meteorological stations to measure air temperature across an entire
city, satellite thermal infrared imagery is commonly used to estimate land surface temperature as a proxy for
urban heat. This is an effective way to assess thermal patterns across a wide area and to monitor changes
over time, especially when it is integrated with other locally sourced information. The use of this technique
has been widely adopted for assessing urban heat in many cities around the world (Estoque et al., 2017;
Imhoff et al., 2010; Maimaitiyiming et al., 2014), including in Australia (Coutts et al., 2016; Deilami et al.,
2016; Sidiqui et al., 2016), and in Darwin (202020 Vision, 2017; Devereux and Caccetta, 2017).
The term ‘urban heat island’ refers to air temperature measurements, but when surface temperature is
measured, the term ‘surface urban heat island’ is used. While there is not always a direct relationship
between air and surface temperatures, the presence of a surface urban heat island indicates that an urban
heat island phenomenon is occurring. In general, areas with higher near-ground air temperature tend to have
higher land surface temperatures and vice versa (Coutts et al., 2016). For example, areas of irrigated
greenspace typically have cooler surface and air temperatures while large areas of paving have warmer
surface and air temperatures (Roth et al., 1989; U.S. Environmental Protection Agency, 2008).

2.4         Extreme heat and human health
Optimal human health and physiological functioning relies on the maintenance of an internal body
temperature between 36.5 ˚C and 37.4 ˚C (Parsons, 2014). Physiological and behavioural responses help to
maintain body temperature within this range, but a shift in core temperature beyond this range can result in
serious illness and in extreme cases, death (Health and Safety Professionals Alliance, 2012; Loughnan et al.,

CSIRO Australia’s National Science Agency         Mapping land surface temperatures and heat-health vulnerability in Darwin | 3
2013). In hot conditions, the body maintains its core temperature by shedding heat through dilated blood
vessels in the skin and by sweating (Hanna and Tait, 2015). Sweating is an effective heat loss mechanism that
relies on evaporation from the skin. However, on hot, humid days when there is little wind, sweat evaporates
more slowly, making it difficult to maintain core body temperature (Oppermann et al., 2017; Sherwood,
2018). Dressing in light clothing, keeping hydrated, using air-conditioning, and adopting behavioural
strategies such as seeking refuge in cool places, can help to reduce heat exposure and the associated risk of
heat-related illness (Bouchama et al., 2007; Vandentorren et al., 2006).
Despite acclimatisation to the local climate, heat-related illness and death is a regular occurrence in Darwin
(Bambrick H et al., 2008; Loughnan et al., 2013; Webb et al., 2014). A study of the effects of temperature and
humidity on hospital admission rates in Darwin over an 18 year period indicated that there were higher
admission rates when hot days were preceded by high night-time humidity (Goldie et al., 2015). In another
study, a model of weather conditions and daily anomalies in hospital admissions in Darwin indicated that an
increase of 1 °C in daily maximum temperature could increase hospital admissions by 7.9% (Haddad et al.,
2020). Significantly, when temperatures were higher than 32 °C and humidity was more than 80%, an
increase in daily maximum temperature by 1 °C could raises the number of hospital admissions by 263%.
Certain groups in the community are more sensitive to prolonged heat exposure. The ability to shed heat can
be compromised in people who are elderly (Josseran et al., 2010; Kovats et al., 2004), are very young (Kovats
et al., 2004), lack mobility (Vandentorren et al., 2006), or are unable to adequately care for themselves
(Bouchama et al., 2007; Kilbourne et al., 1982). Excessive heat can also exacerbate some mental and physical
health conditions (Khalaj et al., 2010; Larrieu et al., 2008) including renal (Hansen et al., 2008; Nitschke et al.,
2007) and cardiovascular (Khalaj et al., 2010; Loughnan et al., 2008) disease, conditions that are more
prevalent among the Indigenous population (Bauert, 2005; Penm, 2008; Webb et al., 2014).
When temperature and humidity conditions rise above the range for comfort, health and performance
problems can arise leading to a greater use of air-conditioners or greater exposure for people who work or
spend time outdoors. Exposure to high temperatures are therefore a health hazard for people who are
physically active or work outdoors, or who work indoors in hot environments (Hanna et al., 2011; Zander et
al., 2015).
Other groups, particularly those in low socioeconomic circumstances are more likely to be exposed to high
temperature conditions for prolonged periods if costs restrict their ability to cool their homes or invest in
other adaptation strategies (Farbotko and Waitt, 2011; Nance, 2017). In particular, heat exposure may be
exacerbated if people are homeless, do not have adequate shelter, or live in substandard housing (ACOSS,
2011; Balbus and Malina, 2009).
In summary, people may be more exposed to high temperatures or more vulnerable to its effects through a
combination of socioeconomic, health, age and activity related factors. Identifying areas with high heat
exposure and populations with high heat-health risk can be useful for targeting actions to reduce urban heat
in areas of need (Bao et al., 2015).

CSIRO Australia’s National Science Agency            Mapping land surface temperatures and heat-health vulnerability in Darwin | 4
3 Rationale and methods

3.1         Estimating land surface temperatures

3.1.1       Advantages and disadvantages of satellite remote sensing

Satellite remote sensing is a useful tool for characterising land use, land cover and land surface temperatures.
It has been used to estimate land surface temperatures in many cities around the world, offering a method
to study thermal environments at various spatial (local to global) and temporal (diurnal, seasonal, and
interannual) scales (Zhou et al., 2019). It is a simple and cost-effective method for capturing data across a
broad area at a single point in time and provides repeated coverage whenever the satellite passes overhead
which is useful for assessing changes in dynamic systems over time. The data can be processed and analysed
quickly, and is easily integrated into a Geographic Information System where it can be used for a variety of
purposes (Patino and Duque, 2013; Wentz et al., 2014).
However, there are some limitations of the approach that need to be considered in how the results are
applied and analysed. Although surface temperature will not be the same as the air temperature at any one
location, there is a relationship between the two measurements. Land surface temperatures are most similar
to near-ground air temperatures early in the morning, but throughout the day surface temperatures become
more variable than air temperatures and are faster to respond to sudden changes such as shade from clouds
passing overhead (Good, 2016). There can also be a disconnect between air and surface temperatures when
it is windy (Coutts et al., 2016) and between rooftop temperatures of tall buildings and air temperatures
measured at street level (Roth et al., 1989).
The thermal data provides a snapshot of surface temperatures at the time the satellite passes overhead;
however, it cannot be assumed that the same temperature patterns will be observed across the city at other
times of the day (Voogt and Oke, 1997; 2003). For example, shadows cast from tall buildings, trees and other
objects shift across the course of the day and have different lengths depending on the time of year.
Another limitation of using this approach is that satellites provide a birds-eye view of the city, collecting data
for rooftops, roads and the tops of tree canopies, but do not capture ground temperatures beneath canopies,
or vertical surfaces such as the sides of buildings, or on steep slopes. Also, land surface temperatures may
not be accurate for surfaces with very low emissivity, such as highly reflective rooftops. Irrespective of these
limitations, land surface temperature measurements are useful for assessing patterns of urban heat across
broad areas.

3.1.2       Creating seasonal land surface temperature maps

The Landsat 8 satellite passes over Darwin every 16 days at approximately 10:20 a.m. with a Thermal Infrared
Sensor (TIRS) on-board. The TIRS data used in this study was provided by the United States Geological Survey
(USGS, 2019) at a spatial scale of 30 metres (downscaled from 100 metres prior to supply). The data are
therefore average estimates of the observations within each 30 metre square.
All images of Darwin between April 2018 (i.e. after Tropical Cyclone Marcus) and August 2019 were inspected.
Only images that were cloud and smoke free across the urban area of Darwin were suitable for inclusion. On
this basis, only ten images, between April and August were suitable for use in this project (Table 1).
For each of the ten dates, two adjoining Landsat 8 images were combined to create a single image that
covered the geographic extent of Darwin. All spatial mapping in this project was performed using the

CSIRO Australia’s National Science Agency           Mapping land surface temperatures and heat-health vulnerability in Darwin | 5
geospatial tool ArcGIS 10.5 (ESRI, 2017). The TIRS sensor on the Landsat 8 satellite collects two thermal bands
(Bands 10 and 11). Design flaws in the satellite sensors have resulted in systematic errors in the values
recorded by these sensors and the errors are variable depending on the composition of the land being
sensed. While mathematical corrections reduce the error in both bands, better results were achieved using
the single Band 10 to calculate land surface temperatures for this project. Land surface temperature was
estimated following the method of Jimenez-Munoz and Sobrino (Jimenez-Munoz et al., 2009; Jimenez-Munoz
and Sobrino, 2003) with modifications appropriate for Landsat 8 (Buck, 1981; Yu et al., 2014). Values for total
atmospheric water vapour content were calculated using 9 a.m. air temperature and relative humidity
measurements from Darwin Airport (Table 1).

Table 1. Landsat 8 images collected at 10:20 a.m. and corresponding 9 a.m. and daily weather conditions at Darwin
Airport (Station ID: 014015).

                                            9 a.m.     9 a.m.                             Daily               Daily
                     Date of                                                                                                  7-day
                                              air     relative          9 a.m.            min.                max.
 Season             Landsat 8                                                                                                rainfall
                                            temp.    humidity            tide           air temp            air temp.
                 Imagery collected                                                                                            (mm)
                                             (°C)       (%)                                (°C)                (°C)
                    17 Apr 2018              29.1        71              Low              25.0                 35.1            17.8
                    6 May 2019               26.0        59              High             23.4                 32.6            26.4
 Transition
                    19 May 2018              22.7        52              High             19.4                 30.9             0
                    22 May 2019              27.0        55              High             23.2                 33.3            5.4
                     4 Jun 2018              21.6        42              High             18.7                 30.7             0
                    20 Jun 2018              26.3        26              High             20.7                 33.4             0
                    23 Jun 2019              20.4        31              Flow             15.7                 30.1             0
     Dry
                      9 Jul 2019             24.9        71              Flow             18.4                 32.3             0
                     22 Jul 2018             24.1        28              Flow             17.8                 33.0             0
                     7 Aug 2019              25.1        21              Flow             21.2                 34.0             0
Calculating land surface temperature requires values of land surface emissivity. These were estimated using
an approach based on the Normalized Difference Vegetation Index (NDVI) which is a measure of the vigour
of live green vegetation (Lo and Quattrochi, 2003; Sobrino and Raissouni, 2000; Yu et al., 2014). This
approach calculates the fractional vegetation cover for each 30 metre square, which in turn is used to
determine an emissivity value that is intermediate between vegetation and non-vegetation emissivity values.
A value at the lower threshold is treated as containing no vegetation and may consist of bare soil, asphalt,
brick, concrete or other similar surface materials, whereas the upper threshold, set to 0.9863, indicates an
abundance of live green vegetation (Yu et al., 2014). To further reduce the systemic error, composite seasonal
images were created by overlaying the daily images and deriving the median value within each 30 metre
square.
NDVI was examined across the ten dates. As the season became drier between April and August, the
vegetation became less green and abundant, particularly in rural areas, as the grasses dried, the deciduous
trees and shrubs lost their leaves, and more ground became exposed (Figure 3). There is a well-established
relationship between NDVI and LST as vegetation vigour has an important influence on land surface
temperature. In line with the drying of the vegetation between April and August, the surface temperatures
also shifted across the dry season, particularly in rural areas. As a result of this finding, two composite LST
images were created, one for the seasonal transition period (April‒May) and one the dry season (June‒
August).

CSIRO Australia’s National Science Agency                        Mapping land surface temperatures and heat-health vulnerability in Darwin | 6
3.2 Land surface temperatures of urban features
3.2.1 Land surface temperature and land cover type
Assessing the relationship between land surface temperatures and land cover/vegetation type requires
appropriate spatial data. Data on different vegetation types were available for rural areas around Darwin,
but not for all urban areas. In response, a classification scheme of broad vegetation and land cover types for
Darwin was developed by CSIRO for this project.
The classification was developed at an alignment and spatial resolution of 30 metres to match the resolution
of the land surface temperature data. The data sets used to develop the land cover classification were:
Layer 1: Remnant vegetation survey: Darwin to Palmerston region (Brock, 1995)
Layer 2: Catchment scale land use of Australia – 2014 update (DAWR, 2014)
Layer 3: Landsat 8 Bands 5, 6 and 7 for imagery dated 6 May 2019 (USGS, 2019)
Layer 4: Digital Elevation Model of Australia derived from LiDAR 5 Metre Grid (Geoscience Australia, 2015)
The extent of existing remnant vegetation was determined from data in Layers 1 and 2. For the remaining
areas, broad cover classes were developed by running an unsupervised Iso Cluster Classification on the
Landsat 8 (Layer 3) spectral signals which finds spectrally similar clusters in the multiband image. Based on
the spectral signals of known class types and visual inspection, the clusters were classified into broad land
cover classes, as follows: Water, Mixed Woodland, Beach and Mudflats (coast), Hard Surface (inland), Bare
Ground, Dry Grass, Green Grass, Roof and Moderate Trees, Roof and Sparse Trees, and Roof Dominated. The
three classes with roofs and trees were differentiated into the three new classes based on their relative
proportions within each 30 metre square. Mixed and unassigned classes were reclassified based on spatial
relationships between classes and topographic location using the DEM data (Layer 4).
Trained from the Landsat 8 spectral signals (Layer 3) for vegetation classes within the extant remnant
vegetation (Layer 1) (i.e. Melaleuca, Eucalyptus, Pandanus, and Riparian) (Layer 1), a Maximum Likelihood
Classification was run and the results were applied to the Mixed Woodland class (previously identified) within
the urban extent. The final classifications were combined with the remnant vegetation layer (Layer 1) to form
the land cover classification map, and summary statistics were calculated by land cover class.
3.2.2 Land surface temperature and Town Planning Zones
To assess the relationship between surface temperatures and land cover, the map of dry season land surface
temperature was overlaid with a map of Town Planning Zones for the region (NTG, 2019). This data was made
available with permission from the Northern Territory Government for use in this project. Median LST was
extracted for each Town Planning Zone class.
3.2.3 ‘Potential’ planting areas to reduce high land surface temperatures
Some areas of bare ground or sparse dry groundcover could be appropriate for planting trees or other
evergreen vegetation to reduce high surface temperatures. Locating appropriate spots requires knowledge
of where it is hot and where there is bare ground. Planting trees and shrubs would not be appropriate, for
example, in areas where they would create a safety hazard, such as at the airport.
The map of ‘potential’ planting areas to ameliorate high surface temperatures was developed using two data
sets:
Layer 1: Dry season land surface temperature developed as part of this project
CSIRO Australia’s National Science Agency Mapping land surface temperatures and heat-health vulnerability in Darwin | 7Layer 2: Surface Cover (GeoVision™ Geoscape Surface Cover 2019 2 metre grid) (Pitney Bowes, 2019)
made available with permission from the City of Darwin for use in this project. The surface cover
classes are: Bare Ground, Roads and Paths, Grass, Trees, Unspecified Vegetation, Built-Up Areas,
Water, Buildings, Shadow, and Swimming Pool.
The map of ‘potential’ planting locations was developed by showing LST (Layer 1) in areas that coincide
with areas of grass or bare ground (Layer 2).
3.2.4 Modelling land surface temperatures in residential areas
A model was developed to assess the contribution that some natural and built urban features make to LST in
residential neighbourhoods. Neighbourhoods were defined as ABS 2016 Mesh Blocks (ABS, 2016a) classified
as ‘Residential’ (n=1097) within the Greater Urban Area (Figure 2). Most Mesh Blocks contain between 30
and 60 dwellings (ABS, 2016a). Data aggregated up to Mesh Block scale provides insights into the contribution
that different features within that Mesh Block make to mean surface temperature.
Figure 2. Darwin Area showing the ABS boundaries referred to in this document.
Boundaries: ABS (ABS, 2018).
For each residential Mesh Block, median LST was calculated and expressed as degrees Celsius above the
coolest residential Mesh Block. A best fit model multiple linear model was created for LST and features that
have been found to contribute to LST in similar studies, including:
• Gross dwelling density, calculated from the area and total number of dwellings in each Mesh Block
(ABS, 2016a)
• Distance from the coast, calculated from the centroid of each Mesh Block within the software package
ArcGIS 10.5 (ESRI, 2017)
CSIRO Australia’s National Science Agency Mapping land surface temperatures and heat-health vulnerability in Darwin | 8• Percentage of different surface cover types; ‘Bare ground’, ‘Trees’, ‘Roads and Paths’, ‘Buildings’,
‘Impervious Cover’ (buildings, roads and paths) based on data in the product GeoVision™ Geoscape
Surface Cover 2019 2 metre grid (Pitney Bowes, 2019) made available with permission by the City of
Darwin for use in this project
The amount of grass cover was not included as a factor as the data does not differentiate irrigated from
unirrigated grass, a factor that has been found to be an important determinant of LST. Correlations between
the factors were examined and multiple linear regression analyses was applied to develop a ‘best-fit’
statistically significant model.
3.3 Neighbourhood Heat-Health Vulnerability Index
A population’s risk of poor health outcomes from prolonged exposure to high temperatures is dependent on
a number of factors including the level of exposure, the health status of the population and the demographic
structure of the population (Loughnan et al., 2013). All three aspects were included in a Neighbourhood Heat-
Health Vulnerability Index (NHVI) that was created to help identify areas where there are more residents
with a higher risk of heat-related illness, have fewer economic resources to cool their homes or invest in
adaptation strategies, and are exposed to higher surface temperatures.
Census data can be used to build community profiles about the demographic and socioeconomic makeup of
the community and the type of dwelling that people are living in at the time of the Census. The Census is a
rich source of data that is updated every five years. Drawbacks in its use, however, are that community
profiles may change between Census dates, people may have been missed from the Census either by choice,
or if they were travelling or difficult to contact (ABS, 2011). As the number of itinerant or homeless people
may be underrepresented in the Census, the NHVI results in this report provide a foundation upon which
local knowledge can be added to ensure that heat mitigation actions are appropriately targeted to improve
conditions for Darwin’s vulnerable residents.
The NHVI is mapped at the ABS Mesh Block scale, which is the smallest area for which Census data are
available (ABS, 2016a). Most residential Mesh Blocks contain between 30 and 60 dwellings (ABS, 2016a).
Aggregation of data to the Mesh Block level maintains confidentiality of individuals and households. The NHVI
was created for all Mesh Blocks within the Darwin Greater Urban Area (see Figure 2 for boundaries). The size
of Mesh Blocks does vary but are relatively consistent within urban areas.
Based on a literature review of heat-health risk factors (Section 2.4) and of vulnerability indices developed
for other cities (Bao et al., 2015; Reid et al., 2009; Rinner et al., 2010; Wolf et al., 2015), the following ABS
2016 Census variables (ABS, 2016b) were used to create the index:
• Heat-health risk: people who are ‘elderly’ (65 years or older); ‘very young’ (under 5 years old); ‘need
assistance with core activities’ (self-care, mobility or communication); or who identify as ‘Aboriginal
and Torres Strait Islander’.
• Economic resources available to a household: people who live in ‘public housing’; or who live in ‘low-
income households’. Low-income households are often defined as those in the lowest 20% or 25% of
income (ABS, 2017; ACOSS, 2011). The modified OECD equivalence scale is used by the ABS to reflect
the economic resources available to a standardised household (ABS, 2017) and is adopted in this
project. In this measure, the amount of disposable household income is adjusted for the number of
people living in a household and the age of the occupants. Based on the lowest 20‒25% grouping, an
equivalised income below $800 per week is defined as low-income in Darwin, which represents the
lowest 24% of household incomes at the time of the Census in August 2016.
CSIRO Australia’s National Science Agency Mapping land surface temperatures and heat-health vulnerability in Darwin | 9The number of people in each Mesh Block who satisfy each of these criteria were extracted using the ABS tool TableBuilder. Two factors were found to be highly correlated; the number of ‘elderly’ people and those who ‘need assistance with core activities’ (p=0.75), and the latter was dropped from further analyses. To estimate potential exposure to higher temperatures, median dry season LST was calculated for each Mesh Block. While Mean Mesh Block LST is a coarse measure, it is indicative of relative exposure between Mesh Blocks. Median LST was calculated rather than mean as it removes bias associated with extreme values which may occur when there are mixed signals in the satellite imagery close to the coast. The NHVI was calculated by first summing the number of people within each Mesh Block who satisfy the criteria for each of the five risk factors. This represents ‘units of risk’. These values were then ranked and scaled from the Mesh Block with the highest (100) to the lowest (0) risk. The data were ranked because there is no a priori knowledge of the relative importance of an individual count, whereas raw counts would infer that a linear relationship existed. Ranking allows for a simple priority sorting. Next, the median land surface temperatures of Mesh Blocks were ranked and scaled to create a heat exposure score from the hottest (100) to the coolest (0) Mesh Block. Again, ranks were used because there is no a priori relationship between LST values and the relative threat individual values generate. The ranked and scaled ‘units of risk’ and ‘median LST’ were multiplied and the product was ranked and scaled to create a neighbourhood heat-health vulnerability score, from the Mesh Blocks with the highest (100) to the lowest (0) vulnerability. CSIRO Australia’s National Science Agency Mapping land surface temperatures and heat-health vulnerability in Darwin | 10
4           Patterns of land surface temperature

4.1         Seasonal vegetation cover and land surface temperatures
Remotely sensed land surface temperature is a measure of the radiative energy emitted from the surfaces
of different types of materials, vegetation, soils, paving, roofs, and so on (Arnfield, 2003; Voogt and Oke,
2003). An important factor that influences land surface temperature is seasonal change in vegetation vigour,
or how actively plants are growing (Buyantuyev and Wu, 2010; Yuan and Bauer, 2007). Under the same
weather conditions, sparse dry grass and bare ground will typically have higher surface temperatures than
green grass (Song et al., 2018). This is relevant for the Darwin region where the landscape is dominated by
tropical savanna vegetation with an open eucalypt canopy, a shrubby understorey and a grassy ground layer.
Water availability, in the contrasting monsoonal wet and dry seasons, is a critical component in this
vegetation system (DSEWPC et al., n.d.).
Actively growing green grass has different radiative properties to dry ‘cured’ grass (Buyantuyev and Wu,
2010; Yuan and Bauer, 2007). Curing is a measure of grass moisture content, or ‘greenness’, and relates to
the percentage of grass material that is dead in the sward (Johnson, 2002). Grass curing is dependent on
seasonal conditions such as rainfall and temperature, with levels increasing over the dry season (Johnson,
2002). Curing is also dependent on plant species and land type. Grasses growing on light sandy soils will dry
out and cure more rapidly than grasses growing in heavy clay. Annual grass species will dry out and die off
earlier in the dry season than most perennials. Fire hazard also increases as grasses cure and moisture
content decreases (Johnson, 2002).
Seasonal cycles in leaf fall in deciduous species also has a strong influence on land surface temperatures
(Arnfield, 2003; Voogt and Oke, 2003) and on the surface urban heat island effect (Imhoff et al., 2010; Peng
et al., 2012). In the Darwin region, the woody vegetation (trees and tall shrubs) is made up of a mix of species
from evergreen to deciduous, with intermediate forms such as semi-deciduous (trees that lose a fraction of
their leaves during the dry season) and brevideciduous (trees that shed leaves at the start of the dry season
followed by immediate leaf flush (Williams et al., 1997; Eamus, 1999). Different species lose their leaves at
different times during the dry season, with peak leaf fall in June and July, even in evergreen species, with
secondary peaks in August and September (Duff et al., 1997; Williams et al., 1997).
The remotely sensed NDVI was used to test for shifts in vegetation vigour across the seasons. The ten NDVI
images between April and August confirmed the seasonal shift in plant activity across the dry season. Two
images, one in April and one in August (Figure 3) shows this shift from ‘medium green vegetation’ to ‘sparse
green vegetation’ in the Darwin region. Note that the NDVI data displayed in Figure 3 has been grouped into
broad classes to clearly show this seasonal shift. This shift reflects the changes in grass curing and leaf fall
over the dry season, and possibly other factors such as increased burning activities which is common in
savanna woodlands in northern Australia (Williams et al., 2002).
There is a clear relationship between vegetation vigour (Figure 3) and corresponding land surface
temperatures (Figure 4) for the transition period (Apr‒May) and the dry season (Jun-Aug). In rural areas, land
surface temperatures are relatively cooler in the transition period when grasses are greener and most
deciduous trees and shrubs still have their leaves. In the dry season, grasses are ‘curing’, more bare ground
is exposed, and deciduous vegetation has lost its leaves. By contrast, coastal vegetation remains green and
relatively cooler across the seasons (Figure 4).

CSIRO Australia’s National Science Agency         Mapping land surface temperatures and heat-health vulnerability in Darwin | 11
Figure 3. NDVI for (left) 17-April-2018 and (right) 7-August-2018. The data are classed: NDVI 0.7 Dense green vegetation.

Figure 4. LST for (left) the seasonal transition period (Apr‒May) and (right) the dry season (Jun‒Aug).

CSIRO Australia’s National Science Agency            Mapping land surface temperatures and heat-health vulnerability in Darwin | 12
4.2         Greater Urban Area

4.2.1       Dry season land surface temperatures

Unless otherwise specified, results in the remainder of this report are based on the dry season land surface
temperature map which is based on Landsat 8 thermal imagery for June, July and August in 2018 and 2019
at 10:20 a.m. (see Table 1 for details). The land surface temperature map (Figure 5) shows that surface
temperatures are highest in rural areas and the central strip though Darwin’s airport and industrial areas.
The coolest temperatures are found in estuaries and vegetation around the coast. Maps, showing greater
detail are provided in Appendices for the City of Darwin (Figure 15), Central Darwin (Figure 16), and the City
of Palmerston (Figure 18).

Figure 5. Dry season LST for the Greater Urban Area based on Landsat 8 thermal imagery for Jun‒Aug in 2018‒19 at
10:20 a.m.
Boundaries: LGA, suburb and Mesh Block (ABS, 2018).

This map of land surface temperatures can be used to explore hot spots and cool spots and the urban features
that are associated with these temperatures. Hot spots and cool spots are defined as areas which consistently
demonstrate higher or lower land surface temperature, respectively, compared with their surrounding areas
(Mavrakou et al., 2018).

CSIRO Australia’s National Science Agency         Mapping land surface temperatures and heat-health vulnerability in Darwin | 13
You can also read