Mapping Phragmites cover using WorldView 2/3 and Sentinel 2 images at Lake Erie Wetlands, Canada
←
→
Page content transcription
If your browser does not render page correctly, please read the page content below
Biol Invasions
https://doi.org/10.1007/s10530-020-02432-0   (0123456789().,-volV)
                                                                 ( 01234567
                                                                         89().,-volV)

 ORIGINAL PAPER

Mapping Phragmites cover using WorldView 2/3
and Sentinel 2 images at Lake Erie Wetlands, Canada
Prabha Amali Rupasinghe            . Patricia Chow-Fraser

Received: 23 May 2020 / Accepted: 4 December 2020
Ó The Author(s), under exclusive licence to Springer Nature Switzerland AG part of Springer Nature 2021

Abstract Phragmites australis (Cav.) Trin. ex                                           C 20%; shoots C 1 m tall; stem counts [ 25) with
Steudel subspecies australis is an aggressive plant                                     accuracy [ 80%, whereas parallel effort with S2
invader in North American wetlands. Remote sensing                                      images only accurately quantified high density
provides cost-effective methods to track its spread                                     ([ 60% cover), mature shoots ([ 1 m tall; Stem
given its widespread distribution. We classified                                        counts [ 100). By simultaneously mapping young or
Phragmites in three Lake Erie wetlands (two in Long                                     sparsely distributed Phragmites shoots and dense
Point Wetland Complex (LP) and one in Rondeau Bay                                       mature stands accurately, we show our approach can
Marsh (RBM)), using commercial, high-resolution                                         be used for routine mapping and regular updating
(WorldView2/3: WV2 for RBM, WV3 for LP) and                                             purposes, especially for post-treatment effectiveness
free, moderate-resolution (Sentinel 2; S2) satellite                                    monitoring.
images. For image classification, we used mixture-
tuned match filtering (MTMF) and then either max-                                       Keywords MTMF  Phragmites  WorldView 2 and
imum likelihood (ML) or support vector machines                                         WorldView 3  Sentinel 2  Wetlands  Invasive species
(SVM) classification methods. Using WV2/3 images
with ML classification, we obtained higher overall
accuracy for both LP sites (93.1%) compared with the
RBM site (86.4%); both Phragmites users’ and                                            Introduction
producers’ accuracies were also higher for LP
(89.3% and 92.7%, respectively) compared with                                           Phragmites australis (the common reed; hereafter
RBM (84.3% and 88.4%, respectively). S2 images                                          Phragmites) is a taxonomically diverse perennial
with SVM classification provided similar overall                                        grass, with 27 genetically distinct groups throughout
accuracies for LP (74.7%) and for the RBM                                               the world, 11 of which are found in North America.
(74.3%); Phragmites users’ and producers’ accuracies                                    One of the European haplotypes, M, is an aggressive
for LP were 85.3% and 76.3%, and for the RBM,                                           invader in coastal wetlands and roadway corridors and
69.1% and 79.2%, respectively. Using WV2/3, we                                          have been growing at the expense of native vegetation
could quantify small patches (percentage cover                                          in many coastal marshes of the lower Great Lakes
                                                                                        (Saltonstall 2002). This haplotype exhibits invasive
                                                                                        characteristics, including its ability to aggressively
P. A. Rupasinghe (&)  P. Chow-Fraser
Department of Biology, McMaster University, 1280 Main
                                                                                        colonize exposed mud flats sexually (through seeds),
St. West, Hamilton, ON L8S 4K1, Canada                                                  and then expand asexually (through rhizomes) to form
e-mail: rupasinp@mcmaster.ca

                                                                                                                                    123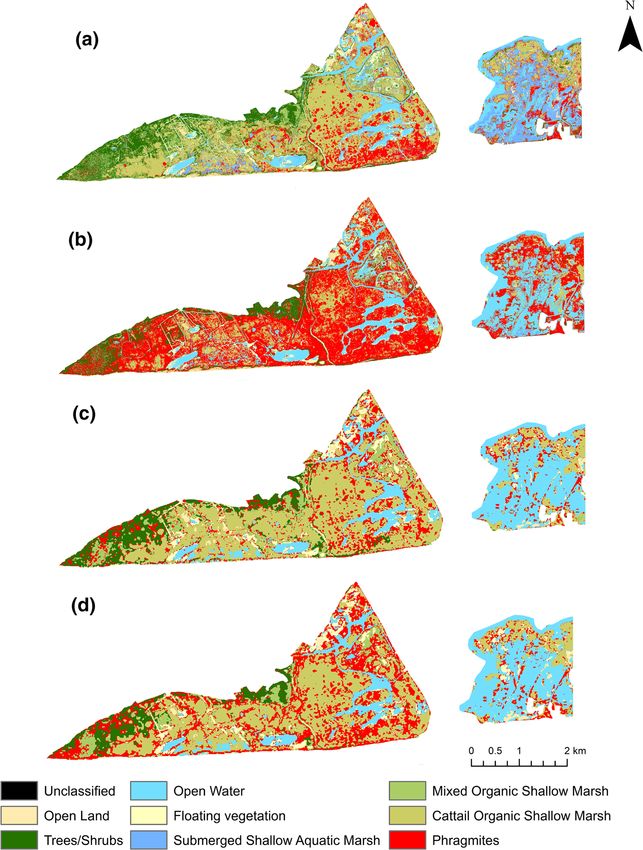
P. A. Rupasinghe, P. Chow-Fraser

dense monocultures that inhibit biodiversity of other         The distinctive growth patterns of Phragmites
plants and wildlife (Meyerson et al. 2000; Markle and      make them well suited to remote sensing approaches.
Chow-Fraser 2018). Its rapid spread has been               A number of methods have been developed to map
attributed to it being a superior competitor against       dense Phragmites with higher accuracy (i.e. [ 80%),
other emergent vegetation (Meyerson et al. 2000;           involving satellite images of moderate 30-m Landsat
Uddin et al. 2014) and to being more tolerant of           and 10-m and 20-m Sentinel 2 (Rupasinghe and
disturbances (e.g. road maintenance and changes in         Chow-Fraser 2019), and emergent vegetation with
hydrologic regimes) and environmental stressors (e.g.      10-m and 20-m SPOT; 4-m IKONOS (Rutchey and
increased salinity due to road de-icing salts) (McNabb     Vilchek 1999; Sawaya et al. 2003; Phillips et al. 2005).
and Batterson 1991; Marks et al. 1994; Chambers et al.     Other methods are available that employ more
1999; Brisson et al. 2010; Taddeo and Blois 2012;          expensive high resolution hyperspectral images
Rodrı́guez and Brisson 2015). Once established, this       acquired by commercial sensors such as AVIRIS,
aggressive invader has been known to reduce wetland        CASI, HyMap, and PROBE-1 (Schmidt and Skidmore
plant diversity and alter vegetation structure (Ailstock   2001; Bachmann et al. 2002; Williams and Hunt 2002;
et al. 2001; Mal and Narine 2004; Lambert et al. 2010;     Lopez et al. 2004), that could be used for mapping
Gilbert et al. 2014), habitat for wetland fauna (Wein-     low-density stands. For mapping invasive species,
stein and Balletto 1999; Bolton and Brooks 2010;           multispectral images have advantages over hyper-
Gilbert et al. 2014; Cook et al. 2018; Markle and          spectral images because of their overall lower cost
Chow-Fraser 2018), and modify hydrology and soil           (some available at no cost or reduced cost), higher
properties (Chambers et al. 1999; Bolton and Brooks        spatial coverage, and shorter durations between
2010), thus having an overall negative impact on           acquisitions that facilitate repeated mapping of the
ecosystem functions.                                       entire wetland for assessing treatment efficacy at the
   Optimal conditions for the growth of Phragmites         ecosystem scale. The main disadvantage, however, is
are provided by water bodies with seasonal fluctua-        that multispectral images produce lower accuracy
tions of 30 cm (Deegan et al. 2007). New shoots of         compared with hyperspectral images, especially at
Phragmites arise in the spring and may grow up to          early stages of invasion when plant densities are low
3–4 m tall during the summer, producing large              (Adam et al. 2010).
inflorescences giving rise to thousands of seeds              Selection of hyperspectral or multispectral images
towards the late summer and early fall (Burgess and        and choosing the best classification algorithm is
Evans 1989; Gilbert et al. 2014; Gagnon Lupien et al.      essential for accurate species-level mapping. Camp-
2015). According to Albert et al. (2015), both seeds       bell (2002) described two categories of classification
and vegetative propagation contribute to the new           algorithms that can be used in supervised classification
Phragmites establishment; however, 84% of the newly        methods: (a) distance based or hard classifiers and
established Phragmites stands are formed through           (b) unmixing based or soft classifiers. In hard classi-
seed germination. Lathrop et al. (2003) have reported      fiers, the distance from a known reflectance value is
three patterns of Phragmites growth in brackish tidal      used to determine the match between an unknown
marshes at eastern USA: (a) colonization or new            pixel. Maximum likelihood classification (ML), spec-
growth, (b) linear clonal growth along an axis, and        tral angle mapper (SAM), and minimum distance
(c) circular clonal patches (non-directional) with         classification are some of the examples for hard
random spread. New Phragmites stands are charac-           classifiers and they act as ‘first look’ tools to identify
terized by low-density short shoots with a few small       the presence of target species in the study area
leaves. Phragmites grown in deep water also produce        (Campbell 2002). The soft classifiers such as linear
lower number of shoots and shorter rhizomes, thus          spectral unmixing (LSU), mixture tuned match filter-
limiting its vegetative expansion (Weisner and Strand      ing (MTMF), and Bayesian probability use relative
1996; Vretare et al. 2001). Linear Phragmites stands       abundance of land cover classes within a pixel. In
are mostly observed along the roadside in linear           these techniques, mixed pixels that contain several
wetland corridors and along shores of water ways,          landcover classes are decomposed into its original
while circular growths are mostly observed in wet-         constituents, to develop a set of output images rather
lands with ideal growth conditions.

123
Mapping Phragmites cover using WorldView 2/3 and Sentinel 2 images
than a single classified image as in hard classifiers pixel image classification methods to determine the
(Lass et al. 2005; Williams and Hunt 2004, 2002). relative usefulness of these image products for map-
Despite the expansion of Phragmites in many Lake ping the distribution of Phragmites in three Lake Erie
Ontario and Erie coastal marshes in the late 1990s marshes that had been colonized since the late 1990s
(Wilcox et al. 2003), control programs were not (Wilcox et al. 2003). At the time of image acquisition,
implemented in Ontario until 2007 (Bourgeau-Chavez the patterns of Phragmites distribution varied across
et al. 2015; Gilbert 2015). Non-chemical control the three sites. One wetland had low-density stands of
methods such as cutting, drowning, smothering, young shoots a year following herbicide treatment,
covering, excavating, plowing, grazing, and burning whereas another had large, dense mature Phragmites
have been tested in Ontario with varying success stands that had not yet been chemically treated, and a
(Gilbert et al. 2014). In some instances, mechanical third had a mixture of both chemically treated and
control cannot be implemented in natural ecosystems untreated areas. Our goal is to experiment with sub-
when the invaded area is large and inaccessible by pixel techniques used previously, mostly with hyper-
either boat or road. In these instances, aerial applica- spectral images, and apply them to multispectral
tion of either glyphosate or imazapyr has been used images to obtain accuracies [ 80% for all Phragmites
(Avers et al. 2007; Derr 2008; Gilbert et al. 2014; density classes across the three Lake Erie wetlands.
Gilbert 2015). Although glyphosate had been used
widely within the United States to control the growth
of invasive Phragmites (Gilbert 2015), its use in Methods
Ontario has been prohibited except by Emergency Use
Registration, which requires first, an accurate map of Study sites
Phragmites in the wetland to spray only the target area
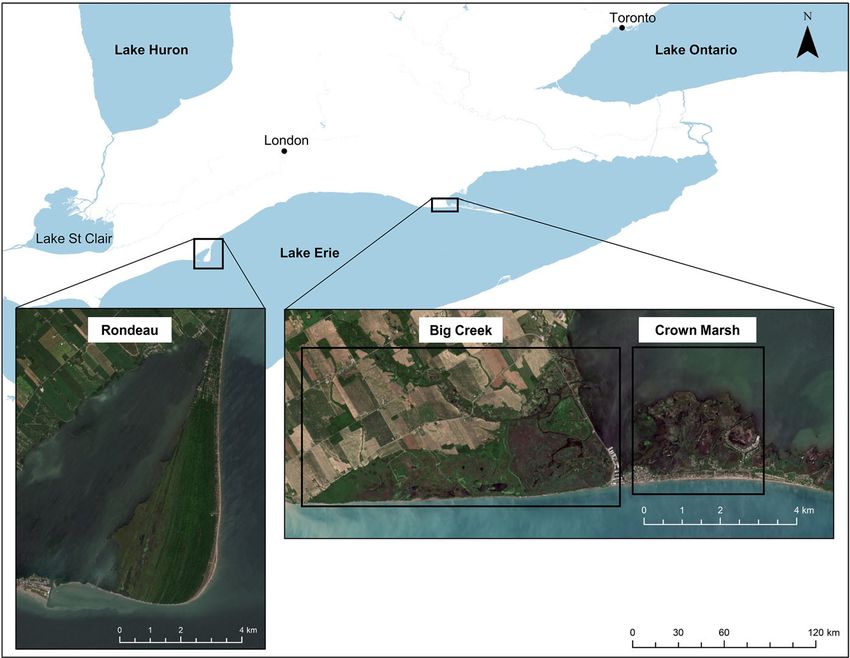
during aerial herbicide application and to avoid Two of the three Lake Erie wetlands, Big Creek
spraying on native vegetation and secondly, an National Wildlife Area (BCNWA; 42° 350 N 80° 270
accurate monitoring program to quantify the efficacy W) and Crown Marsh (CM; 42° 350 N 80° 240 W)
of the treatment program since complete removal of occur in Long Point (LP) Wetland Complex, which is
Phragmites in an area requires repeated applications internationally recognized as an UNESCO World
over several years (Gilbert et al. 2014; Rupasinghe Biosphere Reserve and under the Ramsar Convention
et al. 2017). as an internationally important wetland (Ministry of
To meet treatment protocols such as Ontario’s Natural Resources and Forestry 2019) (Fig. 1).
Emergency Use Registration requirements, managers BCNWA covers an area of 771 ha and consist of the
must obtain high mapping accuracies for both the Big Creek unit (615 ha) and the Hahn Marsh Unit
expansive mature stands of Phragmites (i.e. untreated) (156 ha). It is federally owned and managed by the
as well as the small, young, sparsely distributed shoots Environment and Climate Change Canada. CM is
(i.e. when they regenerate following treatment). Such about 2 km East to the BCNWA and covers approx-
mapping would require a remote-sensing approach imately 708.2 ha. It is owned by the Province of
that is cost-effective, repeatable, and produce results Ontario and is normally accessible to the public
that maximize both producers’ (mapping accuracy on throughout the year. These wetlands are characterised
the map makers’ or the producers’ perspective, by emergent aquatic vegetation, mainly Cattail (Typha
complements the level of omission error or the false sp.), Phragmites, and Bulrushes (Juncus sp.) (Long
negatives) and users’ (mapping accuracy on the map Point Crown Marsh Rehabilitation Steering Commit-
users’ perspective, complements the level of commis- tee 2007) and meadow marsh dominated by Calam-
sion error or the false positives) accuracies, since both agrostis canadensis (Yuckin and Rooney 2019). The
false negatives and false positives are unacceptable at third wetland, Rondeau Bay Marsh (RBM; 42° 170 N
high levels. In this study, we compare classification 81° 520 W), is managed by the province of Ontario,
accuracies associated with two multispectral products and is located further west on the north shore of Lake
(commercially available, high resolution WorldView Erie, covering an area of 1800 ha (Fig. 1). RBM is
2/WorldView3 (WV 2/3) and the freely available, characterized by Carolinian forests, sandy peninsula,
moderate resolution Sentinel 2 (S2) images) using sub- and marsh (Mann and Nelson 1980). The drier parts of
123P. A. Rupasinghe, P. Chow-Fraser
Fig. 1 Map of the study sites located in the north shore of Lake Erie
the marsh are dominated by Cephalanthus occiden- resolution) and eight multispectral bands (1.2 m
talis, Salix, and Cornus spp. Other than Phragmites, spatial resolution), including the coastal blue
the emergent plants included monocultures of Typha (397–454 m), blue (445–517 nm), green
latifolia, T. angustifolia, T. x glauca and Zizania (507–586 nm), yellow (580–629 nm), red
aquatica and the marshes with deeper standing water (626–696 nm), red edge (698–749 nm), Near Infra-
was dominated by aquatic species of Cyperaceae, Red 1 (NIR 1; 765–899 nm) and NIR 2
Nuphar advena, and Nymphaea odorata (Finkelstein (857–1039 nm) bands. For the WV2 images, the
and Davis 2006). panchromatic band is 40 cm spatial resolution
(464–801 nm) with 8 multispectral bands (1.8 m
Remote sensing data spatial resolution); coastal blue (401–453 m), blue
(447–508 nm), green (511–581 nm), yellow
WV, which is operated by DigitalGlobe, is a fourth- (588–629 nm), red (629–689 nm), red edge
generation, optical and commercial earth-observation (704–744 nm), NIR 1 (772–890 nm) and NIR 2
satellite series, with the highest spatial resolution (862–954 nm) (Nikolakopoulos and Oikonomidis
(30 cm for WV3 and 40 cm for WV2) of all existing 2015).
optical satellites available for research (Kurihara et al. S2 is a satellite owned by the European Space
2018). WV3 has revisit frequency less than 1 day at Agency (ESA), designed for studies based on terres-
40°N latitude and 4.5 days at 20° off-nadir or less trial observations. It consists of two satellites, Sen-
while for WV2, revisit frequency is 1.1 days and tinel-2A (launched in 2015) and Sentinel-2B
3.7 days at 20° off-nadir (Satellite Image Corporation (launched in 2017). S2 provide revisit time of 5 days
2017). A cloud-free WV3 image was acquired on 4th at the equator (European Space Agency 2020). The
July 2018 for BCNWA and CM sites and WV2 image images for BCNWA and CM sites were acquired on
was acquired on 5th September 2018 for RBM site. 6th July 2018 and for RBM site on 28th August 2018.
WV3 images consist of one panchromatic band S2 images consist of four 10-m resolution bands
(445–808 nm spectral resolution and 30 cm spatial (Blue; 490 nm, Green; 560 nm, Red; 665 nm, and
123Mapping Phragmites cover using WorldView 2/3 and Sentinel 2 images
NIR; 842 nm), six 20-m resolution bands (Vegetation quadrats and counted the number of dead and live
red edge; 705 nm, 74 nm, 783 nm, Narrow NIR; Phragmites stems and Cattail stems within the quadrat
865 nm, Short Wave InfraRed 1 (SWIR 1); 1610 nm, and recorded the dominant species and landcover
SWIR 2; 2190 nm), and three 60-m resolution bands types within the quadrat. Of these 841 quadrats, 313
(Coastal aerosols; 443 nm, Water vapor; 945 nm, and contained Phragmites. In addition to the field data, we
SWIR Cirrus; 1375 nm). used locations from manual interpretation of pan-
sharpened WV2 image (40 cm spatial resolution,
Ground truth data same image used for the image classification) and
obtained 10 locations where Phragmites had been
We conducted field sampling in the summers of 2018 treated in 2018 (data provided by Ontario Parks).
and 2019 at the BCNWA and CM to record locations
of Phragmites as ground truth data. In the field, we Remote sensing data processing
established 1.5 9 1.5 m quadrats in the Phragmites
patches and visually recorded percentage cover of We conducted all image pre-processing and process-
Phragmites. Then we cut all the standing Phragmites ing with the software ENVI 5.5 (L3Harris Geospatial
stems within the quadrat and weighed them using a 2020). We performed radiometric correction and
Xcalibur Spring Scale. Stand height of Phragmites atmospheric correction (ENVI FLAASH correction)
was estimated by cutting down the tallest shoot at its to obtain surface reflectance values for both WV2/3
base, laying it on the ground, and measuring them with and S2 images. Reflectance values were rescaled from
a tape measure (to the nearest cm). We recorded the 0 to 1 after FLAASH correction. For S2 images, we
coordinates of the quadrats using Garmin eTrex separately preprocessed the 20-m resolution bands,
handheld GPS (Garmin and subsidiaries). In total for resampled them to 10-m resolution and stacked them
both years, we collected Phragmites information from with the preprocessed 10-m bands prior to image
58 quadrats in BCNWA and 89 quadrats in CM. In analysis.
addition to field sampling, we used high-resolution We performed sub-pixel image classification using
image interpretation to identify land-cover classes on spectral mixture analysis to detect Phragmites. In the
inaccessible areas. We used the sensefly eBee (Parrot, spectral mixture analysis, it is assumed that the mixed
Cheseaux-Lausanne, Switzerland (SenseFly 2020a), pixel spectrum is a linear combination of the spectral
equipped with the Parrot Sequoia ? camera (Sense- signatures of the component classes of the pixel
Fly 2020b) to acquire Unmanned Aerial Vehicle (Adams et al. 1985). Mixture tuned match filtering
(UAV; 13 cm resolution) images in July 2019. We (MTMF) is a method used in spectral mixture analysis
used this high-resolution UAV image and the pan- which performs partial spectral unmixing (Boardman
sharpened WV3 image (30 cm spatial resolution; et al. 1995). In this technique, only the pure spectral
same image used in image classification) to collect signature (endmember) of the target landcover class
ground reference for land-cover classes for both needs to be defined. The image is then filtered for the
classification and accuracy assessment for areas with defined endmember spectrum and the unknown back-
limited access. We identified these classes through ground spectra are supressed (Boardman 1998; Board-
both knowledge in the field and visual comparison of man and Kruse 2011; Brelsford and Shepherd 2013).
manually digitized UAV image acquired in late The three steps in MTMF includes: (a) minimum noise
summer 2015 (Marcaccio et al. 2016). In addition, fraction (MNF) transformation to minimize and
we also used 15 Phragmites treatment locations decorrelate noise, (b) match filtering (MF) to estimate
corresponding to a spraying program conducted the abundance of the target class, and (c) mixture
between September and October in 2018 by Nature tuning (MT) to separate false positives from the MF
Conservancy Canada (NCC) to validate the image step (Boardman 1998; Boardman and Kruse 2011).
classification. The MTMF produces two outputs at the end of the
Field data used as ground reference for RBM were analysis, the MF score image, and the infeasibility
collected by Angoh et al., (841 quadrats; unpublished image. The MF score represents the relative abun-
data) as part of their study to examine the effect of dance of the target class within a pixel. It ranges from 0
Phragmites on turtle habitats. They used 2 9 2 m to 1 where a score of 1 represents a perfect match
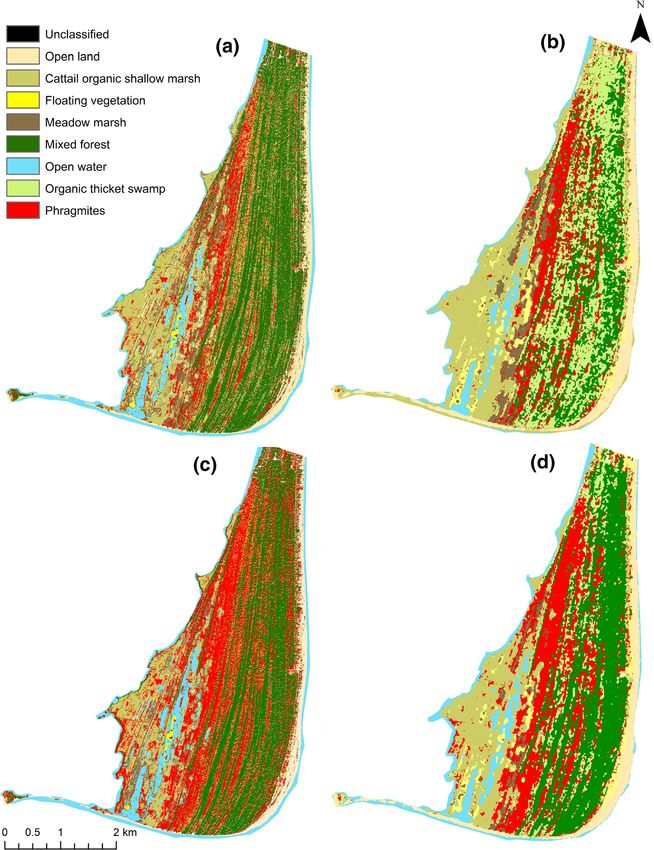
123P. A. Rupasinghe, P. Chow-Fraser between the end member and the sub-pixel abundance sites), we calculated percent cover and analyzed the or 100% of the target class within the pixel. The height and weight data separately for the two sites. For infeasibility scores are in noise sigma units and the RBM site, we sorted the live stem counts per provide the feasibility of the MF results (Harris quadrat into six categories (0, 1–25, 25–50, 50–75, Geospatial Solutions, Inc 2020). 75–100, and [ 100), before calculating mapping First, we performed minimum noise fraction accuracies. (MNF) transformation for both pre-processed WV2/ We used Fragstats 4.2 to extract patch area, largest 3 and S2 images to reduce image dimensionality. After patch index (LPI), and radius of gyration of each patch the MNF transformation, we performed the MTMF for the three sites separately using the maps with followed by image classification. We evaluated the highest classification accuracy. We analysed the data eigen value plots and the classification results with using the JMP 15 software and created plots in MS various combinations of MNF bands and based on Excel and in JMP. these results, chose the first four or five bands for further analysis (additional MNF bands added unwanted noise to the classification). For the MTMF, Results we extracted spectral endmembers using the field observations. Again, we repeated the classification Phragmites and wetland land cover mapping with Phragmites endmember alone and with different combinations of endmembers of the other classes and After analyzing different endmember combinations, checked for accuracy. Then we selected the endmem- we obtained the highest classification accuracy with ber combination that provided the highest classifica- the combination that included Phragmites, trees/ tion accuracy. shrubs (mixed forest for RBM site), and open land. After the MTMF transformation, we classified the Accuracy obtained for this combination was higher images using both maximum likelihood (ML) and than that for the Phragmites endmember alone. support vector machines (SVM) classification meth- Therefore, we used this combination of classes for ods. We applied 5 9 5 majority filter for all classes the rest of the study (i.e. all combinations of sites and except for Phragmites and then compared the results. sensors). For image classification and endmember extraction, For the BCNWA and CM sites, we classified the we used Phragmites locations collected in the field in image into eight land cover classes; Phragmites, addition to locations obtained from the image inter- Cattail organic shallow marsh, mixed organic shallow pretation (73 locations for the LP and 38 locations for marsh, trees/shrubs, open land, open water, submerged the RBM); we used all Phragmites quadrat data shallow aquatic shallow marsh, and floating vegeta- collected in the field and the Phragmites treatment tion (Fig. 2). We classified the RBM site also into locations for accuracy assessment (162 locations for eight classes: Phragmites, Cattail organic shallow the LP and 323 locations for the RBM). Therefore, marsh, floating vegetation, meadow marsh, mixed there was no overlap between classification and forest, open land, open water, and organic thicket accuracy assessment locations. swamp (Fig. 3). The overall, user’s and producer’s After image classification, we imported landcover accuracies were higher for WV2/3 than for S2, maps that provided the highest mapping accuracy into regardless of classification method (Table 1). For ArcMap 10.4.1 and evaluated the mapping accuracy of WV2/3 images only, ML classification produced Phragmites cover, stem count, height, and weight higher classification accuracy than did SVM. The using the quadrat data collected during field work. To SVM classification resulted in high commission error enable analyses, we divided percentage cover data into of Phragmites for both LP and RBM sites (Table 1; five equal intervals (i.e. 20% increments). Height Figs. 2, 3). By comparison, SVM produced higher information were sorted into four categories (\ 1 m, accuracy than did ML classification for S2 images. 1–2 m, 2–3 m, and [ 3 m) as were weight data Based on these results, we used the ML classification (0–2 kg, 2–4 kg, 4–6 kg, and [ 6 kg). Although we for the WV2/3 images and SVM classification for the performed image classification of BCNWA and CM S2 images in Phragmites cover, stem count, height, together (i.e. a single image was acquired for both and weight analysis. 123
Mapping Phragmites cover using WorldView 2/3 and Sentinel 2 images

Fig. 2 Classified images of BCNWA and CM sites with a WV3 images-ML classification, b WV3 images-SVM classification, c S2
images-ML classification and d S2 images-SVM classification

Phragmites percentage cover and stem count                     were generally associated with comparatively low
analysis                                                       accuracies (Table 1), with no significant positive
                                                               correlation between MF scores and percentage cover
The MF score of Phragmites increased with percent-             or stem counts (Figs. 4, 5). Despite the statistical
age cover and stem count (Figs. 4, 5); however,                significance, the regression coefficient between the
whereas significant positive regressions between MF            MF score and percentage cover of Phragmites was
score and percentage cover were found for all WV2/3            relatively low (Fig. 4). This is due to the spectral
images, only the S2 image for BC was associated with           similarities between Phragmites and other vegetation
a significant regression. Classification of S2 images          classes. We observed lower MF scores for some

                                                                                                              123
P. A. Rupasinghe, P. Chow-Fraser Fig. 3 Classified images of RBM site with a WV2 images-ML classification, b S2 images-ML classification, c WV2 images-SVM classification and d S2 images-SVM classification locations with 100% Phragmites cover (as reported in dead stems in majority of the quadrats at the RBM site the field) because the actual image pixels could be and other reflectance signals associated with non- mixed with different reflectance signals such as Phragmites vegetation may explain the low range of shadows cast by Phragmites itself or by adjacent MF scores. taller vegetation, non-leaf reflectance from large Although accuracies for the five density categories inflorescences, dried leaves and stalks, glare from varied for the two LP sites, some generalizations can open water etc. We observed a similar trend with the be made. First, regardless of the site, we obtained stem count data for the RBM site, in which the higher accuracies with the WV3 image (Fig. 6a, b) regression coefficient between MF score and the live than with the S2 image (Fig. 6c, d). Secondly, in all stem count of Phragmites was very low (Fig. 5). The cases, the lowest density category (\ 20% cover) 123
Mapping Phragmites cover using WorldView 2/3 and Sentinel 2 images

Table 1 Overall,               Site                Classification accuracy                 WV3                 S2
Phragmites users’ and
producers’ accuracy for                                                                    SVM      ML         SVM      ML
different combinations of
WV2/3 and S2 images and        BCNWA and CM        Overall accuracy %                      69.75    93.08      74.68    72.15
SVM and ML classification                          Kappa                                   0.6162   0.9062     0.6832    0.6467
methods                                            Phragmites Producers’ accuracy %        95.07    92.72      76.32    79.82
                                                   Phragmites Users’ accuracy %            41.77    89.29      85.29    79.13
                               Site      Classification accuracy                  WV2                        S2
                                                                                  SVM          ML            SVM        ML

                               RBM       Overall accuracy %                       75.77        86.37         74.25      70.86
                                         Kappa                                    0.6869       0.8220        0.6927      0.6503
                                         Phragmites Producers’ accuracy %         95.14        88.43         79.17      48.57
                                         Phragmites Users’ accuracy %             61.94        84.29         69.09      70.15

Fig. 4 Linear regression
plots of MF scores versus
Phragmites percent cover
associated with WV3
images for a BCNWA and
b CM sites; corresponding
regression plots associated
with S2 images for
c BCNWA and d CM sites

failed to meet the threshold accuracy of 80% (Fig. 6).             Phragmites and Cattail and in a few cases, between a
For BCNWA, four of the remaining density categories                patch of high-density Phragmites and trees/shrubs. For
achieved acceptable accuracies with the WV3 image                  CM, acceptable accuracies were only achieved with
compared with three with the S2 image (Fig. 6a vs. c).             the WV3 image in the two highest density categories,
Inaccurate classifications for the highest density                 whereas all accuracies were \ 80% with the S2 image
(80–100% cover) were caused by confusion between                   (Fig. 6b vs. d).

                                                                                                                       123
P. A. Rupasinghe, P. Chow-Fraser
tall at the BCNWA site (Fig. 8a). By contrast, the
highest accuracy (86.7%) for the S2 image was
obtained for the 1–2 m category, while plants shorter
than 1 m, taller than 3 m, and between 2–3 m were
associated with much lower accuracies of 62.5%,
71.4% and 82.1%, respectively (Fig. 8b). We did not
have any quadrat data over 3 m height category for the
CM site. We obtained 100% accuracy for the height
category of 2–3 m and very low accuracy for 0–1 m
height category (7.7%; Fig. 8e). We obtained a similar
trend with the S2 images, where highest accuracy was
obtained for the intermediate category (2–3 m;
85.7%), and lowest accuracy was obtained for
quadrats with plant heights \ 1 m (7.7%; Fig. 8f).
Based on the results, accuracy for both WV3 and S2
images generally improved with increasing plant
height.
We also compared accuracies between WV3 and S2
for classifying Phragmites weights in the two LP sites.
For BCNWA, accuracies for all four weight categories
met the target of 80% when WV3 image was used
(Fig. 8c), whereas only two categories met this target
when the S2 image was used (Fig. 8d). For CM,
accuracies for only three of the weight categories
were [ 80% when WV3 image was used (Fig. 8g),
Fig. 5 Linear regression plots of MF scores versus Phragmites
stem counts obtained with a WV2 and b S2 images for the RBM whereas none of the categories had acceptable accura-
site cies when the S2 image was used (Fig. 8h). Therefore,
in general, accuracies were much better for the WV3
For the RBM site, we had stem counts instead of than the S2 image.
percentage cover data. The WV2 image yielded [
80% accuracies for quadrats with greater than 25 Phragmites patch characteristics
Phragmites stems (Fig. 7). An accuracy of 93.3% was
obtained for quadrats with over 100 live Phragmites We studied the patch characteristics using the maps
stems, and 53.4% for the lowest category with fewer produced using the WV2/3 images as it provided the
than 25 live stems. For quadrats containing non-living highest mapping accuracy. The patch sizes of Phrag-
Phragmites stems, we obtained an accuracy of 50.0%. mites in this study ranged from very small (2 m2) to
For S2 images, accuracy for the highest count category extremely large (40 ha) patches. The two largest
([ 100 live stem) was only 73.3% (4 of 15 quadrats patches were found in RBM (40.33 ha) and in
had been misclassified), and accuracies for all other BCNWA (26.89 ha). By far, however, the majority
categories were lower than 65%. ([ 80% of the 58,081 patches) of these Phragmites
We observed a significant positive correlation patches were \ 100 m2 at the BCNWA site. In
between percentage cover of Phragmites and live comparison, 70% of 17,889 Phragmites stands in
stem weight and height for both BCNWA (r = 0.58 CM and 50% of the 50,191 stands in RBM had an
and r = 0.71 respectively) and CM (r = 0.84 and area \ 100 m2. The radius of gyration, which is a
r = 0.79 respectively) sites. Therefore, we analysed measure of the spatial extent of a habitat patch
the classification accuracy of Phragmites sorted by (defined as a mean distance between each cell in the
weight and height. With the WV3 images, we patch and the patch’s centroid) differed significantly
found [ 80% accuracy for all height categories over among the three sites. RBM, with the greatest total
1 m. We obtained accuracy of 75.0% for plants \ 1 m area occupied by Phragmites, also had the highest
123Mapping Phragmites cover using WorldView 2/3 and Sentinel 2 images
Fig. 6 Comparison of mapping accuracies for Phragmites in five density categories for BCNWA (solid bars) and CM (stippled bars)
using ML classification with WV3 (top panels) and SVM classification with S2 images (bottom panels)
radius of gyration (Fig. 9a, b). The calculated geo- distributions so that the protocol can be repeated
metric mean patch size of Phragmites in both LP across many different wetlands by environmental
wetlands was \ 5 m2 while that in RBM was more agencies. Our goal was to obtain accurate maps of both
than double ([ 10 m2; Fig. 9c). When we compared low density or young Phragmites stands as well as
the LPI for the three sites, CM, BCNWA, and RBM expansive, large stands so that the same protocol can
sites have 0.8%, 2.2%, and 2.5% respectively. Overall, be used for initial assessment as well as effectiveness
these results indicate that the RBM site had compar- monitoring. We found that the best combination at no-
atively larger Phragmites patches, and fewer small- cost involves the use of S2 images and SVM
sized stands compared with the LP sites. classification while the best combination with highest
mapping accuracy involves the commercially avail-
Discussion able WV2/3 images and use of ML classification.
In all respects, classification of WV2/3 images
Our study is the first to use subpixel image classifi- produced higher overall and Phragmites accuracies
cation using MTMF with multispectral satellite than did classification of S2 images. This difference in
images to map Phragmites, and we have been able performance is directly related to the higher spatial
to achieve up to 90% accuracy across landscapes resolution of WV2/3 (1.8 m and 1.2 m) compared
containing patches that range from very large size of with S2 (10 m and 20 m) which results in higher
40 ha to very small sparse stands of 2 m2. We spectral mixing in the latter. When we compared the
achieved higher classification accuracy by using two sites, RBM had slightly lower accuracy than did
spectral endmembers that were defined for trees/ LP sites, and this difference also may have been due to
shrubs and open land in addition to Phragmites instead slightly lower spatial resolution of WV2 compared
of Phragmites endmember alone. We focused on with WV3. Spectral resolution may also have affected
developing simple, cost-effective methods that could the results since we used 8 bands of WV2/3 (from 400
be used in sites with a range of patch sizes and to 1040 nm wavelength) compared with 10 bands of
123P. A. Rupasinghe, P. Chow-Fraser
at LP sites consisted of mixed plant species such as
grasses, sedges, emergent shrubs, and upland plant
species and can be highly confused with Phragmites
when mapped with satellite images (Rupasinghe and
Chow-Fraser 2019). The meadow marsh class was
mostly confused with young and lower density
Phragmites patches due to spectral similarities. There-
fore, we excluded meadow marsh from the final
classification of the LP sites because our main target
was to improve Phragmites producers’ and users’
accuracies. Due to this modification, vegetation in the
meadow marsh habitat was incorrectly classified as
Cattail or mixed organic shallow marsh, but only
infrequently as young, low density Phragmites. As our
intention was to map low density Phragmites as
accurately as possible for management purposes,
missing meadow marsh was not considered a signif-
icant problem. This confusion, however, was not
observed at the RBM site mainly because the Phrag-
mites stands at RBM are large and dense and therefore
not easily confused with spectral characteristics of
meadow marsh.
We also observed misclassifications between
Phragmites and trees/shrubs in some locations. This
occurred in some extremely dense Phragmites
Fig. 7 Mapping accuracies of live Phragmites in six stem count patches. Confusion of Phragmites with open water
categories for the RBM site using a WV2 image-ML
classification and b S2 image-SVM classification
occurred in areas where Phragmites was beginning to
colonize in shallow water and had low plant density.
S2 (from 490 to 2190 nm wavelength). Although S2 Spectral reflectance of sunlight by water can also
images have a greater number of bands covering a interfere with the signal produced by Phragmites and
larger wavelength region, the spatial resolution lead to misclassifications. Finally, we were able to
appeared to have considerably reduced the accuracy improve the accuracy of the classification by removing
of image classification. or masking out ecologically irrelevant classes such as
We observed some classification confusion of built-up areas, roads, and agricultural fields. This is
Phragmites with Cattail, open water, and trees/shrubs. because the bright signals of these classes often
In our study sites, Cattail is most similar to Phragmites interfered with vegetation classes, especially when the
in terms of being tall, unbranched, and forming dense glare from water caused misclassifications and
monospecific stands, with somewhat similar leaf reduced the overall accuracy.
arrangement when compared to other vegetation We were relatively successful in classifying Phrag-
classes. Given that they have similar habitat require- mites stands according to height and weight. When
ments, they are often found in mixed stands, and these Phragmites stands are dense, they produced purer
morphological similarities may have resulted in sim- reflectance signals that were not mixed with those of
ilar reflectance signals that resulted in classification other classes. Mature Phragmites can grow up to
confusions between Phragmites and Cattail (Rupas- 3–4 m high and reach densities of 200 live and 300 dry
inghe and Chow-Fraser 2019). Initially, we included stands per square meter under optimal conditions
meadow marsh in our classification for the LP sites as (Hara et al. 1993; Poulin et al. 2010). Optimal
this is an important wetland category, but this conditions for Phragmites are freshwater bodies with
increased Phragmites omission error. Meadow marsh seasonal fluctuations of 30 cm (Deegan et al. 2007)
and all our study sites provide these ideal conditions
123Mapping Phragmites cover using WorldView 2/3 and Sentinel 2 images
Fig. 8 Mapping accuracies of height and weight of Phragmites for BCNWA (solid bars) and CM (stippled bars) using WV3 (all left
panels) and S2 (all right panels). (Note: no data for [ 3 m height category in CM site)
for Phragmites colonization. According to Hara et al. level fluctuations. We obtained acceptable accuracy
(1993), Phragmites does not increase shoot diameter, for even the lowest height and weight category with
and increase in shoot weight is parallel to increase in the WV3 images. Our study confirms that WV2/3
shoot height. At younger stages, Phragmites shoots could be effectively used for mapping even young or
use carbohydrates from the rhizomes, accumulated smaller Phragmites stands; however, S2 could only be
during the previous growing season. Therefore, used to map older, denser, or larger Phragmites stands
younger shoots are smaller and have fewer number with less spectral mixing.
of small leaves (Hara et al. 1993). Furthermore, Timing of image acquisition and plant phenology
density and height of Phragmites stands could also be are important considerations in Phragmites mapping
affected by environmental conditions such as water (Rupasinghe and Chow-Fraser 2019). Phragmites
123P. A. Rupasinghe, P. Chow-Fraser
variation in mapping accuracies among the three sites
to differences in treatment history along with amount
of field data, and the timing of image acquisition.
Since the entire CM had been treated in the fall of 2017
and the image was acquired in July the following year,
there were no mature stands but many small stands that
had either escaped treatment or had recently regener-
ated. Therefore, there was interference from water
reflectance in many inundated areas that were absent
in the other two sites. By comparison, mature stands in
the diked area of BCNWA could be mapped accu-
rately because they were large and dense and had not
yet been treated at the time of image acquisition. We
had relatively few RBM data to train and validate the
classification of small sparse stands of common reed,
whereas such data had been specifically collected in
CM and BCWNA, and this may also explain differ-
ences in mapping accuracies. According to Rupas-
inghe and Chow-Fraser (2019), images acquired in
July and early August was best for minimizing
confusion between Phragmites and Typha and were
associated with highest accuracies for Phragmites.
Therefore, all else being equal, the July image for LP
could explain the better performance than the Septem-
ber image for RBM.
Fig. 9 Comparison of a mean Radius of Gyration, b mean total
area occupied by Phragmites and c geometric mean size of
Phragmites stands in the three wetlands in this study. Data were
calculated from classification of WV2/3 images with the ML Conclusion
classification
Tracking Phragmites distribution, determining the
produce the most unique, detectable signal that can be borders of the patches, and estimating the extent of
separated from other vegetation classes (especially invaded area are common objectives of invasive plant
Cattail and meadow marsh) during the peak summer management programs. The conventional approach is
period. The distinct inflorescence, the unique green to map the distribution using field surveys, which are
color due to the high chlorophyll concentration, the extremely labour intensive, and which may produce
leaf arrangement, and the high water-use efficiency of results that are biased against smaller and mixed
Phragmites during this period all could be combined Phragmites stands depending on the thoroughness of
to produce this unique spectral signature. Use of the observer. Mapping approaches with remote sens-
images collected in late summer is also beneficial as ing technology can overcome these challenges by
the Phragmites treatment is usually conducted in providing comprehensive coverage of both small and
September to October and this provides most up-to- large study areas, even if they are difficult to access by
date map. Use of Short-Wave IR bands may also boat or by road. Accurate distribution of relatively
improve the classification accuracy (Rupasinghe and small Phragmites stands are difficult to obtain, but
Chow-Fraser 2019). One obvious limitation of WV2/3 they are very valuable to managers because both
is the potentially high cost of acquiring images to map mechanical and chemical treatment are most effective
large invasion areas. when populations are small and sparsely distributed.
We have shown that besides differences in resolu- Using commercially purchased high-resolution satel-
tion of satellite images, we can attribute some of the lite images, we were able to map younger, less dense,
or smaller Phragmites stands as well as the mature,
123Mapping Phragmites cover using WorldView 2/3 and Sentinel 2 images
dense, and larger Phragmites stands with overall Code availability No custom codes are developed during the
accuracy greater than 80%. By comparison, satellite study. All image processing and analysis were conducted using
pre-built tools in number of software; ENVI 5.5, ArcMap 10.4.1,
images from S2 that are available at no cost could be Fragstats 4.2, JMP 15, and MS Excel. Please refer to the
used to accurately map large, high density Phragmites methods section for further details.
stands, but this approach is only useful when general
estimation of Phragmites cover is required over large Compliance with ethical standards
spatial extents. The mapping accuracy is dependent on Conflict of interest The authors declare that they have no
the Phragmites patch characteristics, other wetland conflict of interest.
plant species, and the site conditions. We recommend
masking out ecologically irrelevant or adjacent land-
cover classes (e.g. agricultural lands, roads, and References
buildings) to reduce classification errors and compu-
tational time. Use of spectral unmixing of WV2/3 is a Adam E, Mutanga O, Rugege D (2010) Multispectral and
promising method for detection of Phragmites in hyperspectral remote sensing for identification and map-
ping of wetland vegetation: a review. Wetl Ecol Manag
wetlands, especially for detecting new Phragmites 18:281–296. https://doi.org/10.1007/s11273-009-9169-z
growth in treated areas and for routine mapping and Adams JB, Smith MO, Johnson PE (1985) Spectral mixture
regular updating purposes. modeling: a new analysis of rock and soil types at the
Viking Lander 1 site. J Geophys Res 91:8098–8112.
Acknowledgements Authors would like to thank Dr. James https://doi.org/10.1029/JB091iB08p08098
Marcaccio, Jordan DeBoer, and Dr. Chantel Markle for support Ailstock MS, Norman CM, Bushmann PJ (2001) Common reed
with UAV image acquisition and field data collection. We Phragmites australis: control and effects upon biodiversity
would like to thank Jennifer Angoh (Trent University) and Dr. in freshwater nontidal wetlands. Restor Ecol 9:49–59.
Christina Davy (Trent University and Ontario Ministry of https://doi.org/10.1046/j.1526-100x.2001.009001049.x
Natural Resources and Forestry) for sharing field data from the Albert A, Brisson J, Belzile F et al (2015) Strategies for a suc-
RBM site. We are grateful to the Nature Conservancy of Canada cessful plant invasion: the reproduction of Phragmites
for providing partial funding for this study. We would also like australis in north-eastern North America. J Ecol
to thank Canadian Wildlife Service and Ministry of 103:1529–1537. https://doi.org/10.1111/1365-2745.12473
Environment and Climate Change Canada for providing Avers B, Fahlsing R, Kafcas E, et al (2007) A guide to the
permission to conduct field work at the BCNWA site. We are control and management of invasive Phragmites. Mich
grateful to the Nature Conservancy of Canada and Parks Ontario Dep Environ Qual Lansing
for the Phragmites treatment locations data for this study. We Bachmann CM, Donato TF, Lamela GM et al (2002) Automatic
would like to express our gratitude to the reviewers and classification of land cover on Smith Island, VA, using
Associate Editor for providing valuable comments and HyMAP imagery. IEEE Trans Geosci Remote Sens
suggestions to improve our manuscript. 40:2313–2330. https://doi.org/10.1109/TGRS.2002.
804834
Boardman JW (1998) Leveraging the high dimensionality of
Author contributions All authors contributed to the study
AVIRIS data for improved sub-pixel target unmixing and
conception and design. Data collection and image processing
rejection of false positives: mixture tuned matched filter-
were conducted by Prabha A. Rupasinghe and the data analysis
ing. In: Summaries of the seventh JPL Airborne Geo-
was performed by both authors, Prabha A. Rupasinghe and P.
science Workshop, JPL Publication, 1998. NASA Jet
Chow-Fraser. The first draft of the manuscript was written by
Propulsion Laboratory, pp 55–56
Prabha A. Rupasinghe and P. Chow-Fraser commented and
Boardman JW, Kruse FA (2011) Analysis of imaging spec-
contributed to previous versions of the manuscript. All authors
trometer data using N-dimensional geometry and a mix-
read and approved the final manuscript.
ture-tuned matched filtering approach. IEEE Trans Geosci
Remote Sens 49:4138–4152. https://doi.org/10.1109/
Funding This study was partially funded by the Nature TGRS.2011.2161585
Conservancy of Canada (NCC). Boardman JW, Kruse FA, Green RO (1995) Mapping target
signatures via partial unmixing of AVIRIS data. In: JPL
Availability of data and materials WV2/3 images analysed airborne Earth science workshop, pp 23–26
during the current study are not publicly available because they Bolton RM, Brooks RJ (2010) Impact of the seasonal invasion of
are only licensed for use by researchers at McMaster University; Phragmites australis (common reed) on turtle reproductive
ground reference data were collected and/or shared by a number success. Chelonian Conserv Biol 9:238–243. https://doi.
of other agencies and institutions specifically for this study only org/10.2744/CCB-0793.1
(Please refer to the acknowledgment section for further details). Bourgeau-Chavez L, Endres S, Battaglia M et al (2015)
Individuals interested in interim or final data and details of Development of a bi-national Great Lakes coastal wetland
procedures should contact the corresponding author with a and land use map using three-season PALSAR and Landsat
written request.
123P. A. Rupasinghe, P. Chow-Fraser
imagery. Remote Sens 7:8655–8682. https://doi.org/10. Kurihara J, Takahashi Y, Sakamoto Y et al (2018) HPT: a high
3390/rs70708655 spatial resolution multispectral sensor for microsatellite
Brelsford C, Shepherd D (2013) Using mixture tuned match remote sensing. Sensors. https://doi.org/10.3390/
filtering to measure changes in subpixel vegetation area in s18020619
Las Vegas, Nevada. In: Remote sensing and modeling of L3Harris Geospatial (2020) ENVI—The leading geospatial
ecosystems for sustainability X. International Society for image analysis software. https://www.harrisgeospatial.
Optics and Photonics, San Diego, California, United States, com/Software-Technology/ENVI. Accessed 25 Mar 2020
p 88690B Lambert AM, Dudley TL, Saltonstall K (2010) Ecology and
Brisson J, de Blois S, Lavoie C (2010) Roadside as invasion impacts of the large-statured invasive grasses Arundo
pathway for common reed (Phragmites australis). Invasive donax and Phragmites australis in North America. Inva-
Plant Sci Manag 3:506–514. https://doi.org/10.1614/ sive Plant Sci Manag 3:489–494. https://doi.org/10.1614/
IPSM-09-050.1 IPSM-D-10-00031.1
Burgess ND, Evans CE (1989) The management of reedbeds for Lass LW, Prather TS, Glenn NF et al (2005) A review of remote
birds. Information Press, Oxford sensing of invasive weeds and example of the early
Campbell JB (2002) Introduction to remote sensing, 3rd edn. detection of spotted knapweed (Centaurea maculosa) and
The Guilford Press, New York baby’s breath (Gypsophila paniculata) with a hyperspec-
Chambers RM, Meyerson LA, Saltonstall K (1999) Expansion tral sensor. Weed Sci 53:242–251. https://doi.org/10.1614/
of Phragmites australis into tidal wetlands of North WS-04-044R2
America. Aquat Bot 64:261–273. https://doi.org/10.1016/ Lathrop RG, Windham L, Montesano P (2003) Does Phragmites
S0304-3770(99)00055-8 expansion alter the structure and function of marsh land-
Cook CE, McCluskey AM, Chambers RM (2018) Impacts of scapes? Patterns and processes revisited. Estuaries
invasive Phragmites australis on diamondback terrapin 26:423–435. https://doi.org/10.1007/BF02823719
nesting in Chesapeake Bay. Estuaries Coasts 41:966–973. Long Point Crown Marsh Rehabilitation Steering Commit-
https://doi.org/10.1007/s12237-017-0325-z teeLong Point Crown Marsh Rehabilitation Steering
Deegan BM, White SD, Ganf GG (2007) The influence of water Committee (2007) Toward Rehabilitation of the Crown
level fluctuations on the growth of four emergent macro- Marsh - Long Point, Lake Erie, Ontario. Ontario Ministry
phyte species. Aquat Bot 86:309–315. https://doi.org/10. of Natural Resources, University of Western Ontario, Long
1016/j.aquabot.2006.11.006 Point Waterfowl and Wetlands Research Fund, Long Point
Derr JF (2008) Common reed (Phragmites australis) response to Waterfowlers Association, Bird Studies Canada, Bird
mowing and herbicide application. Invasive Plant Sci Studies Canada
Manag 1:12–16. https://doi.org/10.1614/IPSM-07-001.1 Lopez RD, Edmonds CM, Neale AC, et al (2004) Accuracy
European Space Agency (2020) Sentinel-2 missions resolution assessments of airborne hyperspectral data for mapping
and swath sentinel handbook. https://sentinel.esa.int/web/ opportunistic plant species in freshwater coastal wetlands.
sentinel/missions/sentinel-2/instrument-payload/ In: Lunetta RS, Lyon JG (eds)In remote sensing and GIS
resolution-and-swath. Accessed 2 Mar 2020 accuracy assessment. CRC Press, Boca Raton, pp 253–267
Finkelstein SA, Davis AM (2006) Paleoenvironmental records Mal TK, Narine L (2004) The biology of Canadian weeds. 129.
of water level and climatic changes from the middle to late Phragmites australis (Cav.) Trin. ex Steud. Can J Plant Sci
holocene at a Lake Erie coastal wetland, Ontario, Canada. 84:365–396. https://doi.org/10.4141/P01-172
Quat Res 65:33–43. https://doi.org/10.1016/j.yqres.2005. Mann DL, Nelson JG (1980) Ideology and wildlands manage-
08.021 ment: the case of Rondeau Provincial Park, Ontario.
Gagnon Lupien N, Gauthier G, Lavoie C (2015) Effect of the Environ Manage 4:111–124. https://doi.org/10.1007/
invasive common reed on the abundance, richness and BF01866508
diversity of birds in freshwater marshes. Anim Conserv Marcaccio JV, Markle CE, Chow-Fraser P (2016) Use of fixed-
18:32–43. https://doi.org/10.1111/acv.12135 wing and multi-rotor unmanned aerial vehicles to map
Garmin, subsidiaries GL or its Garmin eTrexÒ 10 | Outdoor dynamic changes in a freshwater marsh. J Unmanned Veh
GPS. In: Garmin. https://buy.garmin.com/en-CA/CA/p/ Syst 4:193–202. https://doi.org/10.1139/juvs-2015-0016
87768. Accessed 18 Apr 2020 Markle CE, Chow-Fraser P (2018) Effects of European common
Gilbert J (2015) Rondeau provincial park invasive Phragmites reed on Blanding’s turtle spatial ecology. J Wildl Manag
management program 2008–2014 summary report and 82:857–864. https://doi.org/10.1002/jwmg.21435
recommended next steps Marks M, Lapin B, Randall J (1994) Phragmites australis (P.
Gilbert J, Vidler N, Cloud Sr P, et al (2014) Phragmites australis communis): threats, management and monitoring. Nat
at the crossroads: why we cannot afford to ignore this Areas J 14:285–294
invasion. In: Proceedings of great lakes wetlands day. McNabb CD, Batterson TR (1991) Occurrence of the common
Toronto, ON, Canada, pp 78–84 reed, Phragmites australis, along roadsides in Lower
Hara T, van Der Toorn J, Mook JH (1993) Growth dynamics and Michigan. Mich Acad USA 23:211–220
size structure of shoots of Phragmites Australis, a Clonal Meyerson LA, Saltonstall K, Windham L et al (2000) A com-
Plant. J Ecol 81:47–60. https://doi.org/10.2307/2261223 parison of Phragmites australis in freshwater and brackish
Harris Geospatial Solutions, Inc (2020) Mixture tuned matched marsh environments in North America. Wetl Ecol Manag
filtering. https://www.harrisgeospatial.com/docs/MTMF. 8:89–103. https://doi.org/10.1023/A:1008432200133
html. Accessed 21 Mar 2020 Ministry of Natural Resources and Forestry (2019) Invasive
Phragmites Control at Long Point Region and Rondeau
123Mapping Phragmites cover using WorldView 2/3 and Sentinel 2 images
Provincial Park Implementation Plan—2019 Ministry of SenseFly (2020a) senseFly—eBee Classic. In: senseFly. https://
Natural Resources and Forestry Ministry of Environment, www.sensefly.com/homepage/ebee-small. Accessed 18
Conservation and Park, Canadian Wildlife Service Apr 2020
Nikolakopoulos K, Oikonomidis D (2015) Quality assessment SenseFly (2020b) senseFly—Parrot Sequoia?. In: senseFly.
of ten fusion techniques applied on Worldview-2. Eur J https://www.sensefly.com/camera/parrot-sequoia. Acces-
Remote Sens 48:141–167. https://doi.org/10.5721/ sed 18 Apr 2020
EuJRS20154809 Taddeo S, Blois SD (2012) Coexistence of introduced and native
Phillips RL, Beeri O, DeKeyser ES (2005) Remote wetland common reed (Phragmites australis) in freshwater wet-
assessment for Missouri Coteau prairie glacial basins. lands. Écoscience 19:99–105. https://doi.org/10.2980/19-
Wetlands 25:335–349 2-3468
Poulin B, Davranche A, Lefebvre G (2010) Ecological assess- Uddin MN, Robinson RW, Caridi D, Al Harun MAY (2014)
ment of Phragmites australis wetlands using multi-season Suppression of native Melaleuca ericifolia by the invasive
SPOT-5 scenes. Remote Sens Environ 114:1602–1609. Phragmites australis through allelopathic root exudates.
https://doi.org/10.1016/j.rse.2010.02.014 Am J Bot 101:479–487. https://doi.org/10.3732/ajb.
Rodrı́guez M, Brisson J (2015) Pollutant removal efficiency of 1400021
native versus exotic common reed (Phragmites australis) Vretare V, Weisner SE, Strand JA, Granéli W (2001) Pheno-
in North American treatment wetlands. Ecol Eng typic plasticity in Phragmites australis as a functional
74:364–370. https://doi.org/10.1016/j.ecoleng.2014.11. response to water depth. Aquat Bot 69:127–145. https://
005 doi.org/10.1016/S0304-3770(01)00134-6
Rupasinghe PA, Chow-Fraser P (2019) Identification of most Weinstein MP, Balletto JH (1999) Does the common reed,
spectrally distinguishable phenological stage of invasive Phragmites australis, affect essential fish habitat? Estuar-
Phramites australis in Lake Erie wetlands (Canada) for ies 22:793–802. https://doi.org/10.2307/1353112
accurate mapping using multispectral satellite imagery. Weisner SEB, Strand JA (1996) Rhizome architecture in
Wetl Ecol Manag 27:513–538. https://doi.org/10.1007/ Phragmites australis in relation to water depth: implica-
s11273-019-09675-2 tions for within-plant oxygen transport distances. Folia
Rupasinghe P, Markle C, Marcaccio J, Chow-Fraser P (2017) Geobot 31:91–97. https://doi.org/10.1007/BF02803998
Determination of treatment effectiveness of Phragmites Wilcox KL, Petrie SA, Maynard LA, Meyer SW (2003) His-
autralis at Rondeau Bay Provincial Park, ON. In: Pro- torical distribution and abundance of Phragmites australis
ceedings of CASIOPA. Georgian Bay Hotel and Confer- at long point, Lake Erie, Ontario. J Gt Lakes Res
ence Centre, Collingwood, ON, p 24 29:664–680. https://doi.org/10.1016/S0380-
Rutchey K, Vilchek L (1999) Air photointerpretation and 1330(03)70469-9
satellite imagery analysis techniques for mapping cattail Williams AP, Hunt ER Jr (2002) Estimation of leafy spurge
coverage in a northern Everglades impoundment. Pho- cover from hyperspectral imagery using mixture tuned
togramm Eng Remote Sens 65:185–191 matched filtering. Remote Sens Environ 82:446–456.
Saltonstall K (2002) Cryptic invasion by a non-native genotype https://doi.org/10.1016/S0034-4257(02)00061-5
of the common reed, Phragmites australis, into North Williams AEP, Hunt ER Jr (2004) Accuracy assessment for
America. Proc Natl Acad Sci 99:2445–2449. https://doi. detection of leafy spurge with hyperspectral imagery.
org/10.1073/pnas.032477999 Rangel Ecol Manag 57:106–112. https://doi.org/10.2111/
Satellite Image Corporation (2017a) WorldView-3 Satellite 1551-5028(2004)057[0106:AAFDOL]2.0.CO;2
Sensor. https://www.satimagingcorp.com/satellite- Yuckin S, Rooney R (2019) Significant increase in nutrient
sensors/worldview-3/. Accessed 2 Mar 2020 stocks following Phragmites australis invasion of fresh-
Sawaya KE, Olmanson LG, Heinert NJ et al (2003) Extending water meadow marsh but not of Cattail Marsh. Front
satellite remote sensing to local scales: land and water Environ Sci. https://doi.org/10.3389/fenvs.2019.00112
resource monitoring using high-resolution imagery.
Remote Sens Environ 88:144–156. https://doi.org/10.
Publisher’s Note Springer Nature remains neutral with
1016/j.rse.2003.04.006
regard to jurisdictional claims in published maps and
Schmidt KS, Skidmore AK (2001) Exploring spectral discrim-
institutional affiliations.
ination of grass species in African rangelands. Int J Remote
Sens 22:3421–3434. https://doi.org/10.1080/
01431160152609245
123You can also read